Data Systems & Analytics

Data systems and analytics examine how information is collected, structured, analyzed, and transformed into knowledge that supports research, governance, and decision-making. Modern societies generate vast volumes of data across economic activity, environmental monitoring, technological infrastructure, and institutional processes. Data systems provide the architecture that allows this information to be stored, processed, and analyzed in meaningful ways.

Analytical methods range from statistical modeling and machine learning to visualization systems and simulation platforms that reveal patterns within complex datasets. Data systems also encompass the pipelines and infrastructure that support data integration, data governance, and reproducible analytics across organizations and research environments.

Beyond technical implementation, the study of data systems raises broader questions about data quality, privacy, governance, and ethical use. As data becomes increasingly central to policy analysis, scientific research, and technological innovation, the design of transparent, accountable, and robust data systems has become essential for maintaining trust in data-driven decision-making.

Conceptual data-systems illustration showing customer, organization, product, location, and asset records being matched, resolved, governed, and connected into trusted master data entities.

Master Data Management and Entity Resolution in Modern Data Systems

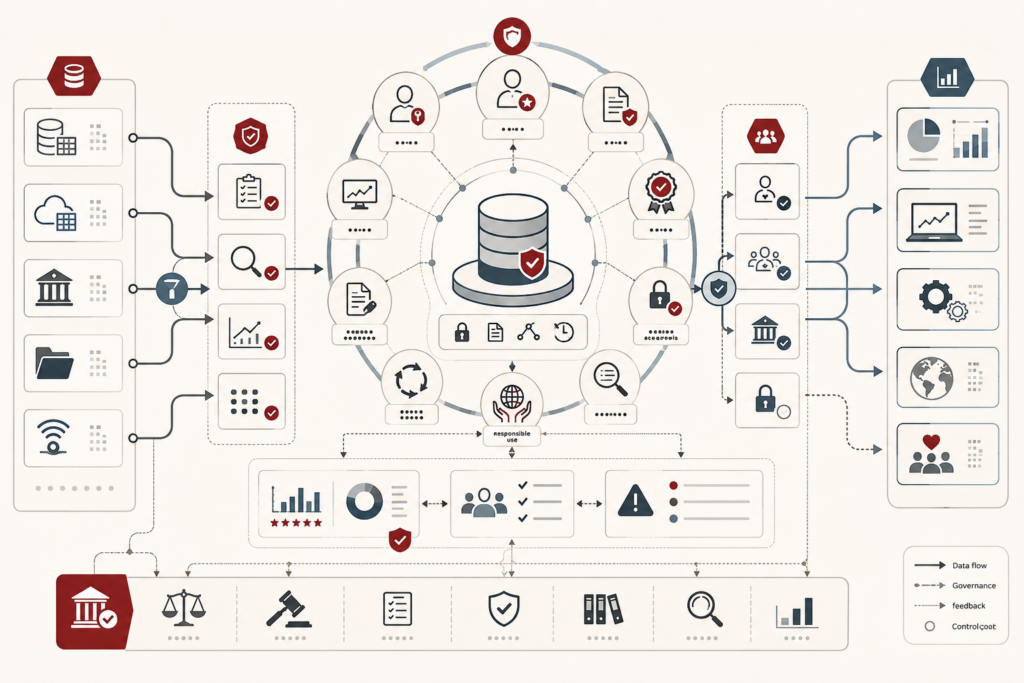
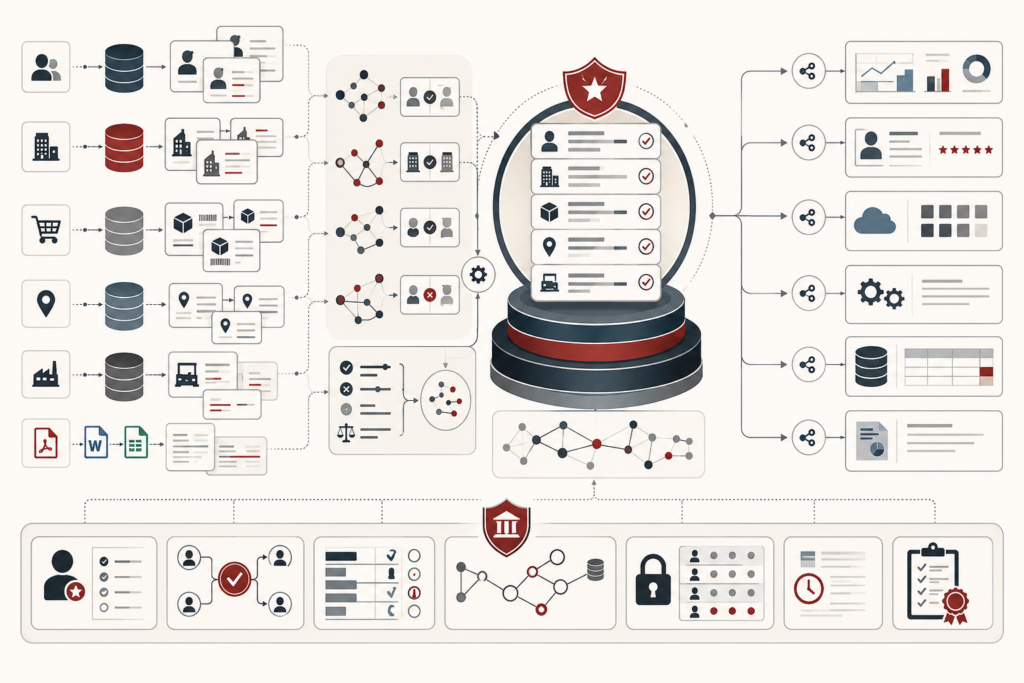
Master data management and entity resolution make core organizational entities trustworthy across fragmented systems. This article frames MDM not as simple deduplication, but as representational governance: the discipline of defining, matching, stewarding, versioning, and authorizing the entities that data systems claim to describe. It explains how customers, suppliers, facilities, products, legal entities, households, and assets become unstable when identifiers, names, hierarchies, and source-system meanings diverge. The article examines deterministic, probabilistic, hybrid, and graph-based matching; precision-recall trade-offs; survivorship rules; golden records; stewardship workflows; hierarchy modeling; legal-entity identifiers; privacy risks; and regulated identity-resolution limits. A mathematical lens and Python/R workflows show how teams can evaluate match confidence, merge risk, master-entity maturity, stewardship burden, and lineage. Its central argument is that trustworthy analytics depends on governing identity itself.

Conceptual data-systems illustration showing data sources, validated evidence, charts, tables, maps, report structure, review checkpoints, audit controls, and a published analytical report.

Information Design and Analytical Reporting: Structure, Evidence, and Report Integrity

Information design and analytical reporting make evidence readable, traceable, and fit for responsible use. This article frames reporting not as downstream decoration, but as evidence architecture: the discipline of arranging claims, visuals, tables, prose, methods, uncertainty, review records, and appendices so readers can understand and evaluate analytical findings. It explains why report genre, audience, reader pathways, hierarchy, summaries, traceability, chart/table selection, baselines, uncertainty placement, methods disclosure, and versioned outputs all shape analytical trust. The article also examines reporting as institutional memory, governance artifact, decision record, and reproducible workflow. A mathematical lens and Python/R workflows show how teams can evaluate report integrity, evidence traceability, visual-table fit, uncertainty placement, methods sufficiency, review quality, output control, and reporting risk.

Conceptual data-systems illustration showing an interactive analytics dashboard with charts, maps, filters, monitoring alerts, exploratory controls, narrative panels, governance checks, and decision-support outputs.

Interactive Dashboards and Data Storytelling: Monitoring, Exploration, and Narrative Clarity

Interactive dashboards and data storytelling make analytical evidence navigable, contextual, and useful for decision support. This article frames dashboards not as collections of charts, but as governed analytical interfaces for monitoring, exploration, filtering, drill-down, and recurring judgment. It explains how data storytelling adds guided interpretation through sequencing, annotation, story points, caveats, and evidence framing. The article examines dashboard modes, KPI context, naked metrics, filter burden, linked views, progressive disclosure, cognitive load, accessibility, governance, metadata, lineage, and responsible interaction design. It also warns against clutter, hidden filter state, tooltip dependency, narrative overreach, and ungoverned dashboard surfaces. A mathematical lens and Python/R workflows show how teams can evaluate dashboard integrity, KPI context, interaction clarity, story coherence, accessibility, governance review, and evidence traceability.

Conceptual data-systems illustration showing charts, maps, uncertainty bands, distributions, comparison views, evidence panels, and communication pathways for analytical interpretation.

Data Visualization and Analytical Communication: Clarity, Uncertainty, and Visual Reasoning

Data visualization and analytical communication make evidence visible, interpretable, and trustworthy. This article frames visualization not as decoration, but as visual reasoning: the discipline of choosing chart forms, encodings, scales, annotations, uncertainty displays, and accessibility practices that help audiences compare, question, and understand analytical findings. It explains why visual communication depends on audience, context, perceptual accuracy, chart-task fit, distributional thinking, uncertainty placement, dashboard design, narrative framing, and evidence traceability. The article also examines common failures such as misleading scales, decorative complexity, hidden uncertainty, inaccessible color use, mismatched chart types, and false narrative closure. A mathematical lens and Python/R workflows show how teams can evaluate visual integrity, chart fit, encoding quality, uncertainty communication, accessibility, review status, and source traceability.

Conceptual machine-learning evaluation illustration showing calibration curves, thresholds, confusion matrices, prediction distributions, error patterns, drift monitoring, governance review, and model-quality decisions.

Model Evaluation and Performance Metrics: Calibration, Thresholds, and Model Quality

Model evaluation and performance metrics determine whether a predictive system is fit for the task it is meant to perform. This article frames evaluation not as a final scoreboard, but as model-quality evidence: the disciplined assessment of metrics, thresholds, calibration, error distributions, subgroup performance, monitoring drift, and governance limits. It explains why accuracy, precision, recall, ROC-AUC, average precision, Brier score, log loss, MAE, RMSE, and tail-error measures each answer different questions. The article also examines proper scoring rules, threshold policy, rare-event imbalance, calibration gaps, multiclass aggregation, metric uncertainty, lifecycle monitoring, and institutional accountability. A mathematical lens and Python/R workflows show how teams can evaluate classification behavior, probability quality, regression error, subgroup stability, monitoring flags, and risk-based model readiness.

Conceptual machine-learning illustration showing raw data transformed into encoded features, embeddings, engineered variables, representation layers, model inputs, evaluation metrics, and governance checks.

Feature Engineering and Data Representation: Encoding, Embeddings, and Learnable Signal

Feature engineering and data representation determine what a model can actually learn from raw data. This article frames representation not as preprocessing trivia, but as model design before the model: the disciplined construction of numerical transformations, categorical encodings, feature crosses, temporal features, embeddings, derived variables, feature-selection workflows, and leakage controls. It explains why representation shapes inductive bias, learnable signal, sparsity, dimensionality, interpretability, prediction-time validity, and downstream model behavior. The article also examines numerical scaling, one-hot encoding, high-cardinality categories, cyclical time, learned embeddings, domain-derived variables, feature stores, lineage, governance, and operational representation. A mathematical lens and Python/R workflows show how teams can evaluate feature integrity, transformation validity, leakage risk, sparsity, selection status, representation readiness, and governance review.

Conceptual machine-learning workflow showing data preparation, train-validation-test splits, cross-validation, training loops, hyperparameter tuning, diagnostics, performance summaries, governance review, and deployment readiness.

Model Training and Validation: Generalization, Cross-Validation, and Model Credibility

Model training and validation determine whether a predictive system has learned generalizable structure or merely fit historical data. This article frames training and validation as generalization evidence: the disciplined process of splitting data, fitting preprocessing safely, tuning hyperparameters, comparing models, protecting final test evidence, and revalidating after deployment. It explains why train-validation-test roles must remain distinct, why cross-validation and nested validation matter, and how leakage, improper preprocessing, weak split design, test-set erosion, and fold instability can create misleading performance claims. The article also examines empirical risk, generalization gaps, learning curves, early stopping, grouped and temporal splits, pipeline integrity, monitoring, governance, and institutional accountability. A mathematical lens and Python/R workflows show how teams can evaluate split integrity, fold stability, leakage control, final test reliability, and revalidation readiness.

Scroll to Top