
Last Updated May 11, 2026
Data Systems & Analytics examines how information is collected, structured, governed, processed, modeled, interpreted, visualized, secured, and transformed into reliable knowledge for research, operations, policy, science, sustainability, infrastructure, and institutional decision-making. It is not limited to dashboards, databases, statistics, machine learning, business intelligence, or cloud platforms. It studies the full analytical infrastructure through which institutions decide what can be measured, what can be trusted, what patterns can be detected, what uncertainty remains, and how evidence becomes action.
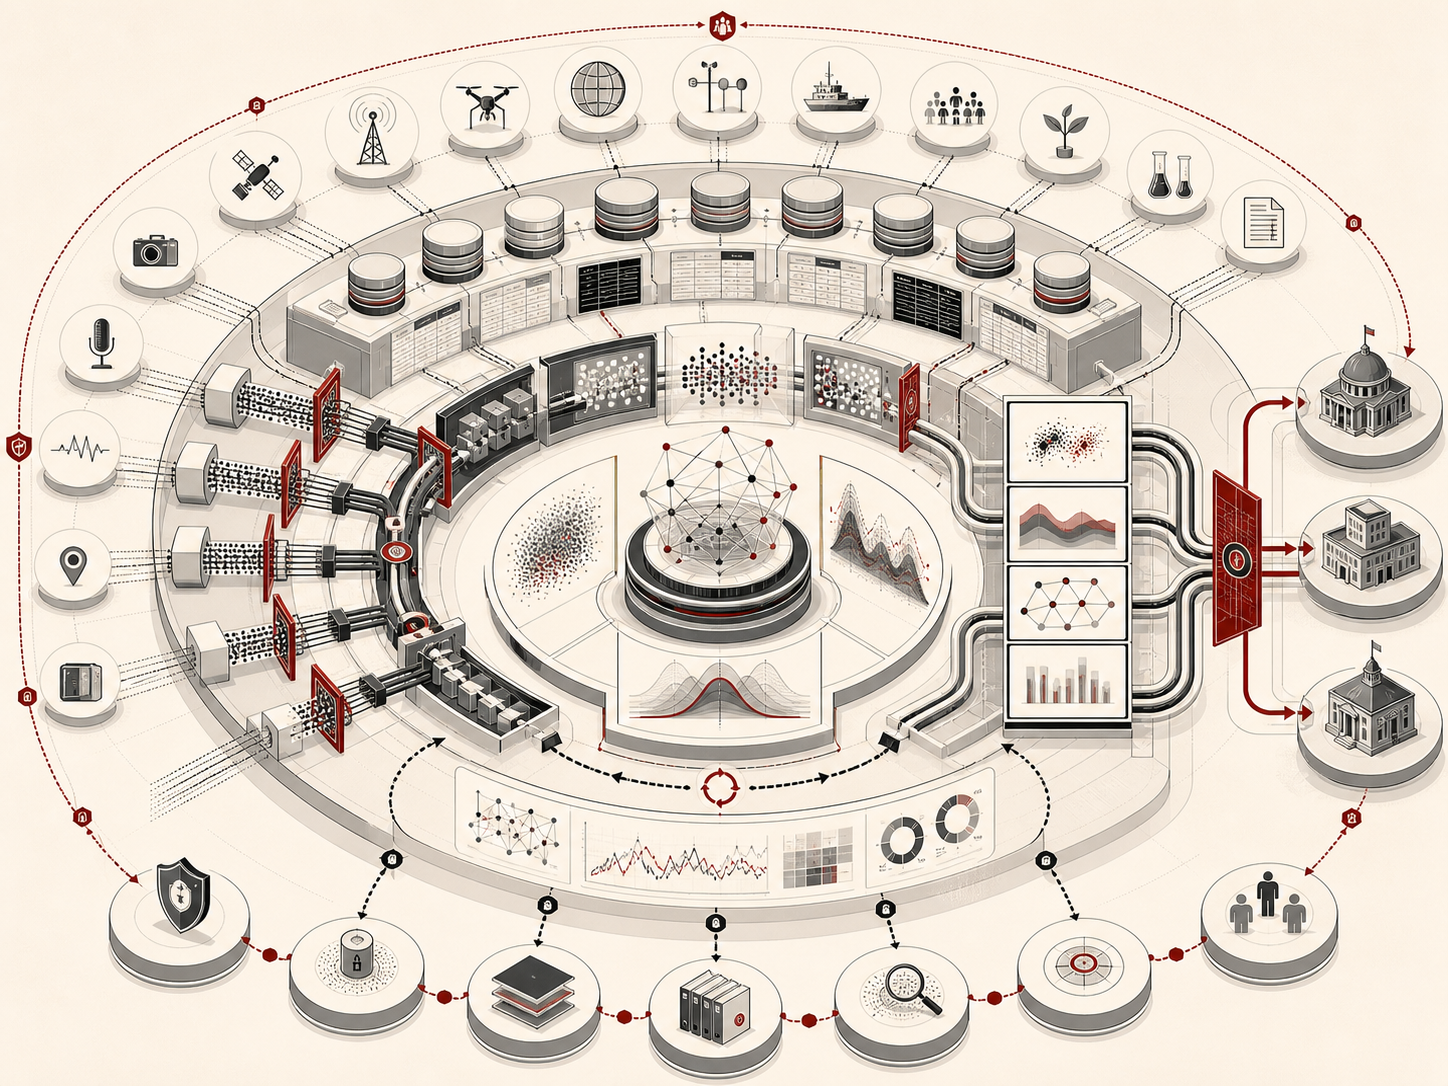
Modern institutions generate data across scientific research, environmental monitoring, economic activity, public administration, infrastructure systems, health systems, education, finance, logistics, digital platforms, and governance. Yet raw data does not automatically become insight. Data must be collected through credible instruments, stored in appropriate architectures, cleaned, validated, documented, secured, versioned, modeled, interpreted, communicated, monitored, and governed. Without that full lifecycle, data can mislead as easily as it can inform.
Main Library
Publications
Current Space
Technology & Systems Intelligence
Related Topic
Artificial Intelligence Systems
Related Topic
Environmental Monitoring Systems
Related Topic
Intelligent Infrastructure Systems
Data Systems & Analytics treats data infrastructure as sociotechnical infrastructure. A database schema, pipeline, metric layer, statistical model, machine-learning workflow, dashboard, report, data product, catalog, or decision tool is never merely technical. It encodes assumptions about categories, measurement, quality, access, ownership, privacy, governance, accountability, and value. Poorly designed data systems can reproduce bias, obscure uncertainty, create false precision, weaken institutional trust, and automate flawed decisions. Well-designed systems can support transparency, reproducibility, monitoring, scientific discovery, public accountability, operational learning, and responsible decision-making under complexity.
The series brings together database systems, SQL, data engineering, analytics engineering, statistical modeling, machine learning, data visualization, data governance, metadata, lineage, observability, reproducible workflows, decision analytics, privacy-preserving methods, and modern data platform architecture. It also connects technical practice to broader questions of institutional trust, scientific integrity, sustainability, infrastructure resilience, artificial intelligence, environmental monitoring, economic analysis, public decision support, and the ethical use of measurement.
What Are Data Systems and Analytics?
Data systems and analytics examine how information is structured, processed, analyzed, interpreted, secured, communicated, and governed in order to support understanding and decision-making. Traditional statistics focuses on inference from data. Modern data systems address a wider problem: the infrastructure required to manage data across its full lifecycle, from collection and storage to transformation, modeling, visualization, monitoring, reuse, and institutional accountability.
A data system includes databases, file formats, schemas, pipelines, metadata, access controls, data catalogs, governance rules, quality checks, orchestration logic, analytical models, reporting layers, dashboards, APIs, reproducible environments, semantic definitions, lineage records, security controls, and decision interfaces. Analytics uses this infrastructure to summarize data, identify patterns, estimate relationships, forecast outcomes, evaluate interventions, support decisions, and communicate uncertainty.
The most important point is that analytics quality depends on system quality. A model is only as reliable as the data, assumptions, lineage, definitions, governance, and deployment environment beneath it. A dashboard can be elegant while resting on inconsistent metrics. A machine-learning model can perform well on a benchmark while failing in deployment because production data has drifted. A dataset can be large while still being biased, incomplete, poorly documented, or ethically unsafe. Data systems and analytics therefore require both technical competence and institutional discipline.
Why This Field Matters
Data systems now shape how institutions understand the world. They support climate monitoring, financial analysis, health surveillance, supply-chain management, infrastructure operations, scientific research, artificial intelligence, public policy, marketing analytics, labor-market analysis, economic forecasting, sustainability reporting, public accountability, risk monitoring, and organizational performance measurement. The ability to collect, integrate, model, govern, and interpret data has become a central form of institutional capacity.
Yet this dependence also creates risk. Data systems can generate false confidence when uncertainty is hidden. They can reproduce social categories without questioning how those categories were created. They can automate decisions before definitions are stable. They can privilege measurable phenomena while excluding lived experience, local knowledge, qualitative evidence, or forms of harm that are difficult to encode. They can become opaque infrastructures of power when access, interpretation, and governance are concentrated in technical teams, vendors, platforms, or automated systems.
For that reason, data systems and analytics should not be treated as neutral back-office tools. They are part of the institutional architecture of knowledge. They determine what is visible, what is measured, what becomes operationally actionable, what remains outside the frame, who can interpret the evidence, and who is affected by decisions derived from data. A serious data pillar must therefore address engineering, statistics, governance, reproducibility, ethics, privacy, security, and communication together.
The Data Lifecycle
The lifecycle of data systems describes how information moves from observation to evidence. The stages are not always linear, but each stage affects the reliability of every later stage.
- Data collection — gathering information from sensors, surveys, administrative systems, transactions, experiments, documents, logs, images, scientific instruments, APIs, digital platforms, or public records.
- Data storage — organizing information in relational databases, object stores, warehouses, lakes, lakehouses, graph databases, time-series stores, vector stores, archives, or distributed systems.
- Data modeling — defining entities, relationships, metrics, dimensions, schemas, semantics, grain, keys, constraints, and business logic.
- Data integration — connecting systems through APIs, CDC, batch ingestion, streaming, contracts, interoperability standards, and entity reconciliation.
- Data cleaning — detecting missing values, outliers, invalid formats, duplicates, inconsistent units, broken keys, implausible records, and incomplete classifications.
- Data transformation — reshaping raw data into analytic tables, features, aggregates, semantic models, indicators, data products, and reproducible research datasets.
- Data validation — applying tests for schema conformance, referential integrity, distributions, freshness, completeness, uniqueness, validity, drift, and expected ranges.
- Analysis and modeling — using descriptive statistics, inference, forecasting, machine learning, causal methods, simulation, optimization, or decision analytics.
- Visualization and reporting — communicating findings through charts, dashboards, reports, notebooks, narratives, maps, tables, alerts, and decision-support tools.
- Governance and stewardship — managing ownership, access, privacy, retention, lineage, metadata, quality, ethics, security, accountability, and certification.
- Monitoring and reuse — tracking drift, failures, metric changes, pipeline reliability, model performance, access patterns, and the continued validity of analytical outputs.
Understanding this lifecycle is essential because analytical failures often originate upstream. A flawed definition, missing lineage record, inconsistent primary key, undocumented transformation, untested dashboard, weak privacy control, or poorly governed metric can undermine an entire analytical system.
Mathematical Lens
Data systems and analytics rely on mathematics because data quality, uncertainty, model performance, forecasting error, and metric reliability must be measured rather than merely asserted. Mathematical examples do not replace governance or judgment, but they make analytical claims inspectable.
C_j = 1 – \frac{m_j}{n}
\]
Interpretation: Completeness score \(C_j\) measures how populated field \(j\) is, where \(m_j\) is the number of missing values and \(n\) is the total number of records. A field can be technically available while still failing as evidence if missingness is patterned, unexplained, or concentrated in important groups.
Q = w_c C + w_u U + w_f F + w_v V
\]
Interpretation: A composite data-quality score \(Q\) can combine completeness \(C\), uniqueness \(U\), freshness \(F\), and validity \(V\). The weights should be justified by the use case rather than chosen arbitrarily, because not all quality failures have equal consequences.
\bar{x} = \frac{1}{n}\sum_{i=1}^{n}x_i
\]
Interpretation: The mean summarizes a variable, but it does not describe distribution shape, missingness, outliers, uncertainty, subgroup differences, measurement bias, or the data-generating process.
RMSE = \sqrt{\frac{1}{n}\sum_{i=1}^{n}(y_i – \hat{y}_i)^2}
\]
Interpretation: Root mean squared error compares observed values \(y_i\) with predicted values \(\hat{y}_i\). It can quantify forecast error, but it cannot by itself establish fairness, causal validity, interpretability, or decision legitimacy.
L = (S, T, R)
\]
Interpretation: A lineage relationship \(L\) can be represented as source \(S\), transformation \(T\), and result \(R\). This makes analytical output traceable instead of treating reports, dashboards, or models as isolated artifacts.
D = f(E, U, C, R)
\]
Interpretation: A decision \(D\) should be understood as a function of evidence \(E\), uncertainty \(U\), constraints \(C\), and responsibility \(R\). Data systems support decision-making only when they preserve enough context for interpretation and accountability.
| Symbol | Meaning | Data-systems interpretation |
|---|---|---|
| \(n\) | Number of records | The population of rows, events, observations, documents, readings, transactions, or cases being analyzed. |
| \(m_j\) | Missing values in field \(j\) | A measure of field-level incompleteness that may indicate collection failure, optionality, privacy suppression, workflow design, or upstream system gaps. |
| \(C_j\) | Completeness score | A quality metric used to evaluate whether a field is sufficiently populated for analysis. |
| \(Q\) | Composite quality score | A weighted quality index that can support monitoring, but should never hide which quality dimension failed. |
| \(y_i\) | Observed value | The measured outcome, KPI, sensor reading, event count, label, target variable, or institutional indicator. |
| \(\hat{y}_i\) | Predicted value | The forecast, model estimate, expected value, projected metric, or model-generated score. |
| \(L\) | Lineage relationship | The trace connecting source data, transformation logic, and analytical output. |
The mathematical lesson is institutional as much as technical. A completeness score can reveal missing data, but it cannot explain why values are missing. A model-error score can quantify predictive performance, but it cannot prove that a model is fair, stable, interpretable, or appropriate for a decision. Data systems require formal measurement and human accountability together.
Analytical Methods and Data Modeling
Data analytics uses statistical and computational methods to interpret information, detect patterns, quantify uncertainty, and support decision-making. These methods should be understood as part of a larger analytical system rather than isolated techniques.
- Descriptive analytics summarizes data through counts, distributions, trends, correlations, segments, cross-tabs, profiles, and exploratory analysis.
- Diagnostic analytics investigates observed outcomes through comparisons, decomposition, root-cause analysis, anomaly review, dependency tracing, and structured inquiry.
- Statistical inference estimates parameters, tests hypotheses, quantifies uncertainty, and supports cautious reasoning from samples or observed data-generating processes.
- Forecasting models temporal structure, trend, seasonality, autocorrelation, shocks, and forecast risk across time-dependent systems.
- Causal analytics estimates effects using experiments, quasi-experiments, counterfactual reasoning, identification strategies, and causal inference designs.
- Predictive analytics forecasts future values or classifies outcomes using statistical models, machine learning, feature engineering, validation, and model monitoring.
- Prescriptive analytics supports decisions through optimization, simulation, scenario analysis, decision frameworks, and policy evaluation.
- Monitoring analytics tracks systems in near real time to detect anomalies, drift, degradation, outages, quality failures, and emerging risk.
The quality of these methods depends on clear definitions, appropriate assumptions, data quality, model validation, domain knowledge, and communication of uncertainty. Analytics should not be reduced to prediction. In many institutional settings, explanation, monitoring, evaluation, governance, and accountable decision support matter more than raw predictive performance.
Governance, Reliability, and Trust
Modern data systems require governance because analytical outputs shape decisions. Governance defines who owns data, who can access it, how definitions are approved, how quality is measured, how privacy is protected, how lineage is documented, how changes are reviewed, how sensitive data is handled, and how analytical claims can be audited. Without governance, data systems often fragment into inconsistent spreadsheets, conflicting dashboards, duplicate metrics, undocumented transformations, uncontrolled extracts, and unverified decision tools.
Reliability is equally important. A data pipeline is a production system. It can fail because of schema changes, missing upstream feeds, malformed records, delayed ingestion, broken transformations, silent metric drift, unauthorized access, untested assumptions, unreviewed model changes, or poorly handled edge cases. Observability, testing, version control, reproducible environments, data contracts, lineage, and incident response are therefore not optional technical luxuries. They are foundations of trustworthy analytics.
Trust is built when users can understand where data came from, how it was transformed, what assumptions were made, what uncertainty remains, who owns the asset, who approved the definition, what quality checks passed, and who is accountable for the result. Trust is weakened when systems are opaque, brittle, undocumented, overconfident, or disconnected from the people and institutions affected by their outputs. The central aim of data systems and analytics is not merely to produce more information. It is to produce usable, reliable, interpretable, accountable, and responsibly governed knowledge.
Core Domains of Data Systems and Analytics
Data Systems & Analytics encompasses several major domains:
- database systems, SQL, storage models, and data architecture
- data warehouses, data lakes, lakehouses, object storage, and open table formats
- distributed data systems, streaming analytics, and real-time event processing
- data engineering, ETL, ELT, orchestration, and transformation systems
- data cleaning, validation, profiling, data quality, and observability
- metadata, catalogs, lineage, data contracts, and semantic layers
- analytics engineering, governed metrics, and reusable analytical models
- data governance, stewardship, privacy, security, access control, and accountability
- descriptive analytics, statistical inference, forecasting, and causal analysis
- machine learning, predictive analytics, feature engineering, evaluation, and MLOps
- data visualization, reporting, dashboards, information design, and decision support
- reproducible analytics, versioned workflows, computational notebooks, and research computing
- applied data systems for environmental monitoring, economics, public health, infrastructure, scientific research, and institutional learning
Each domain contributes to the broader goal of transforming raw information into reliable analytical insight. The field is strongest when infrastructure, modeling, governance, and communication are treated as one system.
Data Systems & Analytics Article Map
The roadmap below organizes the Data Systems & Analytics knowledge series into conceptual domains. Published articles are linked directly using the current article list. Planned articles are deliberately left unlinked and marked as planned so the map can function as both a public index and a long-range technical architecture for the series.
Data Infrastructure and Architecture
- Database Systems and Data Architecture — Establishes databases and data architecture as the foundation for storing, relating, constraining, querying, securing, moving, retaining, and interpreting institutional data.
- Relational Databases and SQL Systems — Introduces relational modeling, SQL, tables, keys, joins, normalization, constraints, transactions, indexes, query planning, and the role of relational systems in durable data infrastructure.
- Data Warehouses and Data Lakes: Architecture, Governance, and Analytics — Compares warehouses, lakes, and lakehouse-style analytical storage patterns through the lens of architecture, governance, analytics readiness, and large-scale evidence management.
- Distributed Data Systems: Replication, Partitioning, and Consistency — Examines how data is partitioned, replicated, coordinated, queried, recovered, and governed across multiple machines when scale, availability, and fault tolerance matter.
- Cloud Data Platforms and Modern Data Stack Architecture — Maps cloud-native storage, ingestion, transformation, orchestration, governance, semantic layers, and analytical consumption within modern modular data platforms.
- Data Integration and Interoperability in Modern Data Systems — Covers how systems exchange information across formats, APIs, standards, schemas, platforms, and institutional boundaries without losing meaning or reliability.
- Master Data Management and Entity Resolution in Modern Data Systems — Explains how organizations define core entities, reconcile duplicate records, manage golden records, and improve trust in shared data assets.
- Data Lifecycle Management and Retention — Examines how data is created, stored, used, archived, retained, deleted, and governed across its institutional and technical lifespan.
- Lakehouse Architecture and Open Table Formats (planned) — Will examine warehouse-lake convergence, object storage, transactional table layers, open formats, versioned datasets, schema evolution, table metadata, and reproducible analytical storage.
- Graph Databases and Relationship-Centered Data Architecture (planned) — Will study nodes, edges, traversal, graph query languages, knowledge graphs, entity relationships, and data models designed around connected systems.
- Time-Series Databases and Event-Centered Data Systems (planned) — Will introduce timestamped records, sensor streams, observability metrics, retention windows, event storage, and high-frequency analytical systems.
- Columnar Storage, File Formats, and Analytical Performance (planned) — Will explain columnar storage, Parquet, Arrow, compression, predicate pushdown, partitioning, vectorized execution, and performance-aware analytical design.
- Search Systems, Vector Databases, and Retrieval Architectures (planned) — Will examine search indexes, embeddings, similarity search, hybrid retrieval, metadata filtering, retrieval quality, and governance for AI-facing knowledge systems.
- Data Virtualization and Federated Query Architecture (planned) — Will study federated access, query pushdown, virtualization layers, cross-system joins, latency tradeoffs, and governance across distributed data sources.
Data Engineering, Transformation, and Platform Operations
- Data Pipelines and Data Processing Systems: Batch, Streaming, and Dataflow — Explains how data moves through ingestion, transformation, validation, orchestration, and delivery workflows from source systems to analytical outputs.
- ETL and Data Transformation Systems: Semantics, ELT, and Change Propagation — Explains extract-transform-load and extract-load-transform workflows, staging layers, transformation logic, replay, reproducibility, and governed analytical datasets.
- Data Cleaning and Data Quality Management: Quality, Governance, and Trust — Covers missing values, duplicates, invalid formats, outliers, inconsistent units, broken keys, profiling, repeatable routines, and quality governance.
- Streaming Data and Real-Time Analytics: Event Time, State, and Continuous Insight — Examines event streams, low-latency processing, message queues, windowing, stateful processing, monitoring, and operational analytics for continuously changing systems.
- Data Quality Metrics and Observability in Modern Data Systems — Shows how freshness, volume, schema, distribution, completeness, anomaly monitoring, and lineage-aware alerting help detect data-system failure before it reaches decision workflows.
- Reproducible Analytics and Versioned Data Workflows — Explains version control, environment management, scripted analysis, notebooks, data snapshots, run manifests, and repeatable analytical outputs.
- Data Contracts and Schema Evolution (planned) — Will examine producer-consumer agreements, schema stability, versioned interfaces, backward compatibility, breaking changes, ownership, and organizational accountability.
- Data Observability Platforms and Reliability Engineering (planned) — Will study freshness, volume, schema, distribution, lineage, anomaly detection, alerting, incident response, and reliability engineering for data pipelines.
- Reverse ETL and Operational Analytics (planned) — Will explain how governed analytical outputs move back into CRMs, product tools, marketing systems, public services, infrastructure operations, and decision workflows.
- Data Access Patterns and Query Optimization (planned) — Will cover indexing, partitioning, clustering, query plans, join strategies, caching, workload patterns, and performance-aware analytical design.
- Workflow Orchestration and DataOps (planned) — Will introduce scheduling, DAGs, retries, dependency management, deployment discipline, environment control, release practices, and production data operations.
- Data Testing, Validation, and Quality Gates (planned) — Will examine schema tests, expectation suites, referential checks, anomaly rules, contract tests, validation thresholds, and promotion gates across analytical pipelines.
Governance, Metadata, Semantics, and Stewardship
- Data Governance and Stewardship: Accountability, Quality, and Responsible Data Use — Introduces ownership, access rules, stewardship, accountability, definitions, privacy, data quality, governance workflows, and institutional responsibility for data assets.
- Metadata, Data Catalogs, and Lineage in Modern Data Systems — Explains how catalogs, lineage, definitions, ownership records, transformation histories, and metadata systems make data discoverable, reusable, and auditable.
- Analytics Engineering and Semantic Layers — Explains the bridge between data engineering and analysis, including governed metrics, semantic models, reusable transformations, and trusted reporting layers.
- Data Products and Self-Service Analytics — Examines how governed datasets, metrics, documentation, interfaces, ownership, and product thinking can support decentralized analysis without fragmenting trust or quality.
- Data Security, Privacy, and Access Control in Modern Data Systems — Covers role-based access, least privilege, sensitive data handling, privacy controls, auditing, segmentation, and secure data use across analytical systems.
- Metadata as Analytical Infrastructure (planned) — Will explain metadata as the connective tissue of catalogs, lineage, quality, stewardship, governance, reuse, access control, and institutional trust.
- Semantic Layers and Governed Metric Systems (planned) — Will focus on governed business logic, reusable metrics, dimensional modeling, semantic consistency, cross-tool analytical alignment, and metric certification.
- Ontologies, Taxonomies, and Controlled Vocabularies (planned) — Will study classification systems, concept definitions, entity types, controlled vocabularies, glossary governance, and the politics of analytical language.
- Data Ethics and the Responsibilities of Analytical Systems (planned) — Will examine consent, privacy, harm, fairness, legitimacy, accountability, institutional power, and the ethical obligations of data systems.
- Privacy Engineering and Responsible Data Access (planned) — Will cover data minimization, contextual integrity, privacy-preserving workflows, audit logs, sensitive data handling, access review, and responsible data use.
- Data Retention, Deletion, and the Ethics of Memory (planned) — Will study retention policies, deletion rights, archival responsibility, institutional memory, surveillance risk, and the consequences of indefinite data accumulation.
- Auditability, Reproducibility, and Analytical Accountability (planned) — Will examine audit trails, version control, reproducible environments, code review, peer review, governance evidence, and transparent analytical claims.
Statistical Analytics, Inference, Forecasting, and Causal Reasoning
- Descriptive Analytics and Data Exploration: Distributions, Patterns, and Analytical Insight — Introduces summary statistics, distributions, missingness checks, grouping, segmentation, exploratory visualization, and the first stage of analytical understanding.
- Statistical Modeling and Inference: Estimation, Uncertainty, and Evidence — Explains how statistical models estimate relationships, quantify uncertainty, test assumptions, and support evidence-based reasoning from data.
- Time Series Analysis and Forecasting: Trend, Seasonality, and Forecast Risk — Covers temporal structure, trend, seasonality, autocorrelation, forecasting, structural change, uncertainty, and the risks of modeling data that changes over time.
- Experimental Design and Causal Inference: Randomization, Identification, and Causal Claims — Explains experiments, counterfactual reasoning, confounding, treatment effects, quasi-experiments, identification, and the difference between correlation and causal evidence.
- Bayesian Analytics and Probabilistic Reasoning (planned) — Will introduce prior knowledge, likelihood, posterior inference, hierarchical models, uncertainty, shrinkage, probabilistic prediction, and decision support.
- Regression Diagnostics, Model Assumptions, and Analytical Validity (planned) — Will examine residuals, heteroskedasticity, multicollinearity, leverage, specification error, measurement error, and responsible interpretation of regression models.
- Panel Data, Longitudinal Analysis, and Repeated Measurement (planned) — Will cover repeated observations, fixed effects, random effects, time variation, institutional panels, geographic panels, administrative data, and policy datasets.
- Uncertainty Quantification and Analytical Communication (planned) — Will study confidence intervals, prediction intervals, sensitivity analysis, error propagation, uncertainty visualization, robustness checks, and honest communication of analytical limits.
- Sampling, Survey Data, and Measurement Error (planned) — Will examine sampling frames, response bias, survey weights, nonresponse, measurement error, administrative data gaps, and representativeness.
- Causal Diagrams, Identification, and Structural Assumptions (planned) — Will introduce directed acyclic graphs, backdoor paths, colliders, mediators, instruments, identification, and transparent causal assumptions.
Machine Learning, Predictive Systems, and MLOps
- Predictive Analytics and Machine Learning Models: Generalization, Evaluation, and Model Risk — Introduces supervised and unsupervised learning, prediction problems, model pipelines, feature data, model risk, and the relationship between analytics and machine learning.
- Model Training and Validation: Generalization, Cross-Validation, and Model Credibility — Explains training data, validation sets, cross-validation, leakage, generalization, overfitting, and the discipline required to evaluate predictive models responsibly.
- Feature Engineering and Data Representation: Encoding, Embeddings, and Learnable Signal — Covers how raw data becomes model-ready features through encoding, aggregation, scaling, embeddings, temporal windows, and domain-informed representation.
- Model Evaluation and Performance Metrics: Calibration, Thresholds, and Model Quality — Explains accuracy, precision, recall, calibration, ROC/AUC, error analysis, subgroup performance, thresholds, and selecting metrics that match real decisions.
- MLOps and Analytical Deployment Systems (planned) — Will examine model deployment, experiment tracking, data validation, artifact versioning, feature stores, drift monitoring, and production governance for analytical models.
- Model Monitoring, Drift, and Performance Degradation (planned) — Will focus on feature drift, label drift, concept drift, calibration decay, alerting, retraining triggers, monitoring thresholds, and long-term model maintenance.
- Explainable Analytics and Interpretable Models (planned) — Will cover interpretability, feature importance, partial dependence, SHAP-style explanation, counterfactual explanation, transparency, and responsible model communication.
- Fairness, Bias, and Data Representation in Predictive Systems (planned) — Will study measurement bias, sampling bias, label bias, disparate impact, subgroup performance, representation gaps, and accountable predictive analytics.
- Synthetic Data and Privacy-Preserving Analytics (planned) — Will introduce synthetic data, differential privacy, anonymization limits, re-identification risk, privacy budgets, and safe analytical reuse.
- Feature Stores and Model-Ready Data Infrastructure (planned) — Will examine feature definitions, online/offline consistency, point-in-time correctness, feature lineage, training-serving skew, and reusable model inputs.
- Human-in-the-Loop Analytics and Model Review (planned) — Will examine expert review, escalation, override processes, contestability, uncertainty thresholds, and accountable use of predictive systems.
Data Visualization, Reporting, and Decision Support
- Data Visualization and Analytical Communication: Clarity, Uncertainty, and Visual Reasoning — Explains how charts, maps, tables, layouts, annotations, and visual encodings communicate analytical evidence without hiding uncertainty or overstating certainty.
- Interactive Dashboards and Data Storytelling: Monitoring, Exploration, and Narrative Clarity — Examines dashboards, filters, user interaction, narrative framing, exploratory interfaces, monitoring tools, and the difference between exploration and persuasion.
- Information Design and Analytical Reporting: Structure, Evidence, and Report Integrity — Covers reporting structure, hierarchy, annotation, visual clarity, audience context, evidence integrity, and the transformation of analysis into usable institutional knowledge.
- Business Intelligence Systems and Decision Support — Explains BI systems, reporting layers, KPI structures, decision workflows, dashboards, organizational learning, and the governance needed for reliable institutional measurement.
- Dashboard Governance and Metric Stewardship (planned) — Will examine metric definitions, dashboard ownership, semantic consistency, certification workflows, refresh reliability, access control, and avoidance of competing versions of truth.
- Analytical Storytelling, Evidence, and Decision Narratives (planned) — Will study how analysis becomes persuasive without becoming manipulative, oversimplified, visually misleading, or falsely certain.
- Geospatial Analytics and Mapping Systems (planned) — Will introduce spatial data, geographic joins, map projections, raster and vector analysis, spatial uncertainty, and environmental or policy mapping.
- Decision Analytics, Scenarios, and Policy Evaluation (planned) — Will connect analysis to choices through scenarios, decision criteria, tradeoffs, evaluation frameworks, uncertainty, and policy learning.
- Alerting, Thresholds, and Operational Decision Rules (planned) — Will examine alerts, control limits, decision thresholds, escalation pathways, false positives, false negatives, and human review in operational analytics.
- Analytical Reporting for Public Accountability (planned) — Will study public-facing metrics, institutional reporting, transparency, uncertainty communication, equity implications, and the risk of performative measurement.
Applied Data Systems Across Sustainable Systems
- Environmental Monitoring Data Systems (planned) — Will examine sensor networks, ecological indicators, climate data, water monitoring, biodiversity observations, remote sensing, metadata, and quality assurance in environmental systems.
- Economic Data Systems and Public Indicators (planned) — Will study national accounts, inflation data, labor statistics, inequality metrics, well-being indicators, public economic measurement, and the politics of official statistics.
- Health Data Systems, Epidemiology, and Public Decision Support (planned) — Will cover health records, surveillance data, privacy, epidemiological modeling, public-health analytics, and uncertainty under institutional pressure.
- Infrastructure Analytics and Operational Monitoring (planned) — Will examine data systems for energy, water, transport, digital infrastructure, maintenance, reliability, resilience, and operational monitoring.
- Scientific Data Systems and Reproducible Research (planned) — Will study research data management, computational notebooks, versioned datasets, reproducible pipelines, provenance, and scientific integrity.
- Education Data Systems and Learning Analytics (planned) — Will examine student data, learning platforms, assessment systems, privacy, accountability, equity, and the risks of reducing learning to metrics.
- Climate Risk Data Systems and Scenario Analytics (planned) — Will connect climate datasets, hazard models, vulnerability indicators, infrastructure exposure, uncertainty, and adaptation decision support.
- Public Administration Data Systems and Institutional Capacity (planned) — Will study administrative data, eligibility systems, service delivery, audits, public accountability, and the governance of data-driven institutions.
GitHub Code Repository
The Data Systems & Analytics knowledge series is supported by a companion code repository designed for practical, reusable, multi-language analytical infrastructure. The repository is intentionally code-rich: SQL provides the structural backbone; Python and R support primary analytical workflows; Julia supports numerical and time-series work; Rust and Go support validation and operational patterns; TypeScript supports interactive dashboard scaffolding; and YAML/Markdown support contracts, lineage, metadata, and reproducibility documentation.
| Language or layer | Workflow role | Purpose |
|---|---|---|
| SQL | Semantic Metric Foundation | Defines schemas, constraints, views, quality checks, analytical queries, and governed metric definitions. |
| Python | Data Quality Lifecycle Audit | Loads data, validates fields, calculates quality scores, writes SQLite outputs, and exports reproducible quality reports. |
| R | Metric Reliability and Trend Report | Produces descriptive summaries, trend models, plots, uncertainty-aware reports, and report-ready outputs. |
| Julia | Time-Series Signal Analysis | Demonstrates numerical analysis for temporal indicators, sensor streams, high-frequency data, and analytical simulation. |
| Rust | CSV Schema Validator | Provides fast command-line validation for structured files before they enter analytical pipelines. |
| Go | Streaming Event Simulator | Simulates event-driven data streams for monitoring, operational analytics, and real-time data-system examples. |
| TypeScript | Analytics Dashboard Scaffold | Provides lightweight browser-based interfaces for displaying exported metrics, quality summaries, and decision-support views. |
| YAML / Markdown | Contracts, Lineage, and Governance Metadata | Documents schema expectations, owners, refresh cadence, lineage, quality thresholds, and analytical assumptions. |
The purpose is not to overload the series with arbitrary languages, but to model a realistic modern data stack: SQL for durable structure, Python and R for analytical work, Julia for numerical modeling, Rust for safe validation tooling, Go for streaming systems, TypeScript for interactive front-end analytics, and documentation for governance, lineage, and reproducibility.
Methodological Orientation
This article map uses a systems-based and reproducibility-centered approach to data systems. It treats data infrastructure, statistical reasoning, software engineering, governance, security, and communication as connected components of a single analytical lifecycle. It avoids presenting analytics as a magic pipeline from raw data to insight. Instead, it emphasizes definitions, assumptions, validation, lineage, uncertainty, stewardship, access control, reproducibility, and institutional context.
The methodological stance is practical but critical. SQL queries, Python scripts, R workflows, dashboards, machine-learning models, and data products are treated as tools for structured inquiry, not substitutes for judgment. Good analytics requires clear questions, trustworthy data, appropriate methods, domain expertise, transparent assumptions, reproducible workflows, and careful communication. It also requires attention to what cannot be measured easily, what the data excludes, whose experience is missing, and how analytical outputs may affect people and institutions.
This series therefore supports both technical learning and institutional reasoning. It is intended to help readers understand how data systems are built, how analytics can be made reproducible, how governance supports trust, and how data-driven decisions can be evaluated responsibly.
How This Series Connects Across the Site
Data Systems & Analytics connects directly to Artificial Intelligence Systems, because AI systems depend on data pipelines, data quality, training datasets, evaluation metrics, monitoring, lineage, privacy controls, and governance. It connects to Environmental Monitoring Systems, because environmental knowledge depends on sensors, time-series data, remote sensing, quality assurance, metadata, and observation networks. It connects to Economic Systems, because public statistics, financial analysis, labor data, inflation measures, inequality metrics, and well-being indicators are all data systems.
It also connects to Risk & Resilience, where monitoring, early warning, anomaly detection, scenario analysis, and indicator systems help institutions detect stress before failure occurs; to Institutions & Governance, where data governance, transparency, auditability, and public legitimacy matter; and to Decision Science, where analysis must be translated into choices under uncertainty.
Across the wider site, this article map provides the infrastructure layer beneath evidence. Sustainable systems require measurement, but measurement requires systems. Data Systems & Analytics explains how those systems are built, governed, tested, interpreted, and held accountable.
Related reading
- Artificial Intelligence Systems
- Decision Science
- Environmental Monitoring Systems
- Economic Systems
- Risk & Resilience
- Institutions & Governance
- Systems Thinking
- Statistics for Systems Modeling
- Calculus for Systems Modeling
Further reading
- Batini, C. and Scannapieco, M. (2016) Data and Information Quality: Dimensions, Principles and Techniques. Cham: Springer.
- Doan, A., Halevy, A. and Ives, Z. (2012) Principles of Data Integration. Waltham, MA: Morgan Kaufmann.
- Kimball, R. and Ross, M. (2013) The Data Warehouse Toolkit: The Definitive Guide to Dimensional Modeling. 3rd edn. Indianapolis: Wiley.
- Kleppmann, M. (2017) Designing Data-Intensive Applications. Sebastopol, CA: O’Reilly Media.
- Reis, J. and Housley, M. (2022) Fundamentals of Data Engineering. Sebastopol, CA: O’Reilly Media.
- Tukey, J.W. (1977) Exploratory Data Analysis. Reading, MA: Addison-Wesley.
- Wickham, H., Çetinkaya-Rundel, M. and Grolemund, G. (2023) R for Data Science. 2nd edn. Available at: https://r4ds.hadley.nz/
- Zeng, M.L. and Qin, J. (2016) Metadata. 2nd edn. Chicago: ALA Neal-Schuman.
References
- Apache Arrow (n.d.) Apache Arrow. Available at: https://arrow.apache.org/
- Apache Parquet (n.d.) Apache Parquet. Available at: https://parquet.apache.org/
- dbt Labs (n.d.) What is analytics engineering? Available at: https://www.getdbt.com/what-is-analytics-engineering
- DuckDB Foundation (n.d.) DuckDB Documentation. Available at: https://duckdb.org/docs/
- Great Expectations (n.d.) Great Expectations Documentation. Available at: https://docs.greatexpectations.io/docs/
- International Organization for Standardization (2023) ISO/IEC 9075-1:2023 Database languages SQL — Part 1: Framework (SQL/Framework). Available at: https://www.iso.org/standard/76583.html
- NIST (2024) Research Data Framework (RDaF) Version 2.0. Available at: https://nvlpubs.nist.gov/nistpubs/SpecialPublications/1500-18/NIST.SP.1500-18r2.html
- OpenLineage (n.d.) OpenLineage Documentation. Available at: https://openlineage.io/docs/
- PostgreSQL Global Development Group (n.d.) PostgreSQL Documentation. Available at: https://www.postgresql.org/docs/
- Python Software Foundation (n.d.) Python Documentation. Available at: https://docs.python.org/3/
- R Core Team (n.d.) The R Manuals. Available at: https://cran.r-project.org/manuals.html
- Wickham, H., Çetinkaya-Rundel, M. and Grolemund, G. (2023) R for Data Science. Available at: https://r4ds.hadley.nz/