
Last Updated May 14, 2026
Environmental monitoring systems are the observational infrastructures through which societies measure environmental conditions, detect ecological change, and translate complex environmental signals into usable knowledge for science, governance, resilience planning, and sustainability strategy. They bring together field sensors, embedded devices, remote sensing platforms, communication networks, edge computing, data pipelines, analytical models, dashboards, standards, governance workflows, and decision-support systems in order to monitor air, water, soil, biodiversity, climate, land systems, infrastructure exposure, and environmental risk across natural and built environments.
Environmental monitoring is not simply a matter of measurement. It is a systems problem: how to design reliable architectures of observation capable of turning dynamic environmental processes into evidence that can be validated, interpreted, governed, and acted upon. A river sensor, satellite image, air-quality station, soil probe, acoustic recorder, hydrological gauge, or biodiversity camera trap has limited value unless it is embedded within a larger system of calibration, metadata, telemetry, quality assurance, data integration, modeling, uncertainty communication, and institutional use.
Main Library
Publications
Article Map
Environmental Monitoring
Related Topic
Embedded & Edge Systems
Related Topic
Data Systems & Analytics
Related Topic
Intelligent Infrastructure Systems
Environmental change is often spatially distributed, temporally uneven, and difficult to observe directly. Air pollution can fluctuate by hour, season, street, altitude, and weather condition. Water contamination may emerge from diffuse sources and move across watersheds before it becomes visible downstream. Biodiversity loss often becomes legible only after long periods of cumulative degradation. Soil moisture, vegetation stress, water availability, wildfire risk, heat exposure, and ecosystem change unfold across interacting atmospheric, hydrological, ecological, and infrastructural systems. For this reason, environmental governance increasingly depends on monitoring systems able to operate across scales, integrate heterogeneous data sources, and sustain long-term observation under uncertain and changing conditions.
Modern environmental monitoring sits at the intersection of environmental science, embedded sensing, remote sensing, data systems, geospatial analysis, edge computing, cyber-physical infrastructure, statistics, machine learning, and institutional decision-making. Sensors produce measurements at the point of observation. Embedded firmware reads, filters, calibrates, and transmits signals. Edge systems preprocess data, detect anomalies, and reduce latency. Communication networks move records from field devices to gateways and platforms. Data systems structure observations into usable records. Analytical systems identify patterns, thresholds, anomalies, uncertainty, and trends. Institutions then interpret those outputs for environmental assessment, compliance, forecasting, adaptation, restoration, emergency response, infrastructure planning, and long-term sustainability strategy.
Complete Code Repository
The companion repository for this knowledge series contains SQL schemas, synthetic environmental telemetry datasets, Python and R analytics workflows, Embedded C firmware examples, TinyML environmental anomaly-detection scaffolds, PYNQ edge-acceleration workflows, HDL/Verilog signal-processing modules, geospatial data-processing examples, environmental data-quality checks, calibration manifests, device metadata, dashboards, notebooks, and reproducible code patterns for building reliable environmental monitoring infrastructure.
What Are Environmental Monitoring Systems?
Environmental monitoring systems are integrated observational infrastructures used to detect, record, validate, interpret, and communicate environmental conditions over time. They include the physical hardware used to gather measurements, the embedded systems that control sensing and telemetry, the communication systems that move data across space, the databases and platforms that preserve observational records, and the analytical methods used to convert raw signals into environmental intelligence.
Such systems often combine:
- field sensors and embedded monitoring devices
- data loggers, microcontrollers, sensor boards, and gateway hardware
- satellite, airborne, drone, and ground-based remote sensing platforms
- edge computing, TinyML inference, FPGA/PYNQ acceleration, and local signal processing
- wireless, wired, low-power, and satellite communication networks
- environmental databases, geospatial data stores, data lakes, and analytical platforms
- calibration systems, metadata catalogs, quality assurance routines, and provenance records
- statistical models, machine-learning systems, hydrological models, geospatial analysis, and scenario tools
- visualization layers, dashboards, maps, alerts, reporting systems, and decision-support interfaces
Environmental monitoring should therefore be understood as a full observational architecture rather than a collection of isolated instruments. The central question is not only whether a variable can be measured, but whether a system can measure it reliably, continuously, comparably, transparently, and in a form that supports explanation and action. Monitoring systems may be highly local, such as a river water-quality node or urban air-quality network, or planetary in scale, as in satellite-based Earth system observation. Across both cases, the governing problem is the same: how to build durable systems of environmental observation under conditions of complexity, uncertainty, and change.
Why Monitoring Matters in Complex Environmental Systems
Environmental systems are dynamic, nonlinear, spatially distributed, and deeply interconnected. Conditions in one domain often propagate into another: atmospheric processes shape hydrology, hydrology influences ecosystems, land-use change alters biodiversity and water cycles, and climate variability amplifies exposure across infrastructure and human settlements. Because these interactions unfold over time and across scales, effective environmental action depends on the capacity to detect change early, interpret it accurately, and situate it within broader system dynamics.
Monitoring matters because environmental degradation is rarely legible without instrumentation. Many critical environmental threats are cumulative, probabilistic, seasonal, or spatially uneven. Pollutant exposure can vary street by street. Watershed conditions can shift upstream long before downstream effects become visible. Soil degradation can accumulate before yields decline. Ecological decline may proceed incrementally until thresholds are crossed. Monitoring systems provide the observational continuity needed to identify these patterns before they become irreversible or institutionally invisible.
For this reason, environmental monitoring is central to climate adaptation, environmental compliance, ecological research, disaster preparedness, infrastructure planning, restoration ecology, environmental justice analysis, sustainability reporting, and long-term governance. It creates the empirical basis on which environmental claims can be tested, environmental risks can be assessed, and institutional responses can be coordinated.
The Environmental Observation Lifecycle
The lifecycle of environmental monitoring describes how a physical condition becomes a validated environmental record, how that record becomes analysis, and how analysis becomes institutional knowledge.
- Environmental phenomenon — a physical, chemical, biological, hydrological, atmospheric, or ecological process produces observable conditions.
- Sensing and sampling — field sensors, satellites, cameras, acoustic recorders, probes, gauges, or laboratory measurements capture environmental signals.
- Signal conditioning — analog signals are filtered, stabilized, calibrated, digitized, and time-stamped.
- Embedded control — firmware manages sensor reads, interrupts, sampling frequency, sleep cycles, local storage, power states, and communications.
- Edge processing — local systems filter noise, compress data, detect anomalies, classify events, or trigger local alerts before transmission.
- Telemetry and transmission — observations move through LoRaWAN, cellular, Wi-Fi, satellite, Ethernet, radio, MQTT, or other communication channels.
- Data ingestion — records enter databases, time-series stores, geospatial systems, cloud platforms, or institutional data lakes.
- Quality assurance — systems check completeness, plausibility, calibration status, sensor drift, missingness, outliers, spatial consistency, and temporal continuity.
- Analysis and modeling — statistical models, geospatial workflows, machine learning, hydrological models, ecological indicators, and threshold systems interpret patterns.
- Visualization and reporting — maps, dashboards, reports, alerts, uncertainty bands, and decision-support tools communicate findings.
- Institutional action — agencies, researchers, communities, infrastructure operators, and policymakers use monitoring evidence for intervention, compliance, restoration, planning, or adaptation.
This lifecycle makes clear why environmental monitoring is not reducible to sensors. Sensors initiate observation, but environmental knowledge depends on the entire chain from signal to decision.
Environmental Measurement and Observational Logic
Environmental monitoring begins with measurement, but measurement alone is not enough. What matters is the design of an observational logic: which variables are measured, at what resolution, how often, under what conditions, with what calibration standards, with what uncertainty, and for what analytical purpose.
Common forms of environmental measurement include:
- temperature, humidity, pressure, wind speed, solar radiation, and other atmospheric variables
- air quality indicators such as particulate matter, ozone, nitrogen dioxide, sulfur dioxide, carbon monoxide, and volatile compounds
- water quality variables such as pH, turbidity, dissolved oxygen, conductivity, temperature, nutrient load, salinity, and contaminants
- soil moisture, soil temperature, nutrient conditions, organic matter, compaction, and salinity
- hydrological variables such as rainfall intensity, discharge, water level, groundwater depth, snowpack, and flood stage
- biodiversity indicators including species presence, abundance, acoustic signatures, camera-trap detections, eDNA signals, habitat condition, and phenological timing
- land-surface and vegetation indicators derived from remote sensing, including NDVI, land cover, impervious surface, canopy loss, burn severity, and surface temperature
- infrastructure-environment indicators such as heat exposure, stormwater load, energy demand, flood risk, and asset vulnerability
Measurement systems must account for calibration drift, sensor error, environmental noise, missingness, temporal variability, spatial heterogeneity, maintenance constraints, and interpretive context. A measurement that is technically precise but poorly located, irregularly sampled, or analytically isolated may have limited value. The goal is not merely to collect data, but to construct robust observational chains that preserve validity from measurement through interpretation.
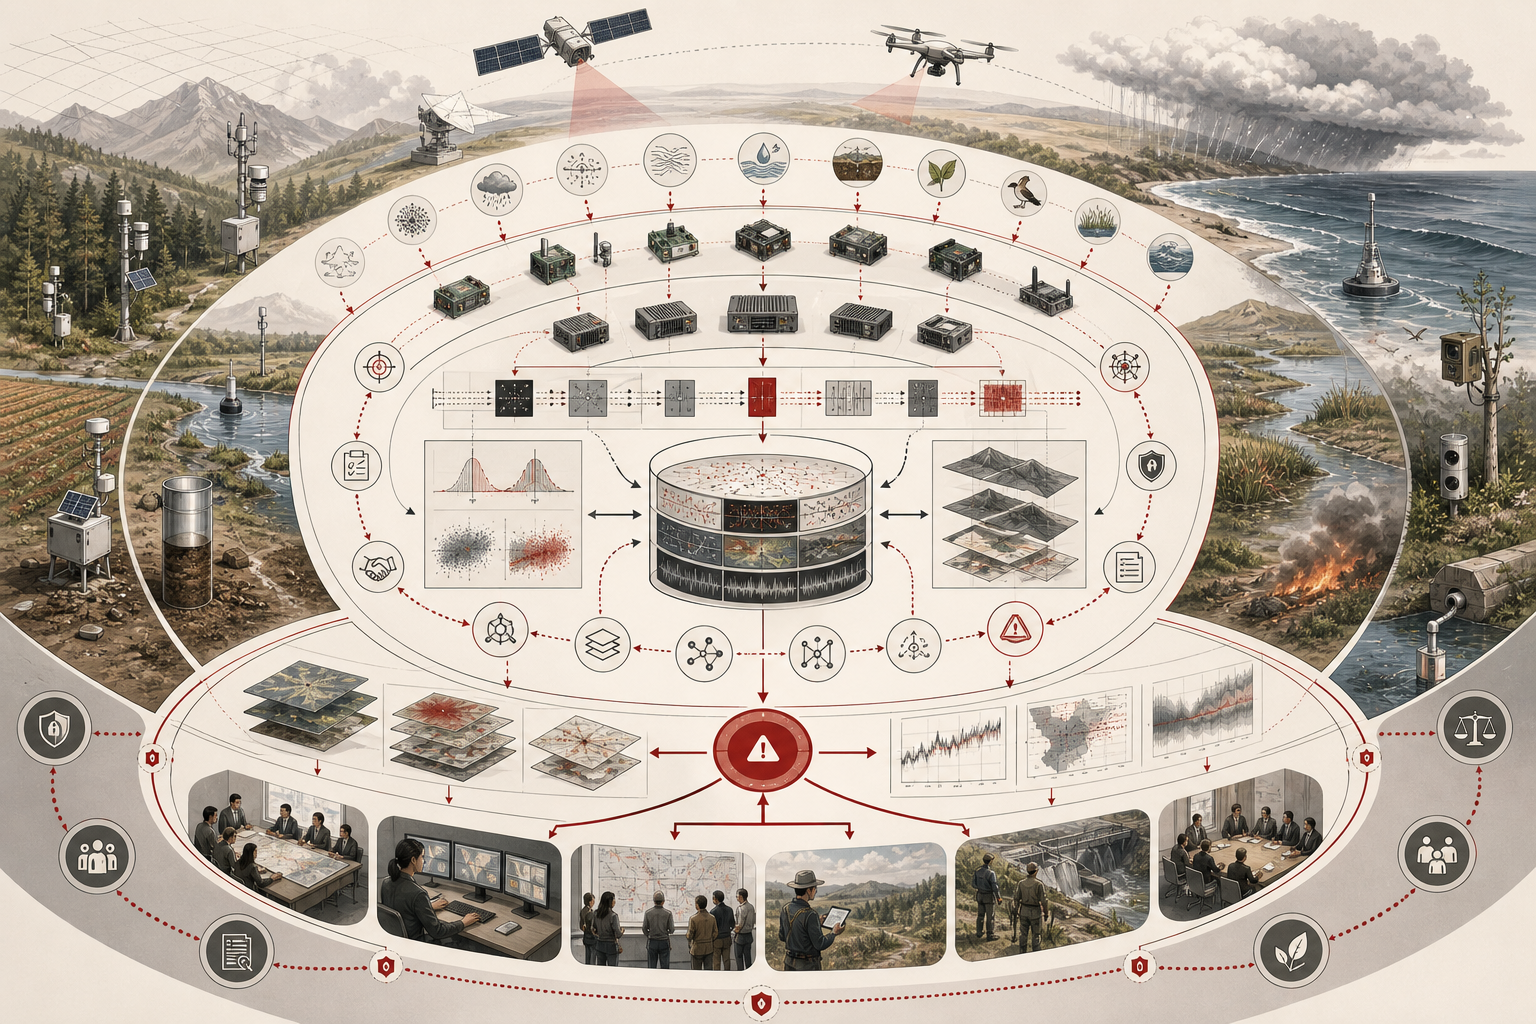
System Architecture: From Sensor to Decision
Environmental monitoring systems typically operate as layered architectures that connect observation to decision-making. These layers vary by application, but most systems move through a sequence of functions linking physical sensing with analytical and institutional response.
- Observation layer — environmental conditions are sensed through field devices, laboratory samples, remote sensing platforms, citizen-science networks, or hybrid monitoring infrastructures.
- Embedded layer — microcontrollers, firmware, ADCs, sensor interfaces, interrupt routines, and power-management logic convert environmental signals into digital observations.
- Edge layer — local gateways, TinyML inference, PYNQ/FPGA accelerators, and edge analytics filter, classify, compress, validate, or summarize environmental data near the point of collection.
- Communication layer — data moves through wired, wireless, low-power, cellular, satellite, or mesh networks depending on geography, cost, latency, and energy requirements.
- Data layer — databases, time-series stores, geospatial systems, lakehouses, metadata catalogs, and quality-control pipelines preserve observations as analytical records.
- Modeling layer — statistical, geospatial, hydrological, ecological, machine-learning, and scenario models interpret environmental signals.
- Visualization layer — dashboards, maps, reports, uncertainty graphics, alerts, and monitoring interfaces communicate environmental status and change.
- Governance layer — institutions define ownership, standards, calibration, access, privacy, quality thresholds, validation rules, stewardship responsibilities, and decision workflows.
- Action layer — environmental intelligence informs intervention, compliance, restoration, adaptation, early warning, investment, maintenance, and policy.
This architecture highlights a crucial point: environmental monitoring depends equally on hardware, software, data systems, modeling, governance, and institutional workflows. A field instrument has limited value unless it is embedded within a larger system capable of maintaining data integrity, contextualizing outputs, and supporting real decisions.
Mathematical Lens
Environmental monitoring systems require mathematics because environmental observation depends on sampling, calibration, uncertainty, spatial coverage, trend detection, anomaly thresholds, and sensor reliability. Mathematical examples make monitoring assumptions visible and testable.
x_{\text{calibrated}} = a x_{\text{raw}} + b
\]
Q = w_c C + w_p P + w_f F + w_s S
\]
A_t = \frac{x_t – \mu_{t-k:t-1}}{\sigma_{t-k:t-1}}
\]
R = H \times E \times V
\]
NDVI = \frac{NIR – Red}{NIR + Red}
\]
| Symbol | Meaning | Environmental monitoring interpretation |
|---|---|---|
| \(x_{\text{raw}}\) | Raw sensor value | The uncalibrated reading produced by a device or sensor. |
| \(x_{\text{calibrated}}\) | Calibrated value | The corrected value used for environmental interpretation. |
| \(C\) | Completeness | The share of expected observations successfully collected. |
| \(F\) | Freshness | Whether monitoring data arrives within the expected time window. |
| \(A_t\) | Anomaly score | A standardized measure of whether a current observation deviates from recent conditions. |
| \(R\) | Risk index | A simplified expression linking environmental hazard, exposure, and vulnerability. |
The mathematical lesson is practical. Monitoring systems do not merely “show the environment.” They construct evidence through sampling, calibration, aggregation, modeling, and interpretation. Mathematics helps make those steps transparent.
Embedded, Edge, TinyML, PYNQ, and HDL Workflows
Environmental monitoring increasingly depends on hardware-aware computing. Field devices must sense environmental signals, process them under power and memory constraints, transmit data under intermittent connectivity, and sometimes make local decisions before human or cloud systems intervene.
Several technical layers are especially important:
- Embedded C supports low-level firmware for sensor reading, interrupt handling, rolling averages, anomaly thresholds, communication, and power management.
- TinyML supports compact on-device inference for anomaly detection, sound classification, wildlife detection, vibration patterns, or event recognition in constrained environmental devices.
- PYNQ supports Python-controlled FPGA acceleration for edge signal processing, environmental time-series windows, image preprocessing, and high-throughput sensor workflows.
- HDL/Verilog supports hardware-level modules for streaming filters, threshold detectors, counters, finite-state machines, and low-latency signal pathways.
- SQL provides durable structure for devices, sensors, telemetry, calibration records, quality checks, and environmental indicators.
- Python supports ingestion, validation, geospatial processing, feature engineering, modeling, simulation, and reproducible analysis.
- R supports statistical trend analysis, environmental reporting, uncertainty communication, and publication-ready visualization.
- Julia can support hydrological modeling, numerical simulation, optimization, and performance-sensitive environmental computation.
- Rust can support safe telemetry validation tools, command-line utilities, and robust data-processing components.
- Go can support streaming telemetry services, gateway simulators, and lightweight monitoring APIs.
- TypeScript can support dashboard prototypes, browser-based visualization, and decision-support interfaces.
These languages are not included for decoration. Each corresponds to a layer in the environmental monitoring stack: device, edge, telemetry, database, analysis, model, dashboard, and governance.
Core Domains of Environmental Monitoring
Environmental monitoring systems encompass several major domains of observation. Each domain focuses on a different class of environmental process, but in practice these areas are interdependent and increasingly integrated.
- Atmospheric monitoring — air pollution, weather conditions, emissions, meteorology, greenhouse gases, heat exposure, and climate-relevant variables.
- Hydrological and water monitoring — water quality, watershed conditions, river systems, groundwater, stormwater, flood detection, drought, and water infrastructure.
- Soil and agricultural monitoring — soil moisture, soil temperature, nutrients, irrigation status, crop conditions, salinity, erosion, and land management indicators.
- Ecological and biodiversity monitoring — species observation, habitat condition, ecosystem change, acoustic monitoring, image-based detection, eDNA, and conservation signals.
- Climate and Earth system observation — long-term monitoring of temperature, cryosphere, oceans, vegetation, land cover, aerosols, and global environmental dynamics.
- Disaster detection and early warning — systems that monitor wildfire, floods, storms, drought, extreme heat, landslides, coastal hazards, and compound risk.
- Remote sensing and geospatial monitoring — satellite, airborne, drone, and ground-based observation used to detect environmental change across large spatial scales.
- Environmental analytics and decision support — platforms, dashboards, models, risk tools, alerts, and interpretive systems that transform observation into action.
- Environmental data governance — standards, metadata, interoperability, uncertainty, privacy, access, stewardship, and accountability for environmental evidence.
Together, these domains form the broader architecture of environmental intelligence. Sensors and satellites generate signals. Networks move information across space and time. Data systems preserve and structure observational records. Analytical systems identify patterns, thresholds, anomalies, and trends. Governance systems then interpret those findings to support stewardship, regulation, resilience, and public accountability.
Environmental Monitoring Systems Pillar Map
The roadmap below organizes the Environmental Monitoring Systems knowledge series into conceptual domains. Existing articles are linked directly using the current article URLs from the attached CSV. Future articles are marked as planned so the pillar can function as both a public index and a long-range technical architecture for the series.
Atmospheric, Weather, and Climate Monitoring
- Air Quality Monitoring Systems: Sensors, Networks, and Atmospheric Governance — Explains how air-quality evidence is produced from pollutant sensors, regulatory stations, calibration workflows, exposure interpretation, public-health communication, and atmospheric governance.
- Climate Monitoring Systems and Environmental Observation — Introduces long-duration climate records, Earth-system indicators, baselines, anomalies, reanalysis linkages, uncertainty, and the stewardship required to make planetary change historically visible.
- Weather Sensing and Atmospheric Data Systems — Covers surface stations, radar, satellites, upper-air observations, telemetry, data assimilation, latency, and the observational systems behind operational atmospheric intelligence.
- Climate Early Warning Systems: Forecasts, Risk, and Protective Lead Time — Examines monitoring architectures that translate climate-sensitive hazards, forecasts, thresholds, vulnerability, and warning chains into preparedness and protective action.
- Urban Heat Monitoring and Microclimate Sensor Networks (Planned) — Will study distributed temperature sensing, urban heat islands, exposure mapping, vulnerable populations, shade, land cover, and adaptation decisions.
- Greenhouse Gas Monitoring and Emissions Observation (Planned) — Will examine methane, carbon dioxide, nitrous oxide, emissions inventories, atmospheric sensing, satellite observation, and source attribution challenges.
- Wildfire Smoke, Aerosols, and Public Health Monitoring (Planned) — Will cover smoke plumes, particulate exposure, low-cost sensors, satellite data, health-risk communication, and air-quality warning systems.
Water, Watersheds, and Hydrological Monitoring
- Water Quality Monitoring Systems: Sensors, Sampling, and Aquatic Governance — Explains how aquatic conditions are measured through sensors, sampling regimes, calibration, contamination indicators, ecological context, and water-governance workflows.
- River and Watershed Monitoring Networks: Basin-Scale Monitoring and Hydrological Accountability — Covers basin-scale monitoring, upstream-downstream relationships, stream gauges, watershed instrumentation, hydrological connectivity, water quality, and basin accountability.
- Flood Monitoring Systems and Hydrological Risk Detection — Examines rainfall, river stage, soil saturation, flood thresholds, telemetry, warning lead time, and hydrological risk analytics.
- Smart Water Systems and Environmental Sensing: Monitoring, Telemetry, and Adaptive Water Intelligence — Studies sensors, telemetry, adaptive control, water infrastructure, stormwater, wastewater, distribution systems, and watershed-aware water intelligence.
- Groundwater Monitoring and Aquifer Observation Systems (Planned) — Will examine wells, piezometers, groundwater depth, recharge, depletion, contamination, and long-term aquifer sustainability.
- Coastal Monitoring, Sea-Level Observation, and Flood Exposure (Planned) — Will cover tide gauges, storm surge, coastal sensors, erosion, inundation mapping, and climate adaptation planning.
- Low-Cost Water Sensor Networks and Calibration Governance (Planned) — Will study affordable water sensors, quality assurance, calibration drift, maintenance, and the reliability of distributed community monitoring.
Soil, Agriculture, and Land-System Monitoring
- Soil Monitoring Systems and Agricultural Sensing — Explains soil moisture, temperature, nutrients, salinity, irrigation, crop condition, field instrumentation, and agricultural environmental sensing.
- Land Use Monitoring and Environmental Change Detection: Landscape Change, Classification, and Environmental Accountability — Covers land-cover classification, remote sensing, change detection, urbanization, deforestation, landscape transformation, and environmental accountability.
- Precision Agriculture Sensor Systems (Planned) — Will study field sensors, irrigation scheduling, crop stress, edge analytics, wireless networks, and farm-scale environmental intelligence.
- Soil Carbon, Soil Health, and Monitoring Infrastructure (Planned) — Will examine soil organic carbon, sampling, proxies, uncertainty, remote sensing, regenerative agriculture claims, and measurement governance.
- Drought Monitoring and Agricultural Early Warning Systems (Planned) — Will connect rainfall, soil moisture, vegetation indices, evapotranspiration, crop stress, and risk communication.
- Land Degradation, Desertification, and Remote Monitoring (Planned) — Will study vegetation loss, erosion, soil exposure, productivity decline, and long-term observation of dryland systems.
Ecological, Biodiversity, and Conservation Monitoring
- Biodiversity Monitoring Systems: Ecological Observation, Indicators, and Conservation Accountability — Explains how species, populations, habitats, ecological signals, biodiversity indicators, and conservation evidence are monitored across landscapes and time.
- Ecosystem Monitoring and Ecological Observation: Condition, Function, and Ecological Accountability — Covers ecosystem structure, function, condition, resilience, disturbance, recovery, representativeness, and multi-scale ecological observation.
- Acoustic Monitoring and Ecoacoustic Sensor Networks (Planned) — Will examine soundscape monitoring, species detection, acoustic indices, edge inference, and biodiversity signals from audio data.
- Camera Traps, Computer Vision, and Wildlife Monitoring (Planned) — Will study image-based species detection, field cameras, edge filtering, annotation, bias, and ecological interpretation.
- eDNA Monitoring and Molecular Environmental Observation (Planned) — Will introduce environmental DNA sampling, species detection, aquatic monitoring, laboratory workflows, uncertainty, and data interpretation.
- Habitat Connectivity and Landscape Monitoring Systems (Planned) — Will examine corridors, fragmentation, remote sensing, movement ecology, spatial analysis, and conservation planning.
- Restoration Monitoring and Ecological Recovery Metrics (Planned) — Will study baselines, indicators, vegetation recovery, soil recovery, species return, adaptive management, and long-term stewardship.
Sensor Networks, Embedded Devices, and Edge Systems
- Environmental Sensor Networks: Distributed Sensing, Telemetry, and Environmental Accountability — Explains how distributed field sensors produce accountable environmental observations across space, time, heterogeneous conditions, and institutional use cases.
- Embedded Monitoring Devices for Field Observation: Edge Sensing, Reliability, and Field Data Integrity — Covers microcontrollers, sensor interfaces, power budgets, data logging, firmware, ruggedization, QA/QC, and field-ready observational integrity.
- Edge Computing in Environmental Monitoring: Local Processing, Resilience, and Real-Time Environmental Intelligence — Examines local processing, filtering, anomaly detection, bandwidth reduction, autonomy, resilience, and real-time interpretation in environmental field systems.
- IoT Architectures for Environmental Monitoring: Devices, Platforms, and Environmental Intelligence — Studies connected devices, telemetry protocols, gateways, cloud-edge coordination, device identity, platform architecture, interoperability, and environmental IoT deployment patterns.
- Embedded C for Environmental Sensor Firmware (Planned) — Will demonstrate firmware patterns for sensor polling, interrupts, rolling averages, calibration constants, local alerts, and low-power environmental monitoring.
- TinyML for Environmental Event Detection (Planned) — Will introduce on-device inference for sound, vibration, water-quality anomaly, air-quality event, and wildlife-detection applications.
- PYNQ and FPGA Acceleration for Environmental Edge Analytics (Planned) — Will study Python-controlled FPGA workflows for streaming sensor windows, image preprocessing, signal filtering, and low-latency field analytics.
- HDL for Environmental Signal Processing (Planned) — Will introduce Verilog/VHDL modules for threshold detection, streaming filters, counters, finite-state machines, and hardware-level monitoring pipelines.
- Power Budgets, Solar Nodes, and Long-Term Field Deployment (Planned) — Will examine duty cycles, batteries, solar charging, energy harvesting, enclosure design, maintenance schedules, and remote deployment reliability.
Remote Sensing, Geospatial Systems, and Earth Observation
- Remote Sensing Systems in Environmental Monitoring: Scale, Spectral Inference, and Environmental Change — Explains satellite, airborne, drone, and ground-based remote sensing for environmental monitoring, spectral inference, field validation, and change detection.
- Satellite Observation and Earth System Monitoring: Orbital Evidence, Coupled Systems, and Planetary Change — Covers Earth observation satellites, global environmental variables, land, ocean, cryosphere, atmosphere, climate indicators, and coupled Earth-system change.
- Drone-Based Environmental Monitoring (Planned) — Will study UAV imagery, field surveys, orthomosaics, vegetation health, thermal observation, habitat mapping, and regulatory constraints.
- Geospatial Data Pipelines for Environmental Monitoring (Planned) — Will examine raster/vector workflows, spatial joins, reprojection, tiling, zonal statistics, and reproducible GIS pipelines.
- Remote Sensing Indices for Vegetation, Water, Heat, and Disturbance (Planned) — Will explain NDVI, NDWI, land-surface temperature, burn indices, interpretation limits, and environmental applications.
- Change Detection and Environmental Baseline Monitoring (Planned) — Will cover before-after comparison, classification, anomaly maps, temporal baselines, and monitoring of land-system change.
Environmental Data Platforms, Analytics, and Decision Support
- Environmental Data Platforms and Decision Support Systems: Integration, Evidence, and Environmental Decision-Making — Explains how data infrastructure, integration, models, dashboards, provenance, standards, and governance workflows support environmental decisions.
- Environmental Analytics and Monitoring Dashboards: Indicators, Alerts, and Environmental Decision Quality — Covers dashboards, alerts, indicators, maps, time-series views, uncertainty displays, analytical communication, and decision quality.
- Environmental Telemetry Databases and Time-Series Storage (Planned) — Will examine schemas, sensor metadata, time-series indexing, quality flags, calibration records, and durable environmental telemetry storage.
- Environmental Data Quality, Validation, and Observability (Planned) — Will study completeness, plausibility, freshness, drift, sensor outages, anomaly flags, QA/QC workflows, and monitoring-system reliability.
- Machine Learning for Environmental Monitoring (Planned) — Will introduce classification, regression, anomaly detection, forecasting, remote sensing ML, model validation, and responsible environmental interpretation.
- Uncertainty Communication in Environmental Dashboards (Planned) — Will examine confidence intervals, threshold uncertainty, data gaps, model limits, sensor error, and public-facing risk communication.
Monitoring for Sustainability, Risk, and Governance
- Environmental Monitoring for Sustainability Strategy: Indicators, Feedback, and Environmental Accountability — Explains how monitoring evidence supports sustainability strategy through indicators, baselines, feedback loops, thresholds, adaptive review, and environmental accountability.
- Disaster Detection and Early Warning Networks: Hazard Sensing, Warning Chains, and Actionable Time — Examines monitoring systems for floods, wildfire, storms, drought, heat, landslides, warning chains, emergency response, and actionable lead time.
- Monitoring Environmental Risk and Resilience: Hazards, Recovery, Thresholds, and Adaptive Capacity — Covers risk indicators, exposure, vulnerability, resilience metrics, thresholds, recovery, early warning, and adaptive capacity.
- The Future of Environmental Monitoring Systems: AI, Earth Observation, Interoperability, and Environmental Intelligence — Explores distributed sensing, artificial intelligence, Earth observation, interoperability, edge computing, environmental intelligence, and governance futures.
- Environmental Monitoring for Climate Adaptation Planning (Planned) — Will connect monitoring data to adaptation pathways, infrastructure planning, vulnerability assessment, and institutional decision-making under climate uncertainty.
- Community-Based Environmental Monitoring and Public Accountability (Planned) — Will examine participatory monitoring, low-cost sensors, data legitimacy, environmental justice, and community-accessible evidence systems.
- Standards, Metadata, and Interoperability in Environmental Monitoring (Planned) — Will study data standards, metadata schemas, FAIR principles, sensor descriptions, quality flags, and cross-institutional data exchange.
- Environmental Monitoring Governance and the Ethics of Observation (Planned) — Will examine privacy, surveillance risk, Indigenous data sovereignty, community consent, public trust, and responsible environmental data use.
GitHub Code Repository
The Environmental Monitoring Systems knowledge series is supported by a companion code repository designed for practical, reproducible, multi-language environmental monitoring workflows. This repository should bridge environmental science, field sensing, embedded systems, edge analytics, geospatial data, statistical reporting, and governance documentation.
Recommended repository structure:
environmental-monitoring-systems-code/
├── README.md
├── LICENSE
├── data/
│   ├── raw/
│   ├── processed/
│   ├── synthetic/
│   └── geospatial/
├── sql/
│   ├── schema.sql
│   ├── seed_data.sql
│   ├── environmental_quality_checks.sql
│   └── monitoring_metric_views.sql
├── embedded_c/
│   ├── low_power_environmental_sensor_monitor.c
│   └── README.md
├── tinyml/
│   ├── environmental_tinyml_inference_stub.cpp
│   ├── model_metadata.json
│   └── README.md
├── pynq/
│   ├── pynq_environmental_edge_acceleration.py
│   └── README.md
├── hdl/
│   ├── streaming_threshold_detector.v
│   └── README.md
├── python/
│   ├── environmental_telemetry_quality_pipeline.py
│   ├── environmental_feature_engineering.py
│   ├── geospatial_monitoring_workflow.py
│   └── environmental_gateway_event_simulation.py
├── r/
│   ├── environmental_monitoring_trend_report.R
│   └── sensor_reliability_summary.R
├── julia/
│   └── hydrological_signal_simulation.jl
├── rust/
│   └── telemetry_schema_validator.rs
├── go/
│   └── environmental_stream_simulator.go
├── typescript/
│   └── monitoring_dashboard_scaffold.ts
├── notebooks/
│   ├── environmental_telemetry_quality_pipeline.ipynb
│   └── environmental_monitoring_trend_report.ipynb
├── metadata/
│   ├── device_registry.yml
│   ├── telemetry_contract.yml
│   ├── calibration_manifest.yml
│   └── monitoring_indicator_catalog.yml
├── docs/
│   ├── governance_notes.md
│   ├── reproducibility_guide.md
│   ├── field_deployment_assumptions.md
│   └── environmental_data_quality_framework.md
└── outputs/
    ├── tables/
    ├── figures/
    └── reports/
The repository supports several practical workflows:
- SQL: device registry, sensor metadata, environmental telemetry, calibration records, quality flags, indicator views, and monitoring alerts.
- Embedded C: low-power sensor polling, calibration correction, rolling anomaly detection, local alert generation, and field-device logic.
- TinyML: compact on-device inference for environmental anomaly detection and sensor-event classification.
- PYNQ: hardware-aware edge acceleration for sensor-window feature extraction and signal-processing workflows.
- HDL/Verilog: streaming threshold detection and hardware-level signal-processing modules.
- Python: telemetry validation, feature engineering, geospatial processing, anomaly detection, SQLite export, and reproducible environmental analytics.
- R: trend analysis, field-performance reporting, statistical summaries, uncertainty communication, and report-ready figures.
- Julia: numerical simulation for hydrological or environmental dynamics.
- Rust: safe telemetry schema validation and command-line quality-control tooling.
- Go: streaming environmental event simulation and lightweight telemetry service patterns.
- TypeScript: dashboard scaffolding and browser-based monitoring interfaces.
SQL Workflow: Environmental Telemetry and Sensor Registry
SQL provides the durable structure for environmental telemetry. It defines device identity, deployment metadata, sensor types, calibration history, observations, quality flags, and environmental alerts.
Suggested filename:
sql/schema.sql-- Environmental Telemetry and Sensor Registry
-- ------------------------------------------
-- This schema supports environmental monitoring examples:
-- device registry, sensor metadata, calibration records,
-- telemetry readings, quality flags, and environmental alerts.
CREATE TABLE IF NOT EXISTS monitoring_devices (
device_id TEXT PRIMARY KEY,
device_type TEXT NOT NULL,
hardware_platform TEXT NOT NULL,
firmware_version TEXT NOT NULL,
deployment_site TEXT NOT NULL,
latitude REAL,
longitude REAL,
installed_at TEXT NOT NULL,
active INTEGER NOT NULL CHECK (active IN (0, 1))
);
CREATE TABLE IF NOT EXISTS environmental_sensors (
sensor_id TEXT PRIMARY KEY,
device_id TEXT NOT NULL,
sensor_type TEXT NOT NULL,
environmental_domain TEXT NOT NULL,
unit TEXT NOT NULL,
sampling_interval_seconds INTEGER NOT NULL,
FOREIGN KEY (device_id) REFERENCES monitoring_devices(device_id)
);
CREATE TABLE IF NOT EXISTS calibration_records (
calibration_id INTEGER PRIMARY KEY AUTOINCREMENT,
sensor_id TEXT NOT NULL,
calibrated_at TEXT NOT NULL,
calibration_method TEXT NOT NULL,
scale_factor REAL NOT NULL,
offset_value REAL NOT NULL,
reference_standard TEXT,
FOREIGN KEY (sensor_id) REFERENCES environmental_sensors(sensor_id)
);
CREATE TABLE IF NOT EXISTS environmental_observations (
observation_id INTEGER PRIMARY KEY AUTOINCREMENT,
sensor_id TEXT NOT NULL,
observed_at TEXT NOT NULL,
raw_value REAL NOT NULL,
calibrated_value REAL NOT NULL,
battery_voltage REAL,
signal_quality REAL,
quality_flag TEXT NOT NULL,
transmitted INTEGER NOT NULL CHECK (transmitted IN (0, 1)),
FOREIGN KEY (sensor_id) REFERENCES environmental_sensors(sensor_id)
);
CREATE TABLE IF NOT EXISTS environmental_alerts (
alert_id INTEGER PRIMARY KEY AUTOINCREMENT,
sensor_id TEXT NOT NULL,
observed_at TEXT NOT NULL,
alert_type TEXT NOT NULL,
severity TEXT NOT NULL,
calibrated_value REAL NOT NULL,
threshold_value REAL NOT NULL,
handled_locally INTEGER NOT NULL CHECK (handled_locally IN (0, 1)),
FOREIGN KEY (sensor_id) REFERENCES environmental_sensors(sensor_id)
);This SQL layer matters because environmental monitoring systems require more than raw readings. They require device metadata, sensor definitions, calibration records, quality flags, spatial context, and traceable alert logic.
Embedded C Workflow: Low-Power Environmental Sensor Monitor
Embedded C is useful for environmental monitoring because field devices often require direct control over sensors, timing, memory, sleep states, and communication. The example below demonstrates firmware-style logic for calibration correction and rolling anomaly detection.
Suggested filename:
embedded_c/low_power_environmental_sensor_monitor.c/*
* Low-Power Environmental Sensor Monitor
* --------------------------------------
*
* Firmware-style example for field monitoring:
* - read a raw environmental sensor value
* - apply calibration correction
* - maintain a rolling average
* - detect local anomalies
* - trigger a local alert before cloud transmission
*/
#include <stdio.h>
#include <stdbool.h>
#define WINDOW_SIZE 10
#define ANOMALY_THRESHOLD 5.0f
#define SCALE_FACTOR 1.02f
#define OFFSET_VALUE -0.30f
static float calibrated_samples[WINDOW_SIZE];
static int sample_index = 0;
static bool buffer_full = false;
float read_raw_sensor_value(void) {
/*
* Replace with ADC, I2C, SPI, or UART sensor read.
* Example environmental sensors:
* - water temperature
* - soil moisture
* - turbidity
* - air-quality particulate reading
*/
static float synthetic_raw_value = 20.0f;
synthetic_raw_value += 0.4f;
return synthetic_raw_value;
}
float apply_calibration(float raw_value) {
return (SCALE_FACTOR * raw_value) + OFFSET_VALUE;
}
void add_sample(float value) {
calibrated_samples[sample_index] = value;
sample_index++;
if (sample_index >= WINDOW_SIZE) {
sample_index = 0;
buffer_full = true;
}
}
float rolling_average(void) {
int count = buffer_full ? WINDOW_SIZE : sample_index;
if (count == 0) {
return 0.0f;
}
float total = 0.0f;
for (int i = 0; i < count; i++) {
total += calibrated_samples[i];
}
return total / count;
}
bool is_local_anomaly(float current_value, float average_value) {
float difference = current_value - average_value;
if (difference < 0.0f) {
difference = -difference;
}
return difference > ANOMALY_THRESHOLD;
}
void trigger_environmental_alert(float value, float average) {
/*
* Replace with platform-specific action:
* - set GPIO
* - write to local flash
* - send LoRa/MQTT gateway event
* - increase sampling frequency
* - enter safe monitoring mode
*/
printf("ENVIRONMENTAL ALERT: value=%0.2f rolling_average=%0.2f\n", value, average);
}
int main(void) {
for (int cycle = 0; cycle < 30; cycle++) {
float raw_value = read_raw_sensor_value();
float calibrated_value = apply_calibration(raw_value);
float average = rolling_average();
if (buffer_full && is_local_anomaly(calibrated_value, average)) {
trigger_environmental_alert(calibrated_value, average);
}
add_sample(calibrated_value);
/*
* In real firmware, enter low-power sleep here until the next
* timer interrupt or sensor event.
*/
}
return 0;
}This workflow represents the device-level foundation of monitoring: sense, calibrate, summarize, detect, and respond.
TinyML Workflow: On-Device Environmental Anomaly Detection
TinyML enables compact models to run on microcontrollers and constrained edge devices. In environmental monitoring, TinyML can support local event detection, wildlife acoustic classification, vibration anomaly detection, air-quality events, water-quality anomalies, and adaptive sampling.
Suggested filename:
tinyml/environmental_tinyml_inference_stub.cpp/*
* Environmental TinyML Inference Stub
* -----------------------------------
*
* Educational scaffold for on-device environmental anomaly scoring.
* Replace the scoring function with a quantized TensorFlow Lite Micro,
* CMSIS-NN, or Edge Impulse model in production.
*/
#include <stdint.h>
#include <stdio.h>
typedef struct {
float mean_value;
float standard_deviation;
float minimum_value;
float maximum_value;
float signal_energy;
float recent_change_rate;
} EnvironmentalFeatureVector;
float run_environmental_inference_stub(EnvironmentalFeatureVector features) {
float score = 0.0f;
score += 0.20f * features.mean_value;
score += 0.25f * features.standard_deviation;
score += 0.20f * features.signal_energy;
score += 0.25f * features.recent_change_rate;
return score;
}
int main(void) {
EnvironmentalFeatureVector features = {
.mean_value = 0.52f,
.standard_deviation = 0.21f,
.minimum_value = 0.08f,
.maximum_value = 0.91f,
.signal_energy = 0.67f,
.recent_change_rate = 0.31f
};
float anomaly_score = run_environmental_inference_stub(features);
printf("Environmental TinyML anomaly score: %0.3f\n", anomaly_score);
return 0;
}TinyML is especially relevant where environmental monitoring nodes must preserve power, reduce bandwidth, protect sensitive data, or continue operating during network disruption.
PYNQ Workflow: Edge Acceleration for Sensor Windows
PYNQ supports Python-controlled workflows on FPGA-capable platforms. It can be used to prototype environmental edge analytics that benefit from hardware acceleration, such as streaming filters, image preprocessing, spectral analysis, and high-frequency sensor-window feature extraction.
Suggested filename:
pynq/pynq_environmental_edge_acceleration.py"""
PYNQ Environmental Edge Acceleration
------------------------------------
Educational PYNQ-style workflow for environmental sensor-window processing.
This runs in software simulation mode, while showing where PYNQ overlay
logic would be used on supported hardware.
"""
from __future__ import annotations
import numpy as np
def simulate_environmental_signal(window_size: int = 256) -> np.ndarray:
"""Create a synthetic environmental sensor signal."""
time = np.linspace(0, 1, window_size)
seasonal_component = np.sin(2 * np.pi * 4 * time)
noise = 0.10 * np.random.randn(window_size)
return (seasonal_component + noise).astype(np.float32)
def extract_features(signal: np.ndarray) -> dict:
"""Compute features that could be accelerated in programmable logic."""
return {
"mean": float(np.mean(signal)),
"std": float(np.std(signal)),
"energy": float(np.sum(signal ** 2)),
"minimum": float(np.min(signal)),
"maximum": float(np.max(signal)),
}
def pynq_overlay_placeholder(signal: np.ndarray) -> dict:
"""
Placeholder for PYNQ hardware acceleration.
On supported PYNQ hardware, this section would:
- load an FPGA overlay
- allocate DMA buffers
- stream signal windows to accelerator logic
- retrieve features from programmable logic
"""
return extract_features(signal)
def main() -> None:
signal = simulate_environmental_signal()
features = pynq_overlay_placeholder(signal)
print("PYNQ environmental edge acceleration workflow complete.")
print(features)
if __name__ == "__main__":
main()This workflow bridges environmental data science and hardware-aware computing. It shows how environmental monitoring can move from passive sensing toward accelerated local interpretation.
HDL Workflow: Streaming Signal Threshold Module
HDL belongs in environmental monitoring when systems need deterministic, low-latency hardware logic. FPGA-based monitoring can support streaming filters, counters, threshold detectors, finite-state machines, and parallel signal pathways.
Suggested filename:
hdl/streaming_threshold_detector.v/*
* Streaming Threshold Detector
* ----------------------------
*
* Educational Verilog module for environmental signal monitoring.
* The module raises alert_out when a streaming sensor value exceeds
* a configured threshold.
*/
module streaming_threshold_detector #(
parameter DATA_WIDTH = 16
)(
input wire clk,
input wire reset_n,
input wire valid_in,
input wire [DATA_WIDTH-1:0] sensor_value,
input wire [DATA_WIDTH-1:0] threshold_value,
output reg alert_out
);
always @(posedge clk or negedge reset_n) begin
if (!reset_n) begin
alert_out <= 1'b0;
end else begin
if (valid_in && sensor_value > threshold_value) begin
alert_out <= 1'b1;
end else begin
alert_out <= 1'b0;
end
end
end
endmoduleThis module is intentionally simple. It illustrates the hardware-level version of a monitoring pattern that also appears in SQL, Python, R, Embedded C, and TinyML: compare an observation with an expected range, then produce a structured signal for downstream action.
Python Workflow: Environmental Telemetry Quality Pipeline
Python is the primary workflow language for environmental telemetry validation, feature engineering, geospatial preparation, and reproducible analytics. The workflow below creates synthetic environmental observations, applies calibration, calculates data-quality indicators, and writes outputs.
Suggested filename:
python/environmental_telemetry_quality_pipeline.py"""
Environmental Telemetry Quality Pipeline
----------------------------------------
This workflow demonstrates how environmental monitoring data can be validated,
calibrated, and exported into structured analytical outputs.
"""
from __future__ import annotations
import sqlite3
from pathlib import Path
import pandas as pd
PROJECT_ROOT = Path(__file__).resolve().parents[1]
DATA_DIR = PROJECT_ROOT / "data" / "processed"
OUTPUT_DIR = PROJECT_ROOT / "outputs" / "tables"
DATABASE_PATH = PROJECT_ROOT / "outputs" / "environmental_monitoring.sqlite"
DATA_DIR.mkdir(parents=True, exist_ok=True)
OUTPUT_DIR.mkdir(parents=True, exist_ok=True)
DATABASE_PATH.parent.mkdir(parents=True, exist_ok=True)
def create_synthetic_observations() -> pd.DataFrame:
"""Create synthetic environmental telemetry records."""
return pd.DataFrame(
[
{"sensor_id": "AIR-001", "domain": "air_quality", "raw_value": 18.4, "scale_factor": 1.00, "offset_value": 0.00, "battery_voltage": 3.91, "signal_quality": 0.98, "observed_at": "2026-04-01T10:00:00"},
{"sensor_id": "AIR-001", "domain": "air_quality", "raw_value": 22.7, "scale_factor": 1.00, "offset_value": 0.00, "battery_voltage": 3.90, "signal_quality": 0.97, "observed_at": "2026-04-01T10:05:00"},
{"sensor_id": "WATER-001", "domain": "water_quality", "raw_value": 7.10, "scale_factor": 1.02, "offset_value": -0.05, "battery_voltage": 3.70, "signal_quality": 0.91, "observed_at": "2026-04-01T10:00:00"},
{"sensor_id": "SOIL-001", "domain": "soil_monitoring", "raw_value": 34.20, "scale_factor": 0.98, "offset_value": 0.20, "battery_voltage": 3.50, "signal_quality": 0.76, "observed_at": "2026-04-01T10:00:00"},
{"sensor_id": "ECO-001", "domain": "biodiversity", "raw_value": None, "scale_factor": 1.00, "offset_value": 0.00, "battery_voltage": 3.66, "signal_quality": 0.88, "observed_at": "2026-04-01T10:00:00"},
]
)
def add_calibrated_values(df: pd.DataFrame) -> pd.DataFrame:
"""Apply a simple linear calibration model."""
df = df.copy()
df["calibrated_value"] = (df["scale_factor"] * df["raw_value"]) + df["offset_value"]
return df
def calculate_quality_report(df: pd.DataFrame) -> pd.DataFrame:
"""Calculate environmental telemetry quality indicators."""
valid_records = (
df["calibrated_value"].notna()
& (df["battery_voltage"] >= 3.3)
& (df["signal_quality"] >= 0.80)
)
report = {
"record_count": len(df),
"missing_raw_values": int(df["raw_value"].isna().sum()),
"mean_battery_voltage": float(df["battery_voltage"].mean()),
"mean_signal_quality": float(df["signal_quality"].mean()),
"valid_records": int(valid_records.sum()),
"valid_record_rate": float(valid_records.mean()),
}
return pd.DataFrame([report])
def main() -> None:
observations = create_synthetic_observations()
observations["observed_at"] = pd.to_datetime(observations["observed_at"])
observations = add_calibrated_values(observations)
quality_report = calculate_quality_report(observations)
observations_path = DATA_DIR / "environmental_observations.csv"
report_path = OUTPUT_DIR / "environmental_telemetry_quality_report.csv"
observations.to_csv(observations_path, index=False)
quality_report.to_csv(report_path, index=False)
with sqlite3.connect(DATABASE_PATH) as connection:
observations.to_sql("environmental_observations", connection, if_exists="replace", index=False)
quality_report.to_sql("environmental_telemetry_quality_report", connection, if_exists="replace", index=False)
print("Environmental Telemetry Quality Pipeline complete.")
print(quality_report)
if __name__ == "__main__":
main()This workflow emphasizes that environmental monitoring requires calibration, quality control, and structured outputs before interpretation.
R Workflow: Environmental Monitoring Trend Report
R is useful for environmental trend analysis, report-ready summaries, uncertainty communication, and statistical visualization.
Suggested filename:
r/environmental_monitoring_trend_report.R# Environmental Monitoring Trend Report
# -------------------------------------
#
# Reads processed environmental observations and produces a domain-level
# monitoring summary.
library(readr)
library(dplyr)
library(ggplot2)
project_root <- normalizePath(file.path(dirname(sys.frame(1)$ofile), ".."))
input_path <- file.path(project_root, "data", "processed", "environmental_observations.csv")
output_tables_dir <- file.path(project_root, "outputs", "tables")
output_figures_dir <- file.path(project_root, "outputs", "figures")
dir.create(output_tables_dir, recursive = TRUE, showWarnings = FALSE)
dir.create(output_figures_dir, recursive = TRUE, showWarnings = FALSE)
observations <- read_csv(input_path, show_col_types = FALSE)
domain_summary <- observations |>
group_by(domain) |>
summarise(
records = n(),
missing_values = sum(is.na(calibrated_value)),
mean_calibrated_value = mean(calibrated_value, na.rm = TRUE),
mean_battery_voltage = mean(battery_voltage, na.rm = TRUE),
mean_signal_quality = mean(signal_quality, na.rm = TRUE),
.groups = "drop"
)
write_csv(
domain_summary,
file.path(output_tables_dir, "environmental_monitoring_domain_summary.csv")
)
quality_plot <- ggplot(domain_summary, aes(x = domain, y = mean_signal_quality)) +
geom_col() +
labs(
title = "Mean Signal Quality by Environmental Monitoring Domain",
x = "Monitoring domain",
y = "Mean signal quality"
) +
theme_minimal()
ggsave(
filename = file.path(output_figures_dir, "mean_signal_quality_by_domain.png"),
plot = quality_plot,
width = 8,
height = 5,
dpi = 300
)
print(domain_summary)The R workflow supports analytical communication: which monitoring domains are reliable, where signal quality is weaker, which records are missing, and which systems may need maintenance or calibration review.
Applications in Science, Governance, and Risk Management
Environmental monitoring systems support a wide range of scientific, institutional, and operational applications. Their value lies not only in observing environmental conditions, but in enabling comparison across time, improving situational awareness, and supporting evidence-based intervention.
- climate observation, forecasting, adaptation, and attribution support
- air and water pollution detection for compliance and public health
- watershed management, flood preparedness, drought monitoring, and hydrological planning
- biodiversity conservation, habitat assessment, restoration monitoring, and ecological research
- precision agriculture, soil monitoring, irrigation management, and land stewardship
- urban sustainability strategy, heat-risk mapping, stormwater management, and infrastructure resilience
- disaster detection, early warning, and emergency response coordination
- environmental reporting, sustainability indicators, and long-term policy analysis
- community-based monitoring, environmental justice analysis, and public accountability
- industrial environmental compliance, emissions monitoring, and operational risk detection
As environmental pressures intensify, these systems are becoming less peripheral and more infrastructural. They shape how institutions define environmental baselines, identify thresholds, allocate resources, and justify action. In many cases, what can be governed depends first on what can be observed.
Future Directions
The future of environmental monitoring lies in greater integration across scales, systems, and institutional contexts. Sensor miniaturization, low-power networking, edge computation, satellite observation, geospatial analytics, machine learning, TinyML, PYNQ/FPGA acceleration, and interoperable data platforms are making it possible to build monitoring systems that are more continuous, distributed, adaptive, and cost-effective than earlier generations of infrastructure.
At the same time, the central challenge is not simply technical expansion, but epistemic and institutional integration. Monitoring systems must become more interoperable, more explainable, more governed, and more usable across scientific, regulatory, infrastructural, and community settings. Future systems will need to support not only data collection, but uncertainty communication, threshold detection, comparative baselining, public accountability, and long-term decision support under environmental volatility.
Environmental monitoring systems are therefore evolving from instruments of observation into infrastructures of governance. As climate risk, ecological instability, water stress, air pollution, infrastructure vulnerability, and biodiversity loss intensify, the capacity to measure environmental change accurately and act on it intelligently will become one of the defining requirements of resilient societies.
Methodological Orientation
This pillar uses a systems-based and reproducibility-centered approach to environmental monitoring. It treats field sensing, embedded firmware, edge computing, remote sensing, geospatial analysis, data engineering, statistical modeling, dashboard design, and governance as connected components of a single observational lifecycle.
The methodological stance is practical but critical. Embedded C examples are treated as patterns for low-level environmental sensing. TinyML examples are treated as constrained local inference systems, not miniature cloud models. PYNQ and HDL examples are treated as hardware-aware pathways for low-latency edge processing. SQL, Python, and R connect device telemetry to structured environmental data, quality assurance, trend analysis, and reproducible reporting.
This pillar is intended to help readers understand how environmental monitoring systems are built, how environmental observations become evidence, how uncertainty and calibration shape interpretation, and how monitoring infrastructure can support more accountable science, governance, resilience, and sustainability strategy.
How This Series Connects Across the Site
Environmental Monitoring Systems connects directly to Embedded and Edge Systems, because field observation depends on sensors, microcontrollers, firmware, edge analytics, TinyML, PYNQ, and local telemetry. It connects to Data Systems & Analytics, because environmental observations must be validated, structured, stored, modeled, visualized, and governed. It connects to Artificial Intelligence Systems, because machine learning increasingly supports anomaly detection, remote sensing classification, ecological monitoring, forecasting, and environmental decision support.
It also connects to Planetary Boundaries, where monitoring evidence helps track pressure on Earth system processes; to Sustainable Development, where measurement systems support indicators, planning, and accountability; to Risk & Resilience, where environmental observation supports early warning and adaptation; and to Institutions & Governance, where environmental data must be legitimate, transparent, interoperable, and publicly accountable.
Across the wider site, this pillar provides the observational layer beneath sustainability knowledge. Environmental systems cannot be governed responsibly without reliable observation.
Related Reading
- Embedded and Edge Systems
- Data Systems & Analytics
- Artificial Intelligence Systems
- Planetary Boundaries
- Sustainable Development
- Risk & Resilience
- Institutions & Governance
- Systems Thinking
Further Reading
- Group on Earth Observations (n.d.) GEO: Group on Earth Observations. Available at: https://earthobservations.org/
- NASA Earth Observatory (n.d.) Earth Observatory. Available at: https://earthobservatory.nasa.gov/
- NASA Earthdata (n.d.) Earth Science Data Systems. Available at: https://earthdata.nasa.gov/
- OpenAQ (n.d.) Open Air Quality Data Platform. Available at: https://openaq.org/
- United Nations Environment Programme (n.d.) UNEP. Available at: https://www.unep.org/
- United States Geological Survey (n.d.) Water Resources Mission Area. Available at: https://www.usgs.gov/mission-areas/water-resources
- World Meteorological Organization (n.d.) WMO Integrated Global Observing System. Available at: https://wmo.int/activities/wigos
References
- Group on Earth Observations (n.d.) GEO: Group on Earth Observations. Available at: https://earthobservations.org/
- NASA Earth Observatory (n.d.) Earth Observatory. Available at: https://earthobservatory.nasa.gov/
- NASA Earthdata (n.d.) Earth Science Data Systems. Available at: https://earthdata.nasa.gov/
- OpenAQ (n.d.) Open Air Quality Data Platform. Available at: https://openaq.org/
- United Nations Environment Programme (n.d.) UNEP. Available at: https://www.unep.org/
- United States Geological Survey (n.d.) Water Resources Mission Area. Available at: https://www.usgs.gov/mission-areas/water-resources
- World Meteorological Organization (n.d.) WMO Integrated Global Observing System. Available at: https://wmo.int/activities/wigos
Return to the Sustainable Systems index.