Technology & Systems Intelligence

Technology and systems intelligence examine how advanced analytical tools and digital technologies can enhance our understanding of complex systems. Technologies such as artificial intelligence, machine learning, sensor networks, and large-scale data analytics are increasingly used to analyze environmental, economic, and social systems.

Systems intelligence emphasizes the ability to integrate data, models, and human expertise in order to interpret complex patterns and support informed decision-making. Rather than replacing human judgment, these technologies augment the capacity of researchers and institutions to detect trends, simulate outcomes, and evaluate policy interventions.

As digital technologies become more deeply integrated into governance and sustainability research, the challenge lies in deploying them responsibly. Effective systems intelligence requires transparency, accountability, and careful integration with ethical and institutional frameworks.

Conceptual data-systems illustration showing secured databases, privacy controls, identity verification, access permissions, audit monitoring, and governed data access across modern platforms.

Data Security, Privacy, and Access Control in Modern Data Systems

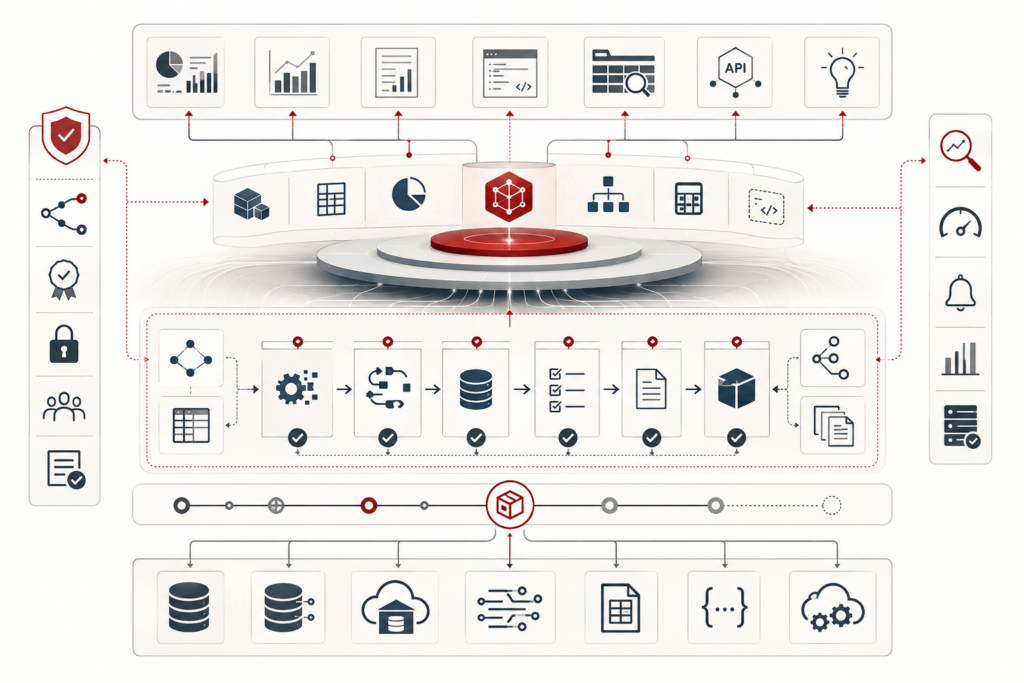
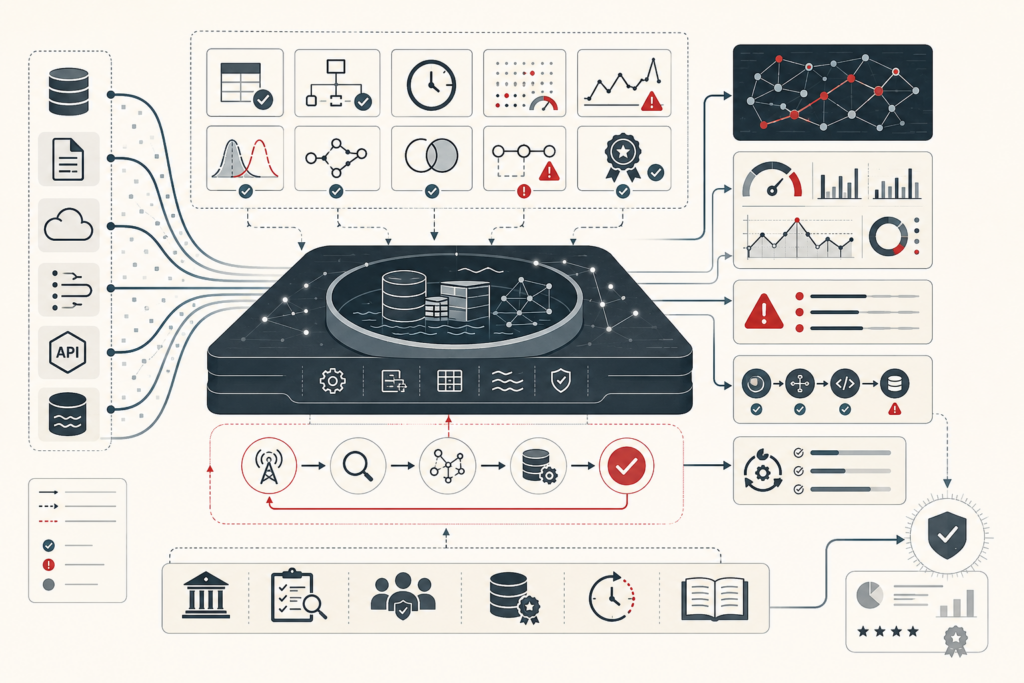
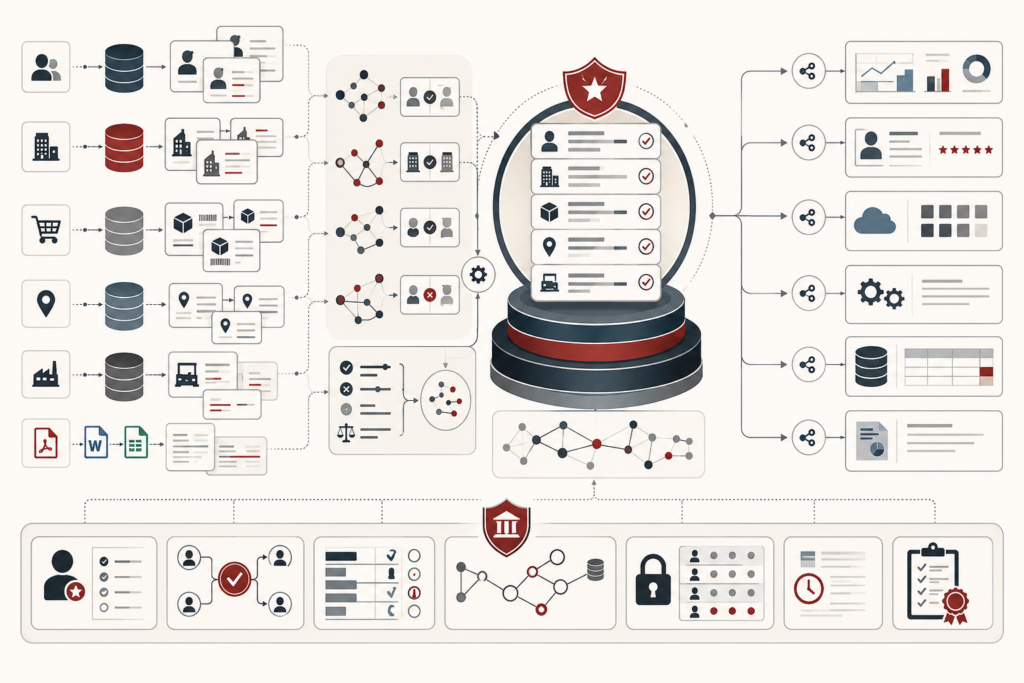
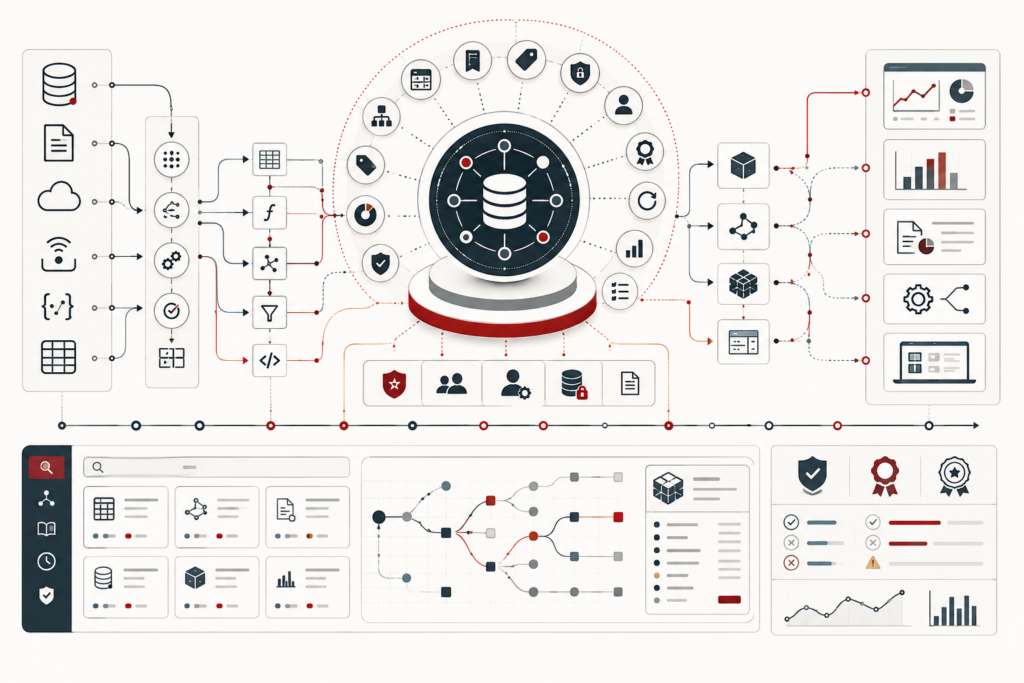
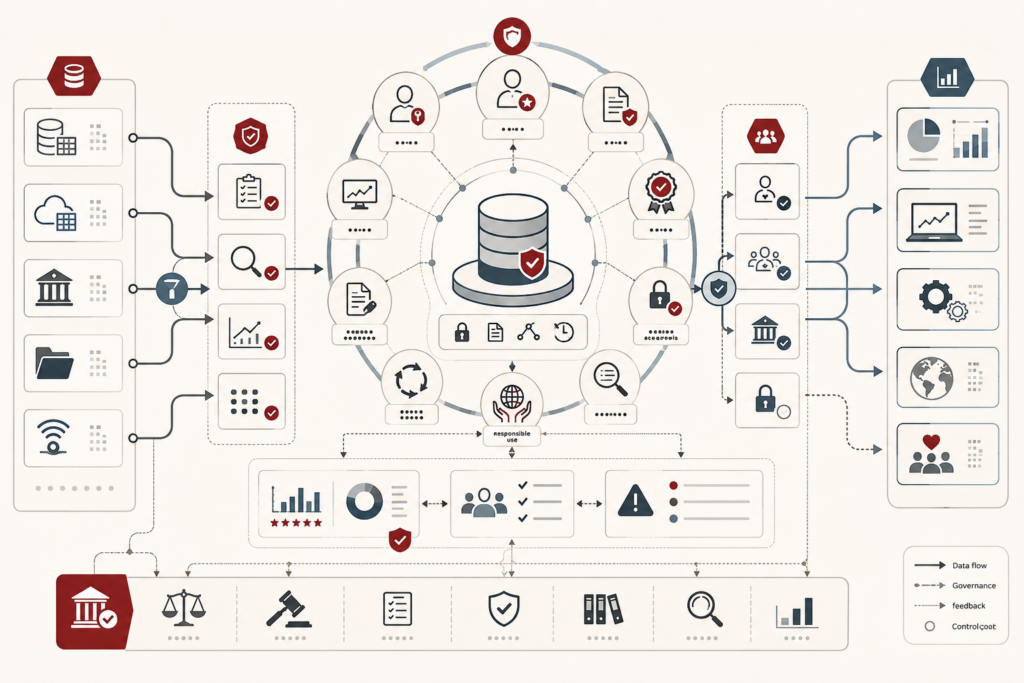
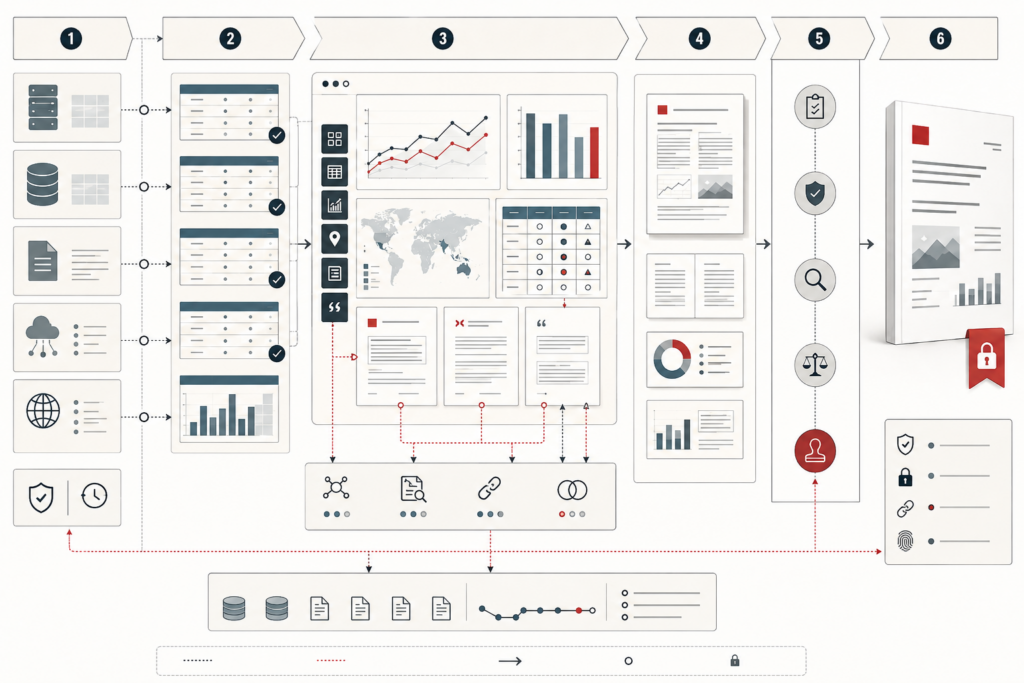
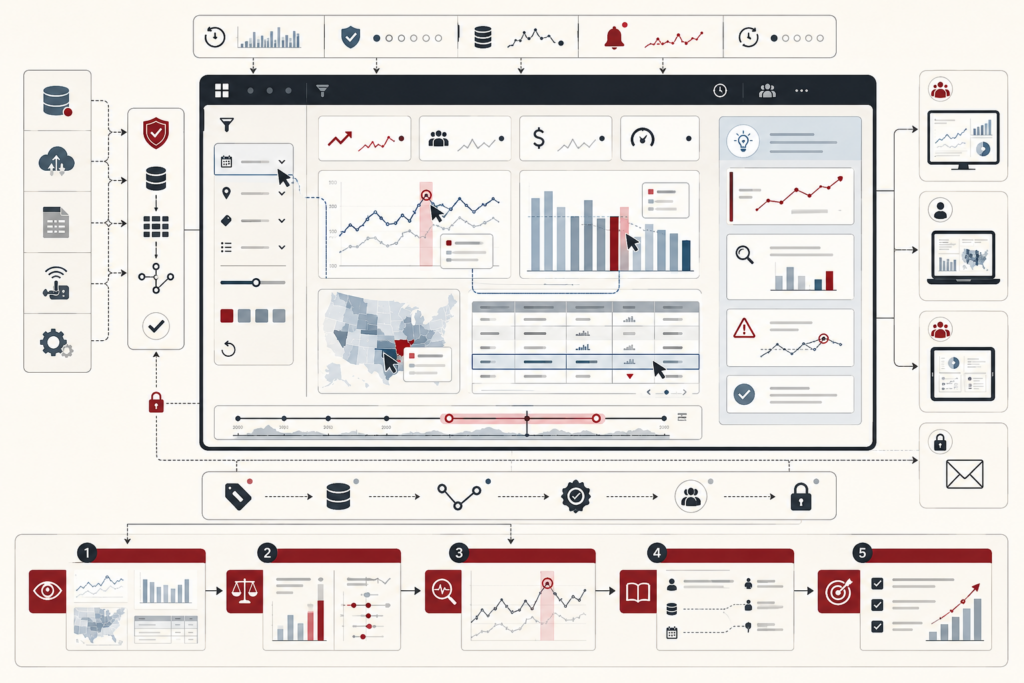
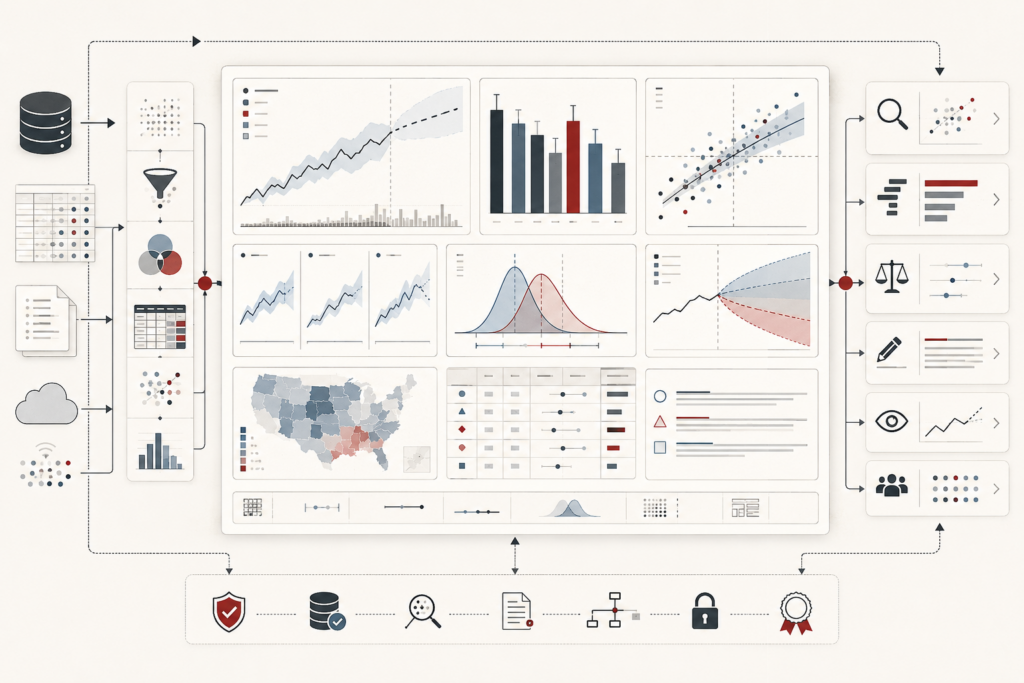
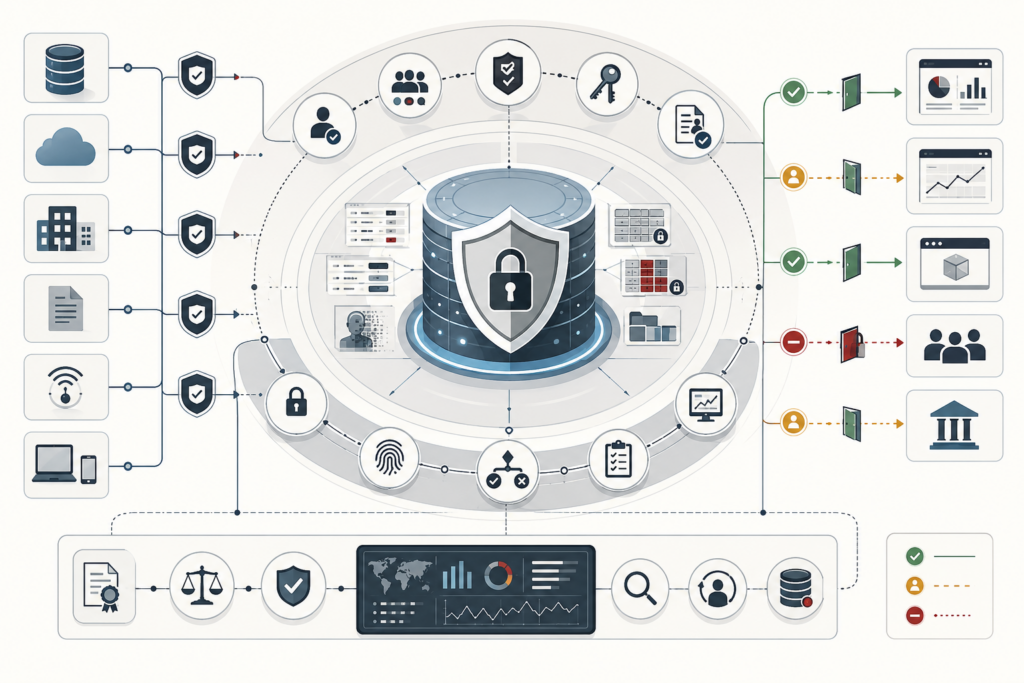
Data security, privacy, and access control define the conditions under which modern data systems can be trusted. Rather than treating security as a perimeter issue, privacy as a compliance afterthought, or access control as simple permission management, this article frames all three as governance over data power. It explains how classification, identity, authorization, least privilege, zero trust, purpose limitation, minimization, masking, tokenization, audit logging, entitlement review, and semantic-layer controls shape whether data use remains justified, proportionate, and accountable. The article also introduces a mathematical lens for evaluating residual risk, control effectiveness, and entitlement drift, supported by Python and R workflows for asset scoring, privacy-purpose review, access-policy validation, and audit analysis. Its central argument is that legitimate analytics depends on governing not only what data can do, but who may use it, why, and under what constraints.

Conceptual data-systems illustration showing an analytics engineering workflow connected to a central semantic layer, governed metrics, validated transformations, data models, APIs, dashboards, and reusable analytical outputs.

Analytics Engineering and Semantic Layers

Analytics engineering and semantic layers turn raw data infrastructure into trustworthy analytical meaning. This article frames analytics engineering as semantic governance: the discipline of transforming operational data into tested, documented, reusable models that preserve business logic, grain, lineage, and interpretive continuity. It explains how semantic layers function as interpretive contracts, allowing metrics, dimensions, entities, filters, and hierarchies to be reused consistently across dashboards, notebooks, APIs, applications, and AI-enabled analytical workflows. The article also examines semantic instability, modeling layers, metric governance, multiple coexisting definitions, versioning, self-service analytics, tool portability, observability, and the politics of abstraction. A mathematical lens and Python/R workflows show how teams can evaluate semantic trust, definition drift, model readiness, usage, lineage, and test coverage. Its central argument is that trustworthy analytics depends on governing meaning, not just moving data.

Conceptual data-systems illustration showing data sources flowing into a quality and observability platform with validation checks, anomaly detection, monitoring dashboards, alerts, lineage, and governance controls.

Data Quality Metrics and Observability in Modern Data Systems

Data quality metrics and observability make trust inspectable in modern data systems. This article frames data quality not as a generic defect checklist, but as institutional measurement: the discipline of determining whether data remains fit for a defined purpose, decision, workflow, or governance requirement. It explains core quality dimensions such as accuracy, completeness, validity, consistency, timeliness, uniqueness, and integrity, while showing how observability extends quality into real-time operational assurance through freshness, volume, schema, distribution, drift, lineage, and incident signals. The article also introduces a mathematical lens and Python/R workflows for scoring dataset reliability, trust risk, baseline coverage, incident response, and downstream impact. Its central argument is that serious analytics depends on preserving epistemic trust over time.

Conceptual data-systems illustration showing customer, organization, product, location, and asset records being matched, resolved, governed, and connected into trusted master data entities.

Master Data Management and Entity Resolution in Modern Data Systems

Master data management and entity resolution make core organizational entities trustworthy across fragmented systems. This article frames MDM not as simple deduplication, but as representational governance: the discipline of defining, matching, stewarding, versioning, and authorizing the entities that data systems claim to describe. It explains how customers, suppliers, facilities, products, legal entities, households, and assets become unstable when identifiers, names, hierarchies, and source-system meanings diverge. The article examines deterministic, probabilistic, hybrid, and graph-based matching; precision-recall trade-offs; survivorship rules; golden records; stewardship workflows; hierarchy modeling; legal-entity identifiers; privacy risks; and regulated identity-resolution limits. A mathematical lens and Python/R workflows show how teams can evaluate match confidence, merge risk, master-entity maturity, stewardship burden, and lineage. Its central argument is that trustworthy analytics depends on governing identity itself.

Conceptual data-systems illustration showing data sources, validated evidence, charts, tables, maps, report structure, review checkpoints, audit controls, and a published analytical report.

Information Design and Analytical Reporting: Structure, Evidence, and Report Integrity

Information design and analytical reporting make evidence readable, traceable, and fit for responsible use. This article frames reporting not as downstream decoration, but as evidence architecture: the discipline of arranging claims, visuals, tables, prose, methods, uncertainty, review records, and appendices so readers can understand and evaluate analytical findings. It explains why report genre, audience, reader pathways, hierarchy, summaries, traceability, chart/table selection, baselines, uncertainty placement, methods disclosure, and versioned outputs all shape analytical trust. The article also examines reporting as institutional memory, governance artifact, decision record, and reproducible workflow. A mathematical lens and Python/R workflows show how teams can evaluate report integrity, evidence traceability, visual-table fit, uncertainty placement, methods sufficiency, review quality, output control, and reporting risk.

Conceptual data-systems illustration showing an interactive analytics dashboard with charts, maps, filters, monitoring alerts, exploratory controls, narrative panels, governance checks, and decision-support outputs.

Interactive Dashboards and Data Storytelling: Monitoring, Exploration, and Narrative Clarity

Interactive dashboards and data storytelling make analytical evidence navigable, contextual, and useful for decision support. This article frames dashboards not as collections of charts, but as governed analytical interfaces for monitoring, exploration, filtering, drill-down, and recurring judgment. It explains how data storytelling adds guided interpretation through sequencing, annotation, story points, caveats, and evidence framing. The article examines dashboard modes, KPI context, naked metrics, filter burden, linked views, progressive disclosure, cognitive load, accessibility, governance, metadata, lineage, and responsible interaction design. It also warns against clutter, hidden filter state, tooltip dependency, narrative overreach, and ungoverned dashboard surfaces. A mathematical lens and Python/R workflows show how teams can evaluate dashboard integrity, KPI context, interaction clarity, story coherence, accessibility, governance review, and evidence traceability.

Conceptual data-systems illustration showing charts, maps, uncertainty bands, distributions, comparison views, evidence panels, and communication pathways for analytical interpretation.

Data Visualization and Analytical Communication: Clarity, Uncertainty, and Visual Reasoning

Data visualization and analytical communication make evidence visible, interpretable, and trustworthy. This article frames visualization not as decoration, but as visual reasoning: the discipline of choosing chart forms, encodings, scales, annotations, uncertainty displays, and accessibility practices that help audiences compare, question, and understand analytical findings. It explains why visual communication depends on audience, context, perceptual accuracy, chart-task fit, distributional thinking, uncertainty placement, dashboard design, narrative framing, and evidence traceability. The article also examines common failures such as misleading scales, decorative complexity, hidden uncertainty, inaccessible color use, mismatched chart types, and false narrative closure. A mathematical lens and Python/R workflows show how teams can evaluate visual integrity, chart fit, encoding quality, uncertainty communication, accessibility, review status, and source traceability.

Scroll to Top