Conceptual causal inference illustration showing population data, random assignment, treatment and control groups, outcome measurement, causal diagrams, effect estimation, robustness checks, and causal claims.

Experimental Design and Causal Inference: Randomization, Identification, and Causal Claims

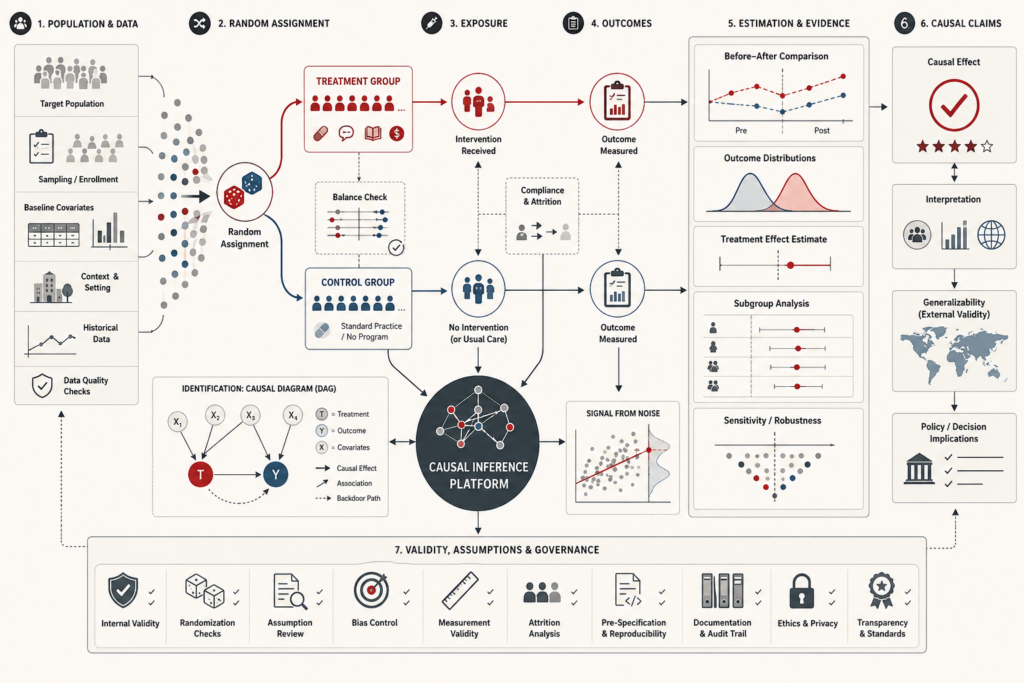
Experimental design and causal inference determine whether an analysis can move responsibly from observed association to credible claims about intervention. This article frames causal reasoning as design-governed evidence: the disciplined process of defining interventions, comparison conditions, outcomes, units, estimands, identification strategies, assumptions, validity threats, and robustness checks before making causal claims. It explains why prediction, correlation, and regression are not enough to answer questions about what would change under treatment, policy, exposure, or institutional action. The article also examines counterfactual reasoning, potential outcomes, randomization, blocking, factorial design, treatment effects, DAGs, backdoor adjustment, quasi-experiments, difference-in-differences, regression discontinuity, target-trial emulation, confounding, selection bias, post-treatment bias, transportability, and governance. Mathematical examples and Python/R workflows show how teams can evaluate causal readiness, assumption strength, effect estimates, validity risks, and evidentiary limits.

Conceptual analytics illustration showing time series data sources, trend and seasonality decomposition, forecast horizons, uncertainty intervals, validation, error metrics, monitoring, and forecast-risk signals.

Time Series Analysis and Forecasting: Trend, Seasonality, and Forecast Risk

Time series analysis and forecasting study data that unfolds through time and support decisions that must be made before the future is observed. This article frames forecasting as temporal evidence under uncertainty: the disciplined process of diagnosing trend, seasonality, autocorrelation, stationarity, structural breaks, forecast horizons, prediction intervals, and rolling-origin validation. It explains why time-ordered data cannot be treated as an unordered sample, why random cross-validation can create future leakage, and why forecast credibility depends on whether past temporal structure remains stable enough to project forward. The article also examines decomposition, smoothing, ARIMA, time series regression, backtesting, horizon-specific error, regime change, forecast governance, and decision risk. Mathematical examples and Python/R workflows show how teams can evaluate lag structure, forecast errors, interval coverage, diagnostic checks, readiness scores, and release status.

Conceptual statistical modeling illustration showing data inputs, parameter estimation, uncertainty intervals, model diagnostics, validation, robustness checks, evidence interpretation, and cautious analytical conclusions.

Statistical Modeling and Inference: Estimation, Uncertainty, and Evidence

Statistical modeling and inference move data beyond description toward estimation, uncertainty, and disciplined evidentiary claims. This article frames inference as qualified evidence: the process of defining estimands, building models, estimating parameters, reporting uncertainty, testing claims, diagnosing assumptions, and interpreting results with proportion. It explains why a model is not a mechanical truth machine, why p-values should not be treated as verdicts, and why statistical significance is not the same as practical meaning. The article also examines populations, samples, sampling variability, point estimates, confidence intervals, hypothesis testing, regression, residual diagnostics, robustness checks, effect size, model adequacy, and statistical humility. Mathematical examples and Python/R workflows show how teams can evaluate group intervals, mean differences, regression coefficients, diagnostic status, robustness records, inference-readiness scores, and evidence-governance gaps.

Conceptual analytics illustration showing descriptive statistics, distributions, comparison charts, maps, scatterplots, summary tables, and exploratory views used to identify patterns and generate analytical insight.

Descriptive Analytics and Data Exploration: Distributions, Patterns, and Analytical Insight

Descriptive analytics and data exploration make data legible before stronger analytical claims are built on top of it. This article frames EDA as analytical grounding: the disciplined process of profiling variables, summarizing distributions, inspecting missingness, identifying outliers, comparing subgroups, detecting aggregation risks, exploring relationships, and generating better questions. It explains why averages, dashboards, and summary tables are not enough when data is skewed, incomplete, heterogeneous, or shaped by hidden subgroup differences. The article also examines profiling, descriptive reporting, exploratory analysis, univariate/bivariate/multivariate exploration, visualization, distributional thinking, missingness, anomaly review, subgroup masking, and the limits of descriptive analytics. Mathematical examples and Python/R workflows show how teams can evaluate numeric profiles, categorical balance, missingness patterns, subgroup summaries, bivariate relationships, aggregation risk, outlier flags, and exploration-readiness scores.

Conceptual real-time analytics illustration showing streaming event sources, event-time processing, windows, watermarks, state stores, continuous computation, alerts, dashboards, observability, and governance controls.

Streaming Data and Real-Time Analytics: Event Time, State, and Continuous Insight

Streaming data and real-time analytics transform data systems from periodic reporting into continuously updating environments of observation, interpretation, and response. This article frames streaming analytics as temporal evidence in motion: the disciplined handling of event streams, event time, processing time, windows, watermarks, triggers, stateful computation, replayable logs, delivery semantics, alerts, serving views, and governance controls. It explains why real time is not simply a matter of speed, but of timeliness relative to action, correctness, and decision value. The article also examines batch, micro-batch, and continuous streaming; late data; provisional and refined outputs; state recovery; exactly-once claims; stream joins; materialized views; latency-cost-correctness tradeoffs; and observability. Mathematical examples and Python/R workflows show how teams can evaluate lateness, event-time windows, watermark lag, keyed state, alerts, topic readiness, and streaming-governance gaps.

Conceptual data-systems illustration showing ETL and ELT workflows, data sources, transformation stages, semantic modeling, change propagation, governed outputs, and monitoring controls.

ETL and Data Transformation Systems: Semantics, ELT, and Change Propagation

ETL and data transformation systems convert heterogeneous operational data into governed, analyzable, and reusable downstream state. This article frames ETL not as background plumbing, but as semantic infrastructure: the executable layer where source records are extracted, staged, mapped, cleansed, validated, conformed, merged, and loaded into canonical targets. It explains why source systems rarely share analytical meaning, why transformation logic stabilizes institutional definitions, and how ETL/ELT patterns differ in where computation occurs. The article also examines staging areas, canonical models, target schemas, data quality gates, surrogate keys, slowly changing state, CDC, idempotent merge logic, replay, orchestration, lineage, rejected-record quarantine, and transformation governance. Mathematical examples and Python/R workflows show how teams can evaluate mapping coverage, rejected records, CDC operations, canonical outputs, lineage records, transformation tests, and ETL-readiness scores.

Conceptual data-systems illustration showing messy data sources being cleaned, validated, governed, monitored, and transformed into trusted datasets and analytical outputs.

Data Cleaning and Data Quality Management: Quality, Governance, and Trust

Data cleaning and data quality management determine whether data is merely available or genuinely fit for use. This article frames quality as a multidimensional governance problem, not a one-time preprocessing task: records must be profiled, validated, standardized, repaired, disclosed, monitored, and tied back to the processes that produced them. It explains why accuracy alone is insufficient and why completeness, consistency, timeliness, validity, uniqueness, interpretability, accessibility, stewardship, and root-cause analysis all shape analytical trust. The article also examines duplicate identities, survivorship rules, rejected-record quarantine, quality incidents, pipeline monitoring, quality rules, and institutional accountability. Mathematical examples and Python/R workflows show how teams can evaluate completeness, validity, uniqueness, timeliness, rule pass rates, cleaning lineage, root causes, incidents, and data-quality readiness scores.

Conceptual data-systems illustration showing batch processing, streaming data, ingestion, orchestration, dataflow, metadata lineage, monitoring, governance, and downstream analytical outputs.

Data Pipelines and Data Processing Systems: Batch, Streaming, and Dataflow

Data pipelines and data processing systems are the operational machinery that turns raw, dispersed, and temporally uneven data into trusted downstream state. This article frames pipelines not as background plumbing, but as evidence infrastructure: directed dataflow graphs that ingest, validate, transform, enrich, route, monitor, replay, and serve data across batch, streaming, micro-batch, and backfill workflows. It explains why pipeline design determines whether dashboards, metrics, alerts, models, warehouses, feature stores, and data products can be trusted. The article also examines pipeline stages, DAGs, event-driven architectures, orchestration, stateful processing, windows, delivery semantics, idempotency, fault tolerance, observability, lineage, replay, and recomputation. Mathematical examples and Python/R workflows show how teams can evaluate graph topology, run health, quality gates, observability metrics, lineage edges, backfill readiness, idempotency checks, and pipeline-readiness scores.

Conceptual distributed data systems illustration showing replicated data across regions, partitioned shards, routing metadata, consensus coordination, failover, consistency controls, and observability.

Distributed Data Systems: Replication, Partitioning, and Consistency

Distributed data systems preserve useful data behavior when storage, computation, and users no longer live in one place. This article frames distribution not as “bigger databases,” but as coordination under failure: the discipline of partitioning data, replicating state, routing requests, managing quorum reads and writes, handling replica lag, coordinating leaders, resolving conflicts, and recovering after partial failure. It explains why scale, availability, geographic locality, and resilience force systems beyond centralized architecture, while also creating tradeoffs among consistency, latency, durability, and availability. The article also examines CAP, quorum policies, distributed transactions, consensus, conflict resolution, CP/AP/mixed architectures, failover, observability, and auditability. Mathematical examples and Python/R workflows show how teams can evaluate shard routing, replication health, quorum intersection, replica lag, operation health, conflict resolution, consensus events, failover drills, and distributed-system readiness scores.

Scroll to Top