
Last Updated May 11, 2026
Data pipelines and data processing systems are the operational backbone through which raw data becomes usable analytical input, durable institutional record, real-time decision signal, or governed downstream product. Databases store state, but pipelines move, validate, transform, enrich, route, and refresh that state across systems. Warehouses organize curated analytical data, but processing systems make curation possible. Stream platforms capture events, but pipeline logic determines how those events are filtered, windowed, aggregated, checked, stored, and delivered. For that reason, data pipelines should not be understood as mere plumbing. They are one of the principal architectural mechanisms through which modern organizations convert dispersed observations into structured, trusted, and actionable information.
This field matters because contemporary data environments are rarely static. Data is continuously generated by transactional applications, sensors, APIs, user interfaces, logs, message streams, scientific instruments, third-party platforms, and machine processes. These inputs vary in structure, volume, latency, semantics, and quality. They must often be combined across systems, standardized into common representations, checked for validity, enriched with contextual information, routed toward multiple destinations, and processed under different timing requirements. Some workloads can tolerate daily batch refreshes. Others require near-real-time or event-driven response. Data pipelines and processing systems exist to manage this temporal, structural, and organizational complexity.
Main Library
Publications
Article Map
Data Systems & Analytics
Related Topic
ETL & Transformation
Related Topic
Streaming Analytics
Related Topic
Distributed Data Systems
Modern pipeline architecture sits at the intersection of data engineering, distributed systems, storage design, stream processing, orchestration, and analytical governance. It includes ingestion layers, validation stages, transformation logic, execution frameworks, workflow scheduling, stateful computation, checkpointing, retry behavior, replay, backfills, lineage, observability, and downstream serving. It also forces decisions about where computation should happen, when data should be processed, how much latency is acceptable, whether state should be recomputed or incrementally updated, and how correctness should be balanced against speed and cost.
This article should be read alongside ETL and Data Transformation Systems, Streaming Data and Real-Time Analytics, Distributed Data Systems, Data Cleaning and Data Quality Management, Data Quality Metrics and Observability, Metadata, Data Catalogs, and Lineage, Cloud Data Platforms and Modern Data Stack Architecture, and Reproducible Analytics and Versioned Data Workflows. Pipelines are where these concerns become executable, scheduled, monitored, recoverable, and accountable over time.
Pipelines as operational evidence infrastructure
The strongest way to understand data pipelines is as operational evidence infrastructure. A pipeline does not simply connect system A to system B. It determines which records enter the analytical estate, which rules are applied, which transformations are trusted, which outputs are refreshed, which failures are retried, which exceptions are quarantined, which histories can be replayed, and which downstream users receive data under what conditions.
This gives pipelines a deeper institutional role. They are the executable machinery through which an organization decides what counts as current, valid, transformed, certified, and ready for use. A dashboard, model, metric, feature table, alert, regulatory extract, or data product may appear as a finished output, but it inherits its reliability from the pipeline path that produced it.
That is why pipeline design should be treated as a governance issue as much as an engineering issue. Pipeline graphs, quality gates, dependency logic, orchestration records, lineage edges, backfill records, and observability metrics all become part of the evidence trail. When pipelines are opaque, downstream trust becomes fragile. When they are explicit, monitored, and reconstructable, data systems become more defensible.
What data pipelines and processing systems mean
A data pipeline is an ordered sequence of operations through which data moves from one or more sources to one or more destinations while undergoing ingestion, validation, transformation, enrichment, aggregation, filtering, routing, or serving. The term refers not only to transport but to the structured flow of computation over data. A data processing system is the broader execution environment that runs such pipelines, coordinates work, manages state, handles failures, and supports batch, streaming, micro-batch, replay, or backfill workloads at scale.
This distinction matters because organizations often use the word “pipeline” too loosely. A scheduled file copy is one kind of pipeline, but so is a fault-tolerant stream-processing graph that joins event streams, maintains stateful aggregates, emits low-latency alerts, and writes multiple downstream views. The common architectural idea is ordered transformation under operational control.
Apache Beam’s documentation is useful because it describes a pipeline as a user-constructed graph of transformations that defines data-processing operations, with data represented in collections or streams and computation expressed through transforms. The Beam programming guide also encourages thinking of a pipeline as a directed acyclic graph in which transform nodes consume and emit data collections. This graph view helps separate the logical structure of computation from the details of a particular execution runner.
Why pipelines matter
Pipelines matter because raw data rarely arrives in a form that is immediately useful. Source systems produce records according to operational logic, not according to the needs of downstream analysis, reporting, compliance, modeling, governance, or decision support. Fields may be inconsistent, timestamps misaligned, identifiers duplicated, formats incompatible, schemas unstable, and meanings fragmented across systems. Without pipeline logic, organizations accumulate data but fail to convert it into coherent informational assets.
Pipeline design is therefore one of the places where data architecture becomes operational. It determines how data is standardized, when transformations happen, how frequently targets are refreshed, what quality checks are enforced, how updates propagate, what happens during failure, and how downstream outputs can be reconstructed. A warehouse, lake, dashboard, alerting system, or model feature store is only as trustworthy as the pipeline logic that populates it.
Pipelines also matter because timing matters. Some institutional uses depend on reproducible batch processing and historical backfills. Others depend on streaming architectures that react to events as they happen. Some need stable nightly refreshes. Others need continuous state. The pipeline is where these temporal requirements become explicit design choices.
The pipeline as directed dataflow
One of the most useful ways to think about a pipeline is as a dataflow graph. In this model, data is represented as collections or streams moving through transformations, with the outputs of one stage becoming inputs to another. Sources, transforms, validation checks, joins, windows, aggregations, enrichment steps, sinks, and serving layers all become nodes or edges in a directed computational structure.
This dataflow perspective is powerful because it separates the logical structure of computation from the physical details of the underlying processing engine. A pipeline can be understood as a graph of transformations even when execution is distributed across many machines, optimized by a runner, or split across batch and streaming engines. In that sense, pipelines are to processing systems what declarative queries are to relational databases: a higher-level way of describing intended computation.
Directed dataflow also makes governance easier. Once the graph is visible, teams can ask which upstream inputs affect a downstream table, which validation gates protect a serving view, which stages are stateful, which tasks are critical, which stages lack ownership, and which paths need stronger lineage. The graph is not only a technical representation. It is an institutional map of how data becomes evidence.
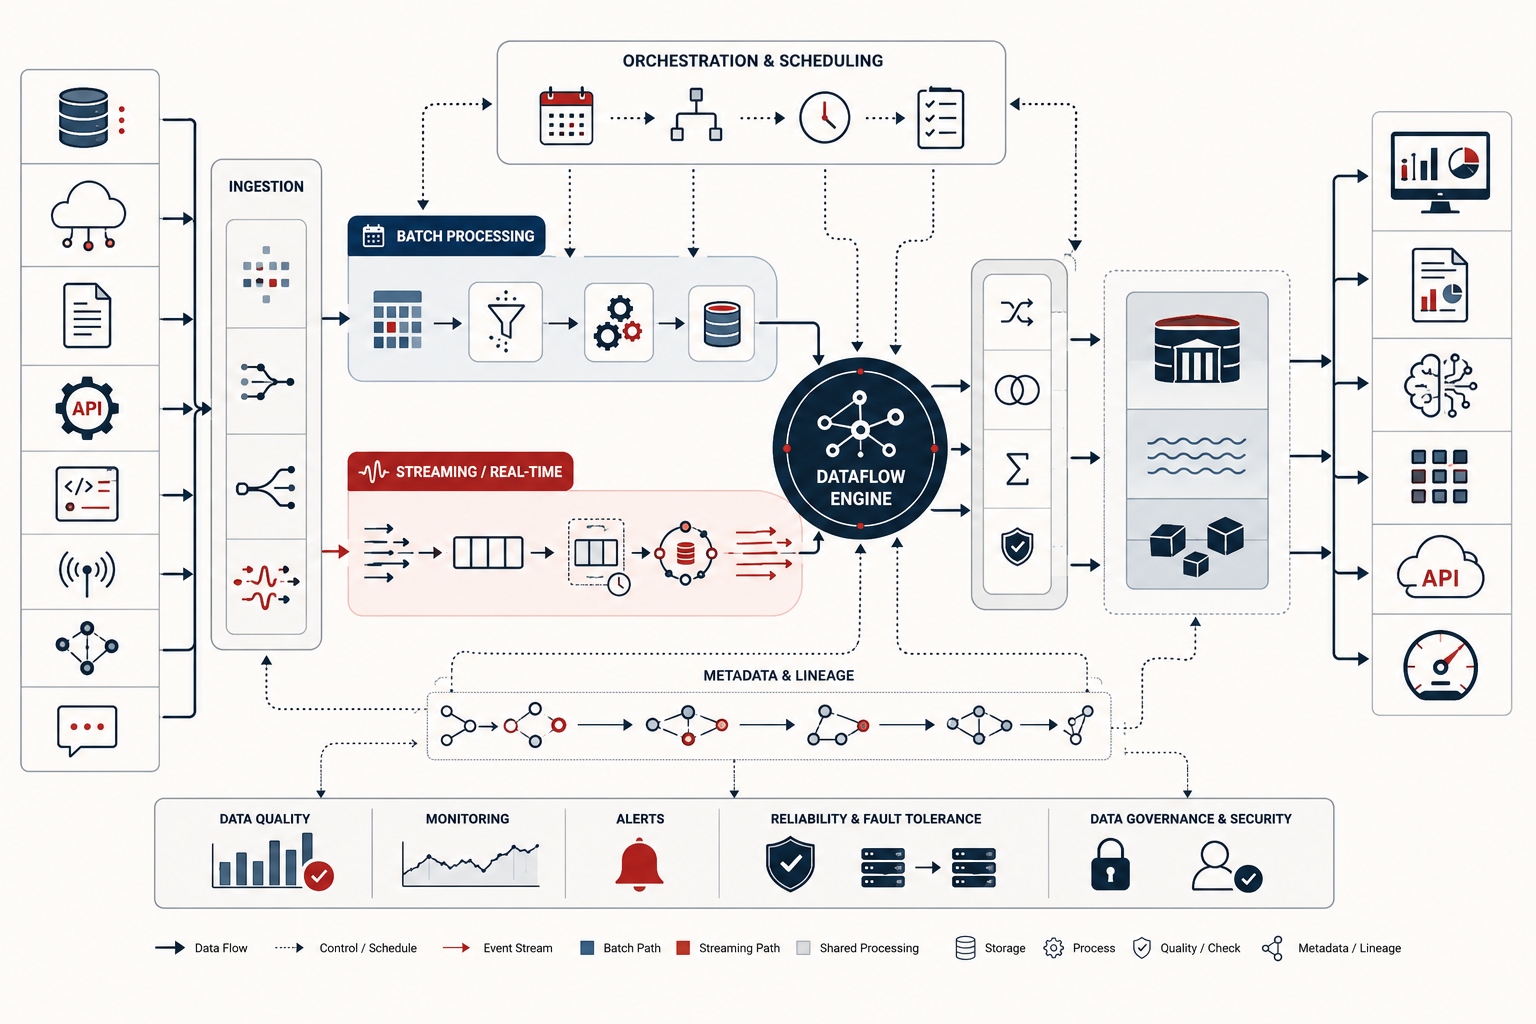
Pipeline stages from source to serving
Although implementations vary, most data pipelines include a recognizable set of stages.
Ingestion collects data from operational databases, APIs, files, message brokers, logs, sensors, event streams, partner feeds, or external platforms. Ingestion may be periodic, event-driven, continuous, or hybrid.
Validation and quality checks test records for schema conformity, missing fields, invalid ranges, duplicates, malformed timestamps, referential problems, timeliness, and other quality conditions.
Transformation standardizes, cleans, enriches, joins, aggregates, filters, reshapes, or maps data into structures more suitable for downstream use.
Stateful processing maintains rolling aggregates, deduplicates events, computes counters, applies business logic, joins records over time, or preserves session and window state.
Delivery and serving writes outputs to warehouses, lakes, marts, dashboards, feature stores, operational systems, APIs, or downstream message streams.
Monitoring and recovery tracks throughput, lag, errors, retries, freshness, quality failures, backpressure, checkpoint status, and replay readiness.
These stages are conceptually useful because they show that pipelines are not just connectors. They are multi-stage mechanisms for turning source data into managed downstream state.
| Stage | Primary purpose | Common failure if weak |
|---|---|---|
| Ingestion | Collects records, files, events, logs, or source changes | Missing feeds, duplicate loads, schema drift, unmanaged source timing |
| Validation | Checks quality, schema, domains, freshness, and completeness | Invalid records promoted into trusted downstream outputs |
| Transformation | Converts source representations into usable analytical forms | Opaque business logic, inconsistent semantics, unreproducible outputs |
| Stateful processing | Maintains counters, windows, sessions, joins, or incremental state | Corrupted state, duplicate effects, unrecoverable rolling metrics |
| Serving | Publishes outputs to warehouses, dashboards, APIs, feature stores, or sinks | Stale outputs, unclear certification, broken downstream contracts |
| Monitoring and recovery | Tracks health, detects incidents, supports retry, replay, and backfill | Silent failure, weak incident response, manual reconstruction |
Batch, streaming, micro-batch, and unified processing
Historically, data processing systems often separated batch processing from stream processing. Batch systems operated over bounded datasets, often on scheduled intervals, and emphasized throughput, reproducibility, and large-scale recomputation. Stream systems operated over unbounded event sequences and emphasized low latency, incremental results, and continual updating. These were once treated as distinct architectural domains.
Between these poles sits micro-batch processing, in which new data is accumulated over short intervals and processed as repeated small batches. Micro-batch designs can provide near-real-time outputs while preserving some of the operational simplicity of batch execution. Continuous streaming can support lower latency and richer event-time behavior, but usually increases state-management and correctness complexity.
The Dataflow model challenged a rigid batch-versus-stream divide by emphasizing bounded and unbounded data, event time, windows, triggers, lateness, and correctness-latency-cost tradeoffs. Apache Beam extends this unified-programming perspective by offering a model for both batch and streaming pipelines. The practical lesson is not that every workload should use the same execution engine. It is that modern institutions often need both historical recomputation and continuous updating inside one coherent architecture.
State, time, windows, and incremental computation
One of the defining complexities of modern processing systems is that computation often depends on state and time. In simple batch processing, data may be processed as a static set. In stream processing, records arrive over time and may arrive late, out of order, duplicated, or in bursts. Systems therefore need explicit ways to reason about event time versus processing time, how to group events into windows, and when intermediate results should be emitted.
Stateful processing extends this logic by allowing systems to retain partial results or keyed state between events. Instead of recomputing everything from scratch, the system incrementally updates counters, session state, rolling metrics, feature values, deduplication sets, or join buffers as new records arrive. This is one of the defining advantages of modern stream-processing architectures, but it also increases the difficulty of checkpointing, recovery, deduplication, and correctness under failure.
This matters because many real-world analytical problems are temporal rather than static. Fraud monitoring, sensor anomaly detection, clickstream analysis, infrastructure telemetry, customer journey tracking, logistics monitoring, and operational alerting all depend on incremental interpretation of data in time rather than one-off static transformation.
Delivery semantics, correctness, and effectively-once behavior
Pipeline correctness is not just about whether a transformation is logically sound. It is also about what guarantees the system provides when failures, retries, restarts, network interruptions, partial writes, or duplicate records occur. Distributed processing systems are often described in terms of at-most-once, at-least-once, and exactly-once delivery or processing semantics. These labels matter because they define whether records may be lost, duplicated, or processed once in a way consistent with the application’s expectations.
In practice, “exactly once” is often more subtle than the phrase implies. A system may provide exactly-once behavior only within a bounded portion of the stack or only when sources, processors, state stores, checkpoints, and sinks cooperate correctly. In many production systems, what institutions actually depend on is effectively-once behavior: the combination of idempotent writes, deduplication logic, transactional sinks, stable keys, and replay-safe processing so that repeated attempts do not corrupt downstream state.
This is why pipeline guarantees must be understood end to end rather than as marketing terms attached to one component. A message broker, processing engine, orchestration layer, and warehouse sink may each have different failure semantics. Trustworthy architecture depends on understanding how those semantics compose across the whole path.
Orchestration, scheduling, and dependency management
A pipeline must not only define computation. It must also run reliably in the right order, at the right time, with the right dependencies, configuration, credentials, and failure-handling behavior. This is the role of orchestration. Orchestration manages when jobs execute, what depends on what, how failures are retried, how upstream and downstream stages are sequenced, how backfills are launched, and how recurring tasks are coordinated across the estate.
This distinction between processing engines and orchestration systems is often neglected. A processing framework defines how data is transformed, partitioned, windowed, statefully computed, or written. An orchestration system governs when and how those transformations are executed across tasks, schedules, environments, and dependencies. One controls the logic of computation; the other controls the temporal and operational discipline of execution.
Without orchestration discipline, technically sound transformations can become unreliable in practice. Jobs may run out of order, upstream dependencies may not have finished, backfills may overwrite or double-load downstream state, and reproducibility may degrade. Pipeline maturity therefore depends on temporal governance as much as transformation logic.
DAG pipelines and event-driven architectures
Many pipeline systems are built around DAG execution: a graph of tasks with explicit dependencies that execute when upstream requirements are satisfied. This model works especially well for recurring batch jobs, warehouse refreshes, reproducible transformations, data quality gates, and multi-stage analytical workflows. Its strengths are clarity, debuggability, dependency visibility, and explicit control over execution order.
By contrast, event-driven architectures organize processing around continuously arriving records or messages. Instead of waiting for a scheduled run, consumers react to new events as they are published to streams, topics, logs, or queues. This model is especially powerful where low latency, continual updating, reactive behavior, or live operational coordination matters.
These are not mutually exclusive architectural worlds. Mature estates often combine them. Event streams may feed continuously updated intermediate state, while orchestrated DAG workflows perform daily compaction, validation, model retraining, feature publication, warehouse refreshes, or regulatory extracts. The deeper design question is not DAG versus streaming as a binary choice, but how periodic and continuous computation should be composed across the analytical system.
Replay, backfills, and recomputing analytical state
Serious data systems must assume that history will need to be revisited. New logic may be introduced, bugs may be discovered, reference data may change, late-arriving records may need to be incorporated, and downstream tables may need to be rebuilt from trusted raw sources. This is why replay, backfills, and recomputation are not peripheral maintenance concerns. They are central architectural requirements.
A backfill reprocesses historical data to populate or repair downstream outputs. Replay reconsumes prior events or source records so that state can be reconstructed under new logic. Recomputing analytical state may be necessary when dimensions change, deduplication improves, or a previous pipeline version produced incorrect outputs. Architectures that cannot replay history safely often become fragile because every correction requires manual patchwork rather than principled reconstruction.
This is one reason durable raw storage, immutable logs, checkpoint discipline, and versioned transformation logic are so important. Pipelines should not merely produce current outputs; they should preserve the conditions under which those outputs can be rebuilt, audited, and corrected.
Reliability, idempotency, and fault tolerance
Data pipelines run in imperfect environments. Files arrive late. APIs fail. Workers restart. Message consumers crash. Network partitions occur. Nodes run out of memory. Sinks become unavailable. Schemas drift. For that reason, reliable pipeline design depends on more than correctness in the happy path. It depends on fault tolerance, retry logic, checkpointing, replay, and idempotency — the property that repeated execution does not corrupt downstream state by double-applying the same effect.
Idempotency is especially important because retries are unavoidable. A job may fail after writing some records but before reporting success. A stream consumer may process a message and then crash before committing its offset. A backfill may rerun a date range already partially loaded. If repeated execution creates duplicates, overwrites valid state, or applies corrections twice, the pipeline becomes a source of data corruption rather than reliability.
At an institutional level, this matters because pipeline-introduced errors are often subtle and cumulative. A pipeline that silently duplicates, drops, misorders, or partially reprocesses records can poison downstream analysis without obvious immediate failure. Reliability therefore includes both operational continuity and semantic trustworthiness.
Observability, lineage, and operational trust
Because pipelines span systems and time, they can be difficult to reason about once they are in production. For that reason, observability is essential. Operators need visibility into latency, throughput, lag, retries, failed tasks, watermark progression, backlog growth, output freshness, schema drift, quality-gate failures, and downstream write behavior. Without such visibility, the organization may not know whether its analytical or operational outputs are current, complete, or reliable.
Lineage also becomes central. A trustworthy pipeline should make it possible to determine where data came from, what transformations were applied, which intermediate stages it passed through, which rules failed, which runs produced outputs, and when those outputs were last refreshed. This is especially important in regulated, scientific, public-sector, or high-stakes analytical contexts where outputs may need to be defended or reconstructed after the fact.
Pipeline observability therefore links operational engineering to governance. It is not enough to know that jobs completed. Institutions increasingly need to know whether outputs remain intelligible, auditable, timely, and fit for decision-making.
Architectural patterns and platform choices
Different platforms emphasize different pipeline architectures. Beam and Dataflow emphasize unified dataflow computation across batch and streaming. Kafka and Kafka Streams emphasize distributed event streaming and stream-native processing. Airflow and similar orchestrators emphasize task scheduling, dependencies, retry behavior, and DAG-based operational control. Warehouse-native transformation tools emphasize modular SQL models, tests, lineage, and deployment close to analytical storage. Lakehouse and cloud-native platforms often combine storage, orchestration, processing, cataloging, and governance into layered estates.
No single platform defines the field. What matters architecturally is whether the system supports the right balance of latency, scale, state management, correctness, cost control, replayability, quality enforcement, and operational intelligibility. A pipeline for nightly regulatory reporting differs from a pipeline for real-time operational alerting, and both differ from a pipeline for training-data preparation, feature computation, or scientific telemetry.
For that reason, the design of pipelines and processing systems should be driven by workload semantics rather than tool fashion. The right question is not which platform is trendiest, but which architecture best matches the institution’s temporal, structural, reliability, and governance requirements.
A mathematical lens for data pipelines
A pipeline can be represented as a directed graph:
G = (V, E)
\]
Interpretation: The pipeline graph \(G\) consists of stages or tasks \(V\) and directed dependencies \(E\). A pipeline is trustworthy only when this graph is explicit enough to inspect, schedule, monitor, and recover.
A stage transforms an input dataset or stream into an output:
D_{k+1} = f_k(D_k, \theta_k)
\]
Interpretation: Stage \(k\) applies transformation \(f_k\) with parameters \(\theta_k\) to produce the next dataset or stream state. Versioning the function and parameters is part of reproducible pipeline design.
Pipeline latency can be represented as elapsed time from source availability to downstream output:
\ell_i = t_{\mathrm{output},i} – t_{\mathrm{source},i}
\]
Interpretation: Latency \(\ell_i\) measures how long record or event \(i\) takes to become available downstream. Acceptable latency depends on the use case.
A quality gate can be expressed as a thresholded rule pass rate:
P_g = \frac{N_{\mathrm{pass},g}}{N_{\mathrm{tested},g}} \ge \tau_g
\]
Interpretation: Quality gate \(g\) passes when the observed pass rate \(P_g\) meets threshold \(\tau_g\). Gates make implicit data assumptions executable.
Idempotent loading can be represented as stable repeated application:
L(L(D)) = L(D)
\]
Interpretation: A load function \(L\) is idempotent when rerunning the same input does not create duplicate or contradictory downstream state.
Pipeline reliability can be approximated through successful runs over attempted runs:
R_p = \frac{N_{\mathrm{successful\ runs}}}{N_{\mathrm{attempted\ runs}}}
\]
Interpretation: Reliability \(R_p\) is a coarse operational measure. It should be supplemented with failure severity, data quality impact, retry behavior, and downstream freshness.
A pipeline-readiness score can combine graph clarity, run health, quality gates, observability, lineage, backfill support, and idempotency:
Q_p = w_GG_p + w_RR_p + w_QQ_p + w_OO_p + w_LL_p + w_BB_p + w_II_p
\]
Interpretation: Pipeline readiness \(Q_p\) can combine graph clarity \(G_p\), run health \(R_p\), quality-gate strength \(Q_p\), observability \(O_p\), lineage \(L_p\), backfill support \(B_p\), and idempotency \(I_p\).
The point of this mathematical lens is not to reduce pipelines to one score. It is to make pipeline quality inspectable: graph structure, transformation logic, timing, quality gates, idempotency, reliability, and recovery capability should all be observable rather than assumed.
Python Workflow: Pipeline DAG, Observability, Backfill, and Readiness Scorecard
The following Python workflow demonstrates how a pipeline review can evaluate graph topology, stage status, run health, quality gates, observability metrics, lineage edges, backfill requests, idempotency checks, and pipeline-readiness scores.
#!/usr/bin/env python3
"""
Python Workflow: Pipeline DAG, Observability, Backfill,
and Readiness Scorecard

This compact example treats pipelines as operational evidence infrastructure:
graph topology, stages, runs, quality gates, observability, lineage,
backfills, idempotency, and readiness scoring.
"""

from __future__ import annotations

from collections import defaultdict, deque


def mean(values: list[float]) -> float:
    return sum(values) / len(values) if values else 0.0


def status_score(value: str) -> float:
    return {
        "approved": 1.0,
        "pass": 1.0,
        "success": 1.0,
        "success_with_warning": 0.72,
        "completed_with_warning": 0.72,
        "in_review": 0.65,
        "partial": 0.55,
        "warn": 0.40,
        "degraded": 0.25,
        "failed": 0.0,
    }.get(value, 0.5)


def topological_sort(stages: list[dict[str, str]]) -> dict[str, object]:
    nodes = {stage["stage"] for stage in stages}
    indegree = {node: 0 for node in nodes}
    adjacency: dict[str, list[str]] = defaultdict(list)

    for stage in stages:
        upstream = stage["upstream"]

        if upstream:
            adjacency[upstream].append(stage["stage"])
            indegree[stage["stage"]] += 1

    queue = deque(sorted([node for node, degree in indegree.items() if degree == 0]))
    order = []

    while queue:
        node = queue.popleft()
        order.append(node)

        for neighbor in sorted(adjacency[node]):
            indegree[neighbor] -= 1

            if indegree[neighbor] == 0:
                queue.append(neighbor)

    return {
        "topological_order": order,
        "is_acyclic": len(order) == len(nodes),
        "stage_count": len(nodes),
    }


def pipeline_readiness_score(
    graph_clarity: float,
    run_health: float,
    quality_gates: float,
    observability: float,
    lineage: float,
    backfill_support: float,
    idempotency: float,
) -> float:
    return round(
        0.14 * graph_clarity
        + 0.14 * run_health
        + 0.18 * quality_gates
        + 0.16 * observability
        + 0.14 * lineage
        + 0.12 * backfill_support
        + 0.12 * idempotency,
        3,
    )


def main() -> None:
    stages = [
        {"stage": "extract_crm", "upstream": "", "type": "ingestion", "status": "approved"},
        {"stage": "validate_crm", "upstream": "extract_crm", "type": "validation", "status": "approved"},
        {"stage": "transform_customer", "upstream": "validate_crm", "type": "transformation", "status": "approved"},
        {"stage": "load_customer_mart", "upstream": "transform_customer", "type": "serving", "status": "approved"},
        {"stage": "publish_dashboard", "upstream": "load_customer_mart", "type": "serving", "status": "approved"},
    ]

    topology = topological_sort(stages)
    print({"topology": topology})

    runs = [
        {"run_id": "run001", "input_rows": 10000, "output_rows": 9980, "failed_rows": 20, "retry_count": 0, "status": "success"},
        {"run_id": "run002", "input_rows": 10300, "output_rows": 10260, "failed_rows": 40, "retry_count": 1, "status": "success_with_warning"},
        {"run_id": "run003", "input_rows": 30000, "output_rows": 29950, "failed_rows": 50, "retry_count": 0, "status": "success"},
    ]

    run_health = mean([status_score(run["status"]) for run in runs])
    failure_rates = [
        run["failed_rows"] / run["input_rows"]
        for run in runs
    ]

    print({
        "run_health": round(run_health, 3),
        "mean_failure_rate": round(mean(failure_rates), 5),
        "total_retries": sum(run["retry_count"] for run in runs),
    })

    gates = [
        {"name": "email_not_null", "threshold": 0.99, "observed": 0.993, "status": "pass"},
        {"name": "valid_signup_date", "threshold": 1.00, "observed": 0.998, "status": "warn"},
        {"name": "unique_customer_key", "threshold": 0.999, "observed": 0.997, "status": "warn"},
        {"name": "status_mapping_coverage", "threshold": 1.00, "observed": 1.000, "status": "pass"},
    ]

    gate_scores = [
        min(1.0, gate["observed"] / gate["threshold"]) if gate["status"] == "pass"
        else max(0.0, min(1.0, gate["observed"] / gate["threshold"]) - 0.20)
        for gate in gates
    ]

    print({"quality_gate_score": round(mean(gate_scores), 3)})

    observability = {
        "latency_seconds": 480,
        "lag_seconds": 0,
        "error_rate": 0.002,
        "freshness_pass": True,
        "lineage_complete": True,
    }

    observability_score = 1.0
    if observability["latency_seconds"] > 900:
        observability_score -= 0.15
    if observability["lag_seconds"] > 60:
        observability_score -= 0.20
    if observability["error_rate"] > 0.005:
        observability_score -= 0.20
    if not observability["freshness_pass"]:
        observability_score -= 0.15

    idempotency_checks = [
        {"stage": "load_customer_mart", "first_output_rows": 29950, "second_output_rows": 29950, "duplicate_effect_count": 0},
        {"stage": "windowed_aggregates", "first_output_rows": 41920, "second_output_rows": 41920, "duplicate_effect_count": 0},
    ]

    idempotency_score = mean([
        1.0 if check["first_output_rows"] == check["second_output_rows"] and check["duplicate_effect_count"] == 0 else 0.4
        for check in idempotency_checks
    ])

    print({
        "observability_score": round(observability_score, 3),
        "idempotency_score": round(idempotency_score, 3),
    })

    print({
        "pipeline_readiness_score": pipeline_readiness_score(
            graph_clarity=1.0 if topology["is_acyclic"] else 0.0,
            run_health=run_health,
            quality_gates=mean(gate_scores),
            observability=observability_score,
            lineage=1.0 if observability["lineage_complete"] else 0.5,
            backfill_support=0.90,
            idempotency=idempotency_score,
        )
    })


if __name__ == "__main__":
    main()
This workflow treats pipelines as evidence-producing systems. It does not only list stages. It evaluates topology, runs, gates, observability, lineage, replay/backfill readiness, and idempotent rerun behavior.
R Workflow: Pipeline Runs, Quality Gates, Observability, Lineage, and Readiness Summary
The following R workflow summarizes pipeline run health, quality gates, observability metrics, lineage status, backfill requests, and idempotency checks.
#!/usr/bin/env Rscript

# R Workflow: Pipeline Runs, Quality Gates, Observability,
# Lineage, and Readiness Summary

runs <- data.frame(
  pipeline_name = c(
    "customer_metrics_pipeline",
    "customer_metrics_pipeline",
    "customer_metrics_pipeline",
    "event_monitoring_pipeline",
    "event_monitoring_pipeline"
  ),
  run_mode = c("batch", "batch", "backfill", "stream", "stream"),
  input_rows = c(10000, 10300, 30000, 42000, 45000),
  output_rows = c(9980, 10260, 29950, 41920, 44750),
  failed_rows = c(20, 40, 50, 80, 250),
  retry_count = c(0, 1, 0, 2, 3),
  status = c(
    "success",
    "success_with_warning",
    "success",
    "success_with_warning",
    "degraded"
  ),
  stringsAsFactors = FALSE
)

runs$failure_rate <- runs$failed_rows / runs$input_rows

run_summary <- aggregate(
  cbind(input_rows, output_rows, failed_rows, retry_count, failure_rate) ~ pipeline_name + run_mode + status,
  data = runs,
  FUN = mean
)

gates <- data.frame(
  pipeline_name = c(
    "customer_metrics_pipeline",
    "customer_metrics_pipeline",
    "customer_metrics_pipeline",
    "event_monitoring_pipeline",
    "event_monitoring_pipeline"
  ),
  stage_name = c(
    "validate_crm",
    "validate_crm",
    "transform_customer",
    "validate_events",
    "windowed_aggregates"
  ),
  dimension = c("completeness", "validity", "consistency", "validity", "correctness"),
  rule_name = c(
    "email_not_null",
    "valid_signup_date",
    "status_mapping_coverage",
    "event_schema_conformance",
    "idempotent_window_update"
  ),
  threshold = c(0.99, 1.00, 1.00, 0.995, 1.00),
  observed_value = c(0.993, 0.998, 1.000, 0.996, 0.990),
  status = c("pass", "warn", "pass", "pass", "warn"),
  stringsAsFactors = FALSE
)

gates$gap_to_threshold <- gates$threshold - gates$observed_value

gate_summary <- aggregate(
  cbind(threshold, observed_value, gap_to_threshold) ~ pipeline_name + dimension + status,
  data = gates,
  FUN = mean
)

observability <- data.frame(
  pipeline_name = c(
    "customer_metrics_pipeline",
    "event_monitoring_pipeline",
    "event_monitoring_pipeline"
  ),
  throughput_rows_per_sec = c(1250, 140, 110),
  latency_seconds = c(480, 8, 16),
  lag_seconds = c(0, 22, 90),
  error_rate = c(0.002, 0.0019, 0.0068),
  watermark_lag_seconds = c(0, 18, 70),
  backpressure_ms = c(0, 30, 115),
  status = c("pass", "pass", "warn"),
  stringsAsFactors = FALSE
)

observability_summary <- aggregate(
  cbind(throughput_rows_per_sec, latency_seconds, lag_seconds, error_rate, watermark_lag_seconds, backpressure_ms) ~ pipeline_name + status,
  data = observability,
  FUN = mean
)

lineage <- data.frame(
  pipeline_name = c(
    "customer_metrics_pipeline",
    "customer_metrics_pipeline",
    "event_monitoring_pipeline",
    "event_monitoring_pipeline"
  ),
  edge_type = c("validation", "transformation", "validation", "stateful_processing"),
  records_moved = c(10000, 9980, 42000, 41920),
  lineage_status = c("complete", "complete", "complete", "partial"),
  stringsAsFactors = FALSE
)

lineage_summary <- aggregate(
  records_moved ~ pipeline_name + edge_type + lineage_status,
  data = lineage,
  FUN = sum
)

backfills <- data.frame(
  pipeline_name = c(
    "customer_metrics_pipeline",
    "event_monitoring_pipeline",
    "customer_metrics_pipeline"
  ),
  reason = c("recompute_after_mapping_fix", "replay_after_sink_failure", "late_arriving_records"),
  expected_rows = c(30000, 87000, 500),
  status = c("completed", "completed_with_warning", "pending"),
  stringsAsFactors = FALSE
)

backfill_summary <- aggregate(
  expected_rows ~ pipeline_name + status,
  data = backfills,
  FUN = sum
)

idempotency <- data.frame(
  pipeline_name = c(
    "customer_metrics_pipeline",
    "event_monitoring_pipeline",
    "event_monitoring_pipeline"
  ),
  stage_name = c("load_customer_mart", "write_alerts", "windowed_aggregates"),
  duplicate_effect_count = c(0, 40, 0),
  status = c("pass", "warn", "pass"),
  stringsAsFactors = FALSE
)

idempotency_summary <- aggregate(
  duplicate_effect_count ~ pipeline_name + stage_name + status,
  data = idempotency,
  FUN = sum
)

dir.create("outputs", showWarnings = FALSE, recursive = TRUE)

write.csv(run_summary, "outputs/pipeline_run_summary_r.csv", row.names = FALSE)
write.csv(gate_summary, "outputs/quality_gate_summary_r.csv", row.names = FALSE)
write.csv(observability_summary, "outputs/observability_summary_r.csv", row.names = FALSE)
write.csv(lineage_summary, "outputs/lineage_summary_r.csv", row.names = FALSE)
write.csv(backfill_summary, "outputs/backfill_summary_r.csv", row.names = FALSE)
write.csv(idempotency_summary, "outputs/idempotency_summary_r.csv", row.names = FALSE)

cat("Wrote pipeline run, gate, observability, lineage, backfill, and idempotency summaries.\n")
This workflow treats pipeline health as multidimensional. Run success matters, but so do quality gates, observability, lineage, backfill support, and idempotent behavior under rerun or replay.
Applications across domains
Data pipelines and processing systems underpin a vast range of contemporary activities. Businesses use them to populate warehouses, synchronize systems, update dashboards, deliver metrics, and support self-service analytics. Digital platforms use them for clickstream analysis, recommendation inputs, experimentation metrics, personalization, content ranking, fraud detection, and real-time monitoring. Scientific and environmental systems use them to ingest telemetry, sensor data, experimental outputs, simulation results, and observational records. Financial systems use them for reporting, reconciliation, anomaly detection, risk monitoring, and compliance. Public and infrastructure systems use them to integrate administrative records, event data, service indicators, and operational telemetry over time.
In AI and machine-learning environments, pipelines prepare training datasets, feature tables, labels, evaluation slices, drift-monitoring records, and model outputs. In operational systems, they deliver alerts, status updates, and current-state views. In governance environments, they provide audit trails, lineage, and reproducible refresh histories.
Across all these contexts, the underlying architectural challenge is the same: how to move from raw, dispersed, and temporally uneven data toward usable downstream state without losing correctness, observability, or institutional trust. Data pipelines are the operational answer to that challenge.
Implementation principles for high-integrity pipelines
Represent the pipeline as a graph. Stages, dependencies, inputs, outputs, and critical paths should be explicit.
Match processing mode to workload semantics. Batch, streaming, micro-batch, replay, and backfill should be chosen according to timing, state, correctness, and cost requirements.
Separate processing logic from orchestration. Transformation logic and execution scheduling are related but distinct responsibilities.
Enforce quality gates before promotion. Downstream outputs should not become trusted merely because a job completed.
Design for idempotency. Retries, reruns, and backfills should not create duplicate or contradictory state.
Preserve replayable inputs. Raw extracts, event logs, source batches, and code versions should support reconstruction.
Monitor operational and semantic health. Throughput, latency, lag, freshness, error rate, schema drift, quality failures, and lineage completeness all matter.
Record lineage across stages. Users should be able to trace outputs back through sources, transforms, checks, and execution runs.
Make backfills governed events. Historical recomputation should have reasons, owners, ranges, expected rows, and validation results.
Treat pipeline failures as evidence incidents. A failed or degraded pipeline is not only a technical problem; it can affect institutional truth claims.
| Control | Purpose | Failure it prevents |
|---|---|---|
| Pipeline graph | Makes stages and dependencies visible | Hidden execution order and weak impact analysis |
| Quality gates | Tests data before downstream promotion | Invalid records becoming trusted outputs |
| Orchestration metadata | Records schedules, dependencies, run status, retries, and failures | Unreliable execution and hard-to-debug refresh behavior |
| Idempotency checks | Verifies safe reruns and retries | Duplicate records, double writes, and corrupted state |
| Replay and backfill records | Supports historical reconstruction under changed logic | Manual patching and unreproducible corrections |
| Observability metrics | Tracks throughput, latency, lag, errors, freshness, and backpressure | Silent degradation in apparently live systems |
| Lineage edges | Connects outputs to upstream stages and transformations | Black-box analytical outputs with weak auditability |
| Delivery semantics review | Clarifies loss, duplication, retry, and exactly-once claims | Misplaced trust in component-level guarantees |
GitHub Repository
This article can be paired with a companion code workflow that models data pipelines and processing systems as operational evidence infrastructure. The example includes pipeline stages, run records, quality gates, observability metrics, lineage edges, backfill requests, idempotency checks, DAG topology, SQL schemas, Python and R workflows, Julia scoring, typed contracts, Quarto report templates, and multi-language examples across Python, R, Julia, SQL, Go, Rust, C, C++, TypeScript, and Terraform placeholders.
Conclusion
Data pipelines and data processing systems are the operational machinery through which dispersed data becomes usable downstream state. They ingest records, validate quality, transform meaning, maintain state, refresh outputs, route events, support backfills, and make analytical systems current enough to matter. But their significance is not merely mechanical. Pipelines define how data is operationalized over time.
The deeper point is that pipelines are evidence systems. They determine what enters the record, what is excluded, what is repaired, what is transformed, what is refreshed, what is replayable, and what downstream users can trust. In mature data systems, pipeline design is therefore inseparable from governance, observability, lineage, reliability, and reproducibility. A pipeline is not just a path from source to sink. It is an institutional process for turning data movement into defensible analytical and operational truth.
Related articles
- Data Systems & Analytics
- ETL and Data Transformation Systems
- Streaming Data and Real-Time Analytics
- Distributed Data Systems
- Data Cleaning and Data Quality Management
- Data Quality Metrics and Observability
- Metadata, Data Catalogs, and Lineage
- Reproducible Analytics and Versioned Data Workflows
Further reading
- Akidau, T., Chernyak, S. and Lax, R. (2018) Streaming Systems. Sebastopol, CA: O’Reilly Media.
- Kleppmann, M. (2017) Designing Data-Intensive Applications. Sebastopol, CA: O’Reilly Media.
- Kreps, J. (2014) I Heart Logs: Event Data, Stream Processing, and Data Integration. Sebastopol, CA: O’Reilly Media.
- Reis, J. and Housley, M. (2022) Fundamentals of Data Engineering. Sebastopol, CA: O’Reilly Media.
- Vassiliadis, P., Simitsis, A. and Skiadopoulos, S. (2009) ‘A survey of extract-transform-load technology’, International Journal of Data Warehousing and Mining, 5(3), pp. 1–27.
References
- Akidau, T. et al. (2015) The Dataflow Model: A Practical Approach to Balancing Correctness, Latency, and Cost in Massive-Scale, Unbounded, Out-of-Order Data Processing. Available at: https://research.google.com/pubs/archive/43864.pdf
- Apache Airflow (2026) DAGs. Available at: https://airflow.apache.org/docs/apache-airflow/stable/core-concepts/dags.html
- Apache Airflow (2026) Architecture Overview. Available at: https://airflow.apache.org/docs/apache-airflow/stable/core-concepts/overview.html
- Apache Beam (n.d.) Basics of the Beam model. Available at: https://beam.apache.org/documentation/basics/
- Apache Beam (n.d.) Programming Guide. Available at: https://beam.apache.org/documentation/programming-guide/
- Apache Beam (n.d.) Design Your Pipeline. Available at: https://beam.apache.org/documentation/pipelines/design-your-pipeline/
- Apache Kafka (2026) Introduction. Available at: https://kafka.apache.org/intro/
- Apache Kafka (2026) Documentation. Available at: https://kafka.apache.org/documentation/
- Apache Kafka (2026) Kafka Streams. Available at: https://kafka.apache.org/documentation/streams/
- Kleppmann, M. (2016) Making Sense of Stream Processing. Available at: https://martin.kleppmann.com/papers/stream-processing.pdf