Metadata, Data Catalogs, and Lineage in Modern Data Systems
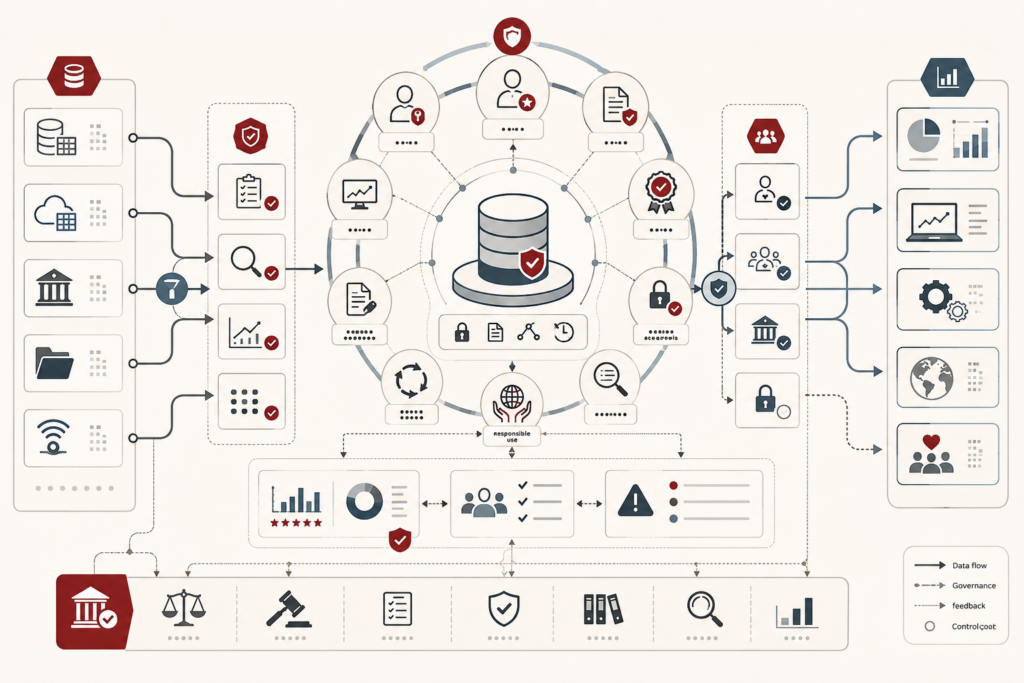
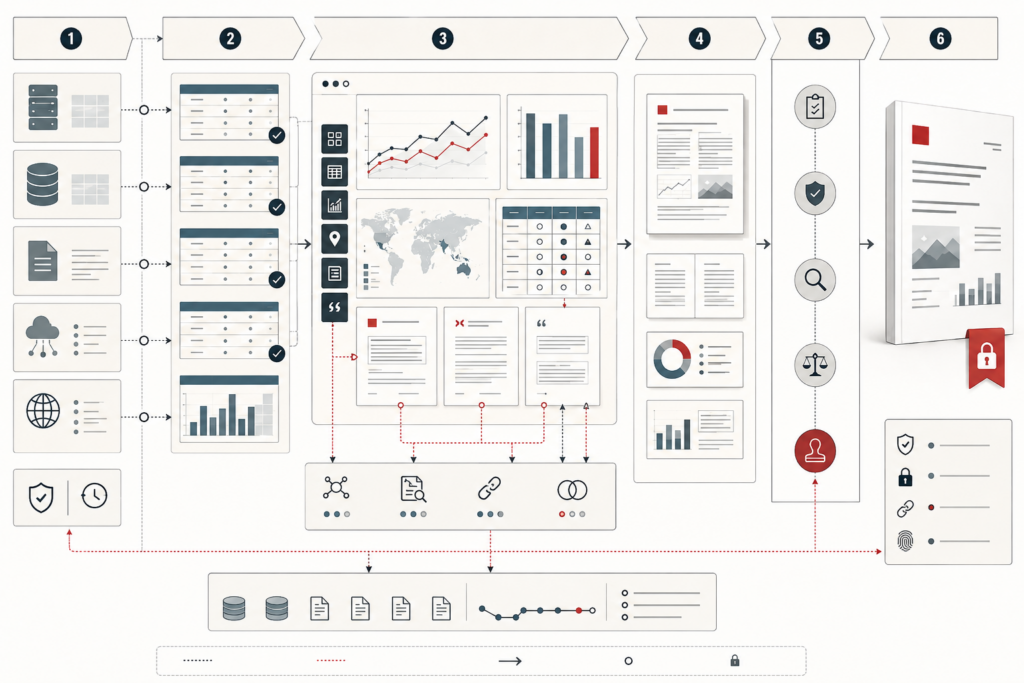
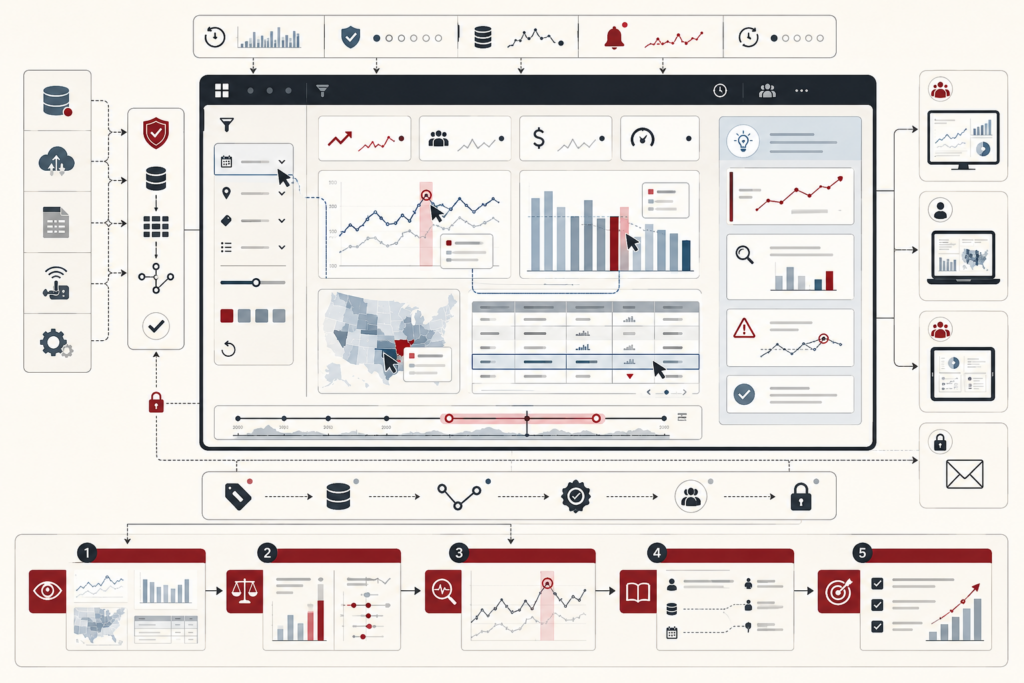
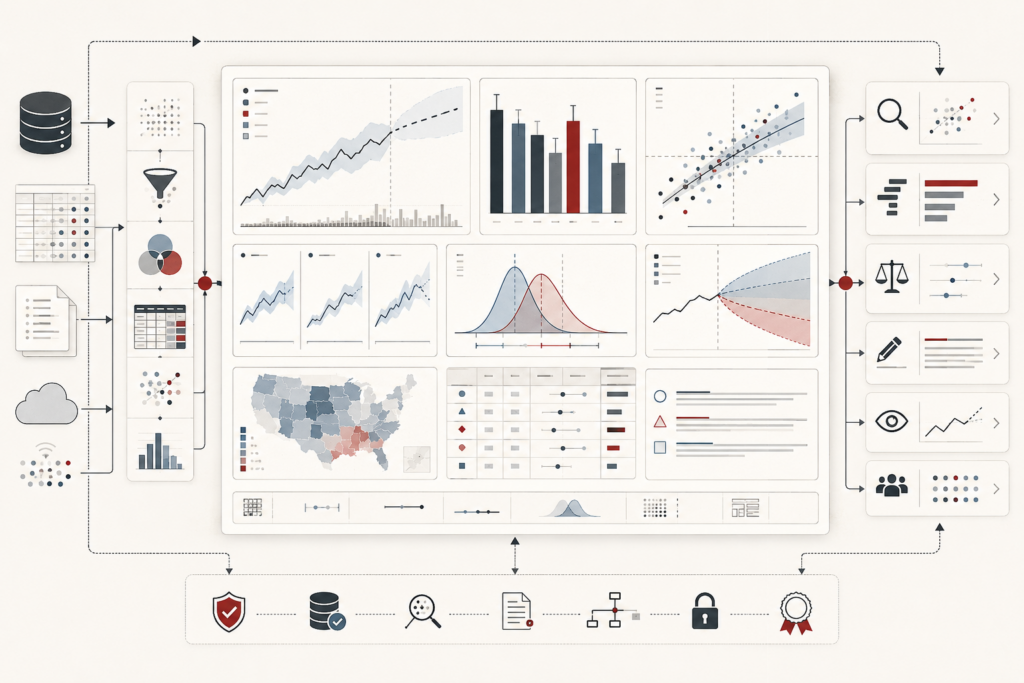
Metadata, data catalogs, and lineage make modern data systems legible, governable, and trustworthy. This article frames metadata not as passive documentation, but as epistemic infrastructure: the descriptive, semantic, operational, policy, and provenance layer that allows data assets to be interpreted, evaluated, reused, audited, and challenged. It explains how catalogs turn fragmented data estates into navigable knowledge environments, while lineage traces how datasets, transformations, dashboards, models, and analytical claims are produced over time. The article also examines metadata standards, controlled vocabularies, taxonomies, ontologies, active metadata, provenance, observability, data contracts, governance, AI readiness, and metadata decay. A mathematical lens and Python/R workflows show how teams can evaluate metadata trust, catalog visibility, lineage depth, evidence gaps, policy coverage, and provenance completeness.