Descriptive Analytics and Data Exploration: Distributions, Patterns, and Analytical Insight
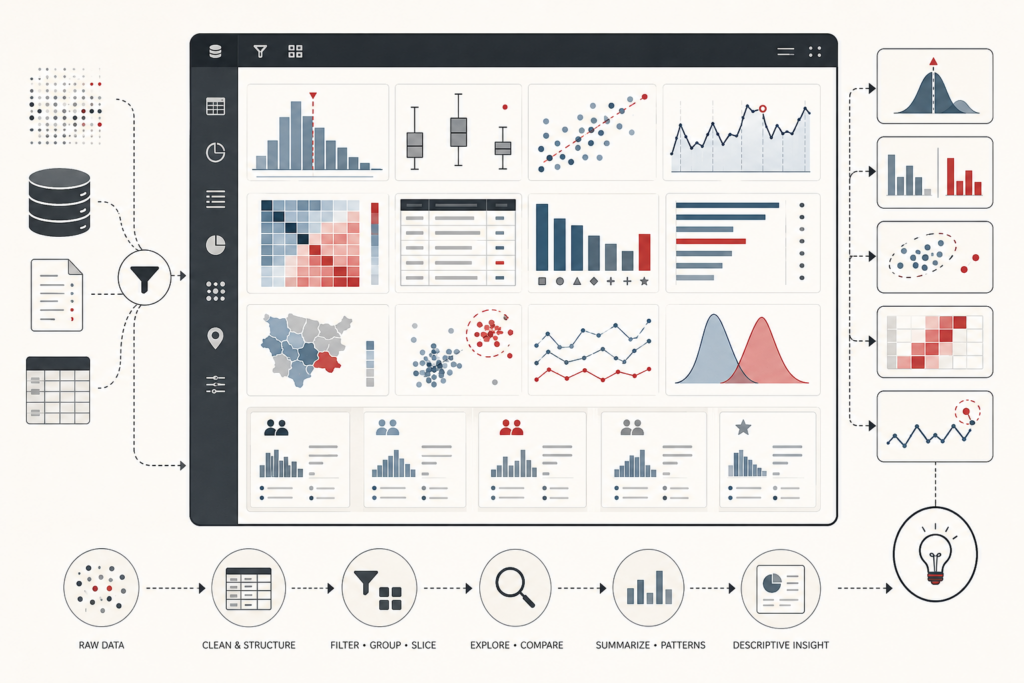
Descriptive analytics and data exploration make data legible before stronger analytical claims are built on top of it. This article frames EDA as analytical grounding: the disciplined process of profiling variables, summarizing distributions, inspecting missingness, identifying outliers, comparing subgroups, detecting aggregation risks, exploring relationships, and generating better questions. It explains why averages, dashboards, and summary tables are not enough when data is skewed, incomplete, heterogeneous, or shaped by hidden subgroup differences. The article also examines profiling, descriptive reporting, exploratory analysis, univariate/bivariate/multivariate exploration, visualization, distributional thinking, missingness, anomaly review, subgroup masking, and the limits of descriptive analytics. Mathematical examples and Python/R workflows show how teams can evaluate numeric profiles, categorical balance, missingness patterns, subgroup summaries, bivariate relationships, aggregation risk, outlier flags, and exploration-readiness scores.