Author name: Tariq Ahmad

Painterly illustration of business cycles, showing economic expansion, recession, factories, cities, shuttered storefronts, public institutions, policy meetings, workers, households, and cyclical economic pathways.

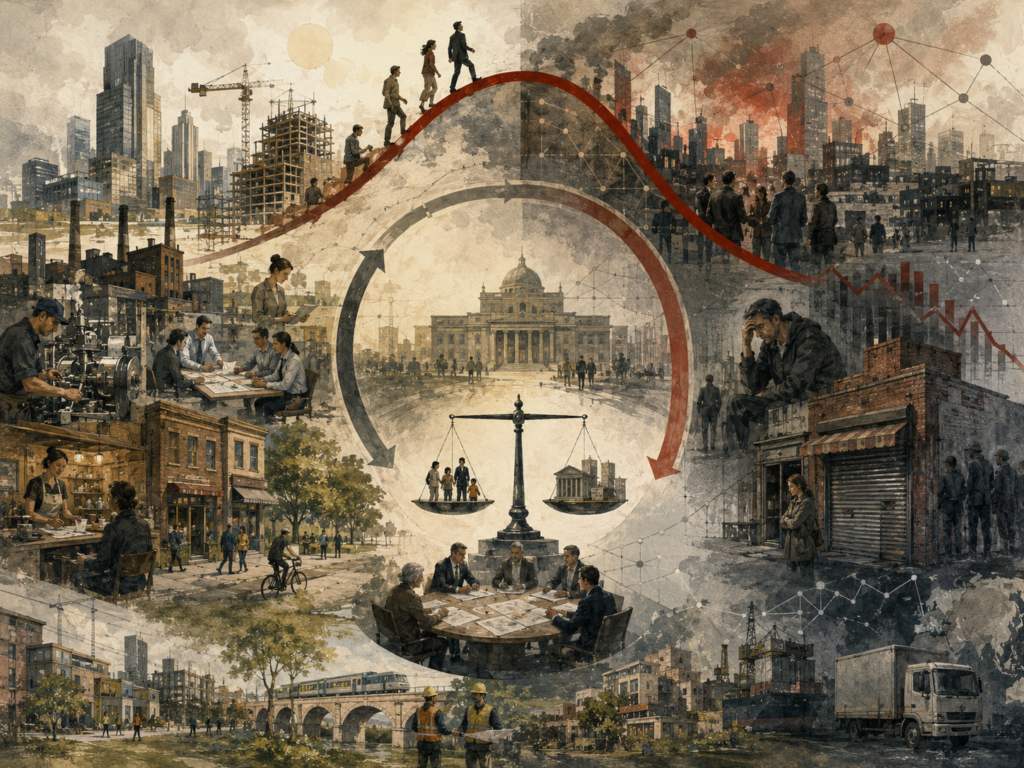
Business Cycles: Economic Expansions, Recessions, and Macroeconomic Stability

Business cycles describe the recurring movement of economies through expansion, peak, recession, trough, and recovery. This article explains why economic growth rarely follows a smooth path, how short-run fluctuations differ from long-run development, and why downturns can spread through employment, income, credit, investment, production, and public confidence. It examines demand shocks, supply disruptions, expectations, financial cycles, business-cycle dating, stabilization policy, monetary policy, fiscal policy, and economic resilience. By connecting macroeconomic theory with Python, R, Stata, SQL, and Julia research workflows, the article frames business cycles as both measurable economic patterns and institutional stress tests. A resilient economy is not one that avoids every downturn, but one that can absorb shocks, protect households, stabilize demand, preserve productive capacity, and support broad-based recovery.

Painterly illustration of economic resilience, showing a divided economic landscape with recession, unemployment, shuttered businesses, broken supply chains, public institutions, rebuilding, worker cooperation, and gradual recovery.

Economic Resilience: Why Recessions Occur and How Economies Recover

Economic resilience explains why recessions occur, why economies can contract even when productive capacity remains intact, and how recovery depends on institutions capable of stabilizing demand, employment, credit, and public confidence. This article examines recessions through Keynesian macroeconomics, aggregate demand, involuntary unemployment, expectations, financial fragility, automatic stabilizers, monetary policy, fiscal policy, and recovery quality. It frames downturns not only as declines in GDP, but as social and institutional stress events that affect workers, households, firms, communities, and public systems unevenly. By connecting recession theory with Python, R, Stata, SQL, and Julia companion workflows, the article introduces economic resilience as both a macroeconomic concept and a practical research framework for measuring shocks, recovery paths, output gaps, unemployment dynamics, and the institutional foundations of durable economic stability.

Raspberry Pi environmental data hub with climate and air quality sensors collecting local environmental data to support UN Sustainable Development Goal 13 Climate Action.

Building a Raspberry Pi Environmental Data Hub for Climate Monitoring (SDG 13: Climate Action)

A Raspberry Pi environmental data hub demonstrates how edge computing and low-cost sensing can support local climate monitoring, urban resilience, and SDG-aligned environmental intelligence. This project combines a Raspberry Pi with sensors such as the BME280 and optional particulate monitors to collect temperature, humidity, pressure, and air-quality data, store observations locally, and optionally integrate with broader climate datasets. While the prototype is not a certified scientific or regulatory monitoring station, it shows how distributed sensing can expand environmental visibility at neighborhood, classroom, field-lab, and community scales. The article connects the build to environmental monitoring systems, intelligent infrastructure, climate change as a planetary boundary, atmospheric aerosol risk, and sustainable development, showing how local data infrastructure can support better climate adaptation, public awareness, and environmental decision-making.

Raspberry Pi urban air quality and heat island monitoring station measuring PM2.5 pollution and temperature to support SDG 11 Sustainable Cities and SDG 13 Climate Action.

Urban Air Quality and Heat Island Monitor (SDG 11 / SDG 13)

A Raspberry Pi urban air quality monitor demonstrates how edge computing and low-cost environmental sensing can support neighborhood-scale climate adaptation, pollution awareness, and SDG 11: Sustainable Cities and Communities. This project combines a Raspberry Pi with a BME280 atmospheric sensor and PMS5003 particulate matter sensor to measure temperature, humidity, pressure, PM1.0, PM2.5, and PM10 while storing observations for later analysis. While the prototype is not a certified regulatory air-quality station, it shows how distributed monitoring can make urban heat islands, particulate pollution, and uneven environmental exposure more visible. The article connects the build to environmental monitoring systems, intelligent infrastructure, atmospheric aerosol risk, climate change, planetary boundaries, and sustainable development, showing how local data infrastructure can support healthier, more resilient cities.

Raspberry Pi water quality monitoring station measuring pH and turbidity in a river to support SDG 6 Clean Water and Sanitation.

Smart Water Quality Monitoring Network with Raspberry Pi (SDG 6 – Clean Water and Sanitation)

A Raspberry Pi water quality monitoring system demonstrates how low-cost sensing, local logging, and edge computing can support freshwater stewardship, watershed monitoring, and SDG 6: Clean Water and Sanitation. This project combines a Raspberry Pi with sensors for pH, turbidity, and water temperature, using an ADS1115 analog-to-digital converter to collect readings that can be stored locally, exported to dashboards, or extended with anomaly detection. While the prototype is not a certified water-quality instrument or substitute for laboratory testing, it shows how distributed monitoring can make freshwater conditions more visible over time. The article connects the build to environmental monitoring systems, intelligent infrastructure, freshwater change, biogeochemical flows, planetary boundaries, and sustainable development, showing how practical data infrastructure can support better water governance and environmental decision-making.

Raspberry Pi solar microgrid monitoring system measuring photovoltaic power generation and battery performance to support SDG 7 Affordable and Clean Energy.

Raspberry Pi Solar Microgrid Monitoring System (SDG 7: Affordable and Clean Energy)

A Raspberry Pi solar microgrid monitoring system demonstrates how edge computing, power sensing, and local data logging can support renewable energy visibility, community resilience, and SDG 7: Affordable and Clean Energy. This project combines a Raspberry Pi with an INA219 current and voltage sensor to measure solar-panel output, battery-related electrical conditions, instantaneous power, and logged energy trends. While the prototype is not a certified utility metering system or industrial energy-management platform, it shows how distributed monitoring can make renewable energy systems more observable, reliable, and maintainable. The article connects the build to intelligent infrastructure, environmental monitoring systems, climate change as a planetary boundary, planetary boundaries, and sustainable development, showing how practical data infrastructure can help communities understand clean-energy production, storage, load behavior, and microgrid resilience.

Raspberry Pi flood and river monitoring system measuring water levels and rainfall to support SDG 6 Clean Water and SDG 13 Climate Action.

Raspberry Pi Flood & River Monitoring Network (SDG 6 / SDG 13)

A Raspberry Pi flood monitoring system demonstrates how low-cost hydrological sensing, local logging, and edge computing can support flood resilience, watershed awareness, and SDG 6: Clean Water and Sanitation alongside SDG 13: Climate Action. This project combines a Raspberry Pi with water-level sensing, rainfall monitoring, atmospheric data, SQLite storage, and threshold-based alert logic to detect emerging flood-risk conditions. While the prototype is not a certified public warning system or substitute for official hydrological infrastructure, it shows how distributed monitoring can make river levels, rainfall intensity, and rate-of-rise patterns more visible. The article connects the build to environmental monitoring systems, intelligent infrastructure, freshwater change, climate adaptation, planetary boundaries, and sustainable development, showing how practical data infrastructure can support earlier observation, better preparedness, and more resilient communities.

Raspberry Pi climate early warning system monitoring rainfall, atmospheric pressure, temperature, and river levels to detect extreme weather risks aligned with SDG 13 Climate Action.

Raspberry Pi Climate Early Warning System (SDG 13 – Climate Action)

A Raspberry Pi climate early warning system demonstrates how low-cost environmental sensing, local logging, and edge computing can support climate resilience, disaster preparedness, and SDG 13: Climate Action. This project combines a Raspberry Pi with sensors for temperature, humidity, atmospheric pressure, rainfall, and water levels to detect emerging hazards such as floods, storms, heat stress, and compound climate risks. While the prototype is not a certified public warning network or substitute for official emergency systems, it shows how distributed monitoring can make local environmental change more visible before hazards escalate. The article connects the build to environmental monitoring systems, intelligent infrastructure, climate change as a planetary boundary, freshwater risk, planetary boundaries, and sustainable development, showing how practical data infrastructure can support earlier observation, better preparedness, and more resilient communities.

Raspberry Pi biodiversity camera trap with edge AI monitoring wildlife activity to support SDG 15 Life on Land.

Biodiversity Camera Trap with Edge AI (SDG 15 – Life on Land)

A Raspberry Pi biodiversity camera trap with edge AI demonstrates how low-cost sensing, motion-triggered imaging, metadata logging, and local computer vision can support ecological monitoring and SDG 15: Life on Land. This project combines a Raspberry Pi, camera module, PIR motion sensor, local storage, SQLite observation logging, and optional TensorFlow Lite inference to capture wildlife activity and prioritize biodiversity observations for review. While the prototype is not a certified field research instrument or substitute for formal ecological surveys, it shows how distributed monitoring can make species presence, habitat use, and ecosystem change more visible over time. The article connects the build to environmental monitoring systems, intelligent infrastructure, biosphere integrity, land-system change, climate resilience, planetary boundaries, and sustainable development, showing how practical edge-computing infrastructure can support conservation-oriented observation and more responsible biodiversity data collection.

Scroll to Top