
Last Updated May 29, 2026
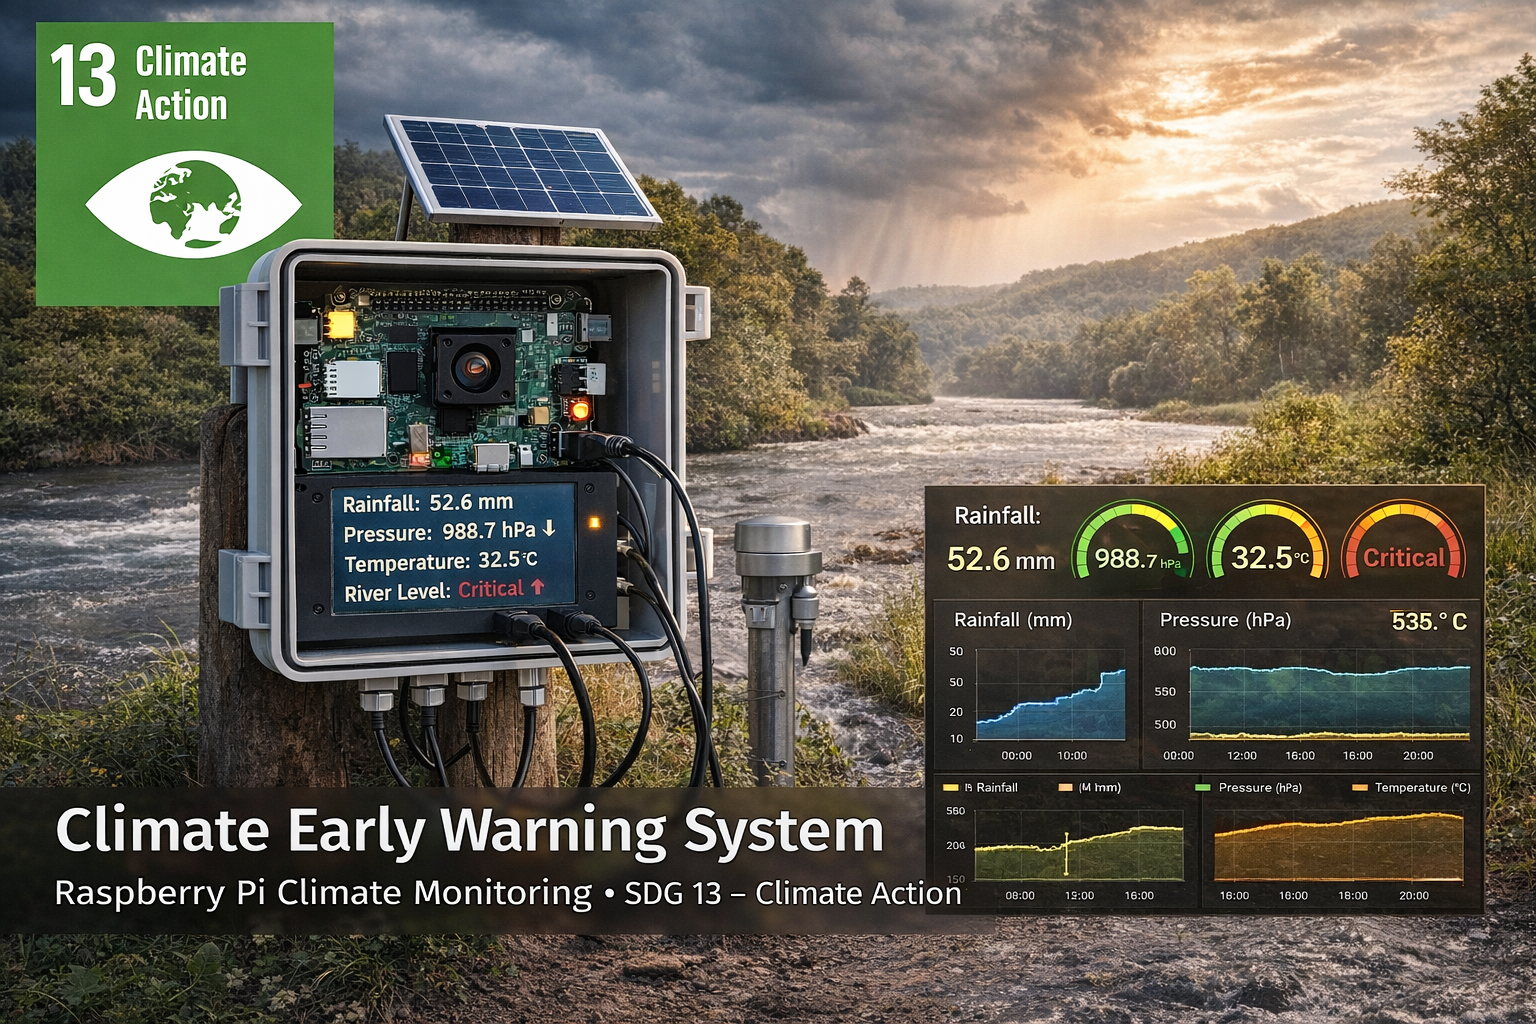
Environmental monitoring systems are essential for climate resilience. A Raspberry Pi climate early warning system can monitor environmental conditions such as rainfall, atmospheric pressure, temperature, humidity, and river levels to detect emerging climate risks and support earlier disaster response aligned with SDG 13: Climate Action and SDG 11: Sustainable Cities and Communities.
Extreme weather events can develop rapidly and overwhelm communities that lack reliable environmental monitoring infrastructure. Floods, storms, heatwaves, droughts, wildfire-smoke episodes, compound hazards, and infrastructure disruptions often emerge through measurable changes before impacts fully materialize. Rainfall accumulates, atmospheric pressure shifts, river levels rise, heat builds, soil dries, humidity intensifies, and local infrastructure begins to strain.
This project demonstrates how to build a Raspberry Pi-based climate early warning system capable of collecting environmental sensor data, analyzing local conditions, logging observations, and supporting threshold-based risk detection. While simple, the design reflects a broader sustainability principle: disaster resilience improves when environmental conditions can be measured continuously, interpreted early, and communicated responsibly.
The project should not be treated as an official weather station, certified public-warning system, emergency alert network, hydrological forecast model, heat-health warning platform, or substitute for government weather, flood, and disaster-warning services. Its purpose is educational and methodological: to show how sensing, edge computing, local logging, threshold design, alert logic, validation, and public-safety limits can work together in a climate-risk monitoring workflow.
Main Library
Publications
Project Series
Raspberry Pi Projects
Related Topic
Environmental Monitoring
Related Topic
Climate Boundary
Related Topic
Freshwater Risk
This project also connects to broader site areas, including Environmental Monitoring Systems, Intelligent Infrastructure Systems, Climate Change as a Planetary Boundary, Freshwater Change and Earth System Risk, Sustainable Development Goals Within Planetary Boundaries, and Planetary Boundaries. In that wider context, this Raspberry Pi early warning system is not only a maker project. It is a small prototype of the sensing, edge-computing, alerting, and data infrastructure needed for climate adaptation and disaster-risk reduction.
Abstract
This project presents a prototype Raspberry Pi climate early warning system built around environmental sensing, local data logging, threshold-based alert logic, and optional distributed network integration. The platform collects atmospheric and hydrological observations such as temperature, humidity, pressure, rainfall, and water-level data in order to identify conditions associated with emerging climate risk.
From an engineering perspective, the build demonstrates a compact edge-monitoring node for climate hazard observation and alerting. From a sustainability perspective, it illustrates how distributed low-cost monitoring can strengthen climate adaptation and disaster preparedness by making environmental shifts visible before hazards escalate.
The system is intentionally limited. It is not a certified public warning network, official forecast model, emergency alert platform, or substitute for government weather, flood, heat, and disaster-warning services. Its value is educational and methodological: it shows how local environmental observations can be transformed into risk signals while preserving uncertainty, validation needs, escalation boundaries, and public-safety limits.
SDG Alignment: Climate Action, Sustainable Cities, Public Health, Water Resilience, and Infrastructure
This project aligns most directly with SDG 13: Climate Action, which emphasizes strengthening resilience and adaptive capacity to climate-related hazards. Climate early warning systems support that goal by converting environmental observations into earlier awareness of hazardous conditions.
It also connects strongly to SDG 11: Sustainable Cities and Communities, SDG 9: Industry, Innovation and Infrastructure, SDG 6: Clean Water and Sanitation, and SDG 3: Good Health and Well-Being. Flooding, heatwaves, storm conditions, drought, air-quality changes, and infrastructure stress are climate-related risks with direct effects on communities, water systems, and public health.
| Sustainable Development Goal | How the Project Relates | Project-Level Mechanism |
|---|---|---|
| SDG 13: Climate Action | Supports resilience and adaptive capacity by making climate-related hazard signals visible earlier. | Temperature, humidity, pressure, rainfall, water-level, and alert-state monitoring. |
| SDG 11: Sustainable Cities and Communities | Supports disaster preparedness, local resilience infrastructure, neighborhood hazard awareness, and infrastructure monitoring. | Local risk detection for heat, flooding, storms, drainage stress, and compound urban hazards. |
| SDG 9: Industry, Innovation and Infrastructure | Demonstrates distributed environmental sensing, edge analytics, local logging, and resilient data infrastructure. | Raspberry Pi node with sensor interfaces, SQLite logging, alert logic, and optional network integration. |
| SDG 6: Clean Water and Sanitation | Connects to flood monitoring, rainfall observation, watershed data, drainage stress, and freshwater-risk visibility. | Rain gauges, water-level sensors, rise-rate analysis, and hydrological threshold logic. |
| SDG 3: Good Health and Well-Being | Relates to heatwaves, flooding, extreme weather, air-quality shifts, and emergency preparedness effects on human health. | Heat-risk classification, environmental alerts, and local hazard-awareness signals. |
The strongest SDG connection is SDG 13. Climate action includes mitigation, but it also includes adaptation: preparing communities for hazards already intensified by climate variability and long-term warming. Early warning infrastructure is one of the most practical adaptation tools because it creates time for response.
The connection to SDG 11 is especially important in cities and towns where heat, flooding, stormwater, vulnerable housing, aging infrastructure, and limited tree canopy can intensify local risk. A local monitoring node can help make site-specific conditions visible, although public warnings must still rely on official systems.
The connection to SDG 6 appears through flooding, rainfall, stormwater, runoff, river-level change, soil saturation, and drainage infrastructure. Water-related hazards are among the most direct ways climate risk becomes visible in daily life.
The connection to SDG 3 should be framed carefully. Heat and flooding have public-health consequences, but a prototype should not issue medical, evacuation, or official safety instructions. It can support local awareness, education, and environmental screening while pointing users toward official alerts and emergency guidance.
Because the Sustainable Development Goals are broad public frameworks, it is important not to overclaim. This project is not a public warning service, not a certified meteorological system, and not a disaster-management authority. Its contribution is narrower and still meaningful: it teaches the measurement architecture behind local climate-risk awareness.
Connections to Other Site Areas
This Raspberry Pi climate early warning system belongs to a wider body of work on environmental sensing, climate adaptation, and intelligent infrastructure. It connects directly to Environmental Monitoring Systems, where field sensors, weather stations, river gauges, air-quality monitors, and environmental telemetry become tools for understanding climate and ecological risk.
It also connects to Intelligent Infrastructure Systems. Climate early warning systems become more useful when sensing nodes can collect observations, store time-series records, detect threshold crossings, issue alert states, and support dashboard-based decision-making.
At the planetary-boundary level, the project relates directly to Climate Change as a Planetary Boundary. Local early warning systems cannot describe the whole climate system, but they demonstrate an important adaptation principle: communities become more resilient when climate-related hazards are observable before they become catastrophic.
The project also connects to Freshwater Change and Earth System Risk because flooding, drought, rainfall variability, river-level changes, soil saturation, and stormwater stress are central to climate-related water risk.
Why Climate Early Warning Systems Matter
Climate disasters often unfold in stages. Environmental conditions shift before critical thresholds are reached. Monitoring these signals allows early warning systems to detect emerging hazards and convert environmental change into actionable time.
Examples include:
- rapid atmospheric pressure drops before severe storms
- prolonged rainfall before flooding
- extreme heat accumulation before heatwave impacts escalate
- rising river levels before flood events
- low soil moisture and high heat before drought stress worsens
- compound events where heat, humidity, rainfall, and infrastructure stress interact
At a practical level, this is what makes early warning infrastructure valuable: it turns environmental change into usable lead time. That lead time can support preparedness, evacuation planning by official authorities, resource staging, infrastructure inspection, public communication, and local risk awareness.
The technical challenge is not only detecting a threshold crossing. It is building a reliable chain from observation to interpretation to communication. If a sensor fails, a threshold is poorly chosen, a message is unclear, or an alert is not trusted, the warning system loses value. Early warning is therefore both an engineering problem and a governance problem.
The Early Warning Risk Chain
A climate early warning system can be understood as a chain of functions. Each link must work for the system to be useful.
| Stage | Function | Example in This Project |
|---|---|---|
| Observation | Measure environmental conditions | BME280 readings, rainfall counts, water-level distance, heat conditions |
| Storage | Preserve readings for review and trend analysis | SQLite climate readings table with timestamps and metadata |
| Interpretation | Translate measurements into risk indicators | Flood, pressure-drop, heat, and compound-risk rules |
| Classification | Assign an alert state | normal, caution, watch, warning |
| Communication | Share the alert state responsibly | Dashboard badge, local log, email/SMS test, or educational display |
| Action | Connect awareness to preparedness | Inspection, monitoring, official alert review, escalation to trusted sources |
The Raspberry Pi can support the first four stages in a prototype system. Public action, emergency response, evacuation, health guidance, and official warnings require institutional authority, professional validation, and trusted communication channels.
System Overview
The Raspberry Pi climate early warning system collects atmospheric and hydrological readings, stores them as structured time-series observations, evaluates risk rules, and produces a local alert state.
The system can include:
- BME280 sensor for temperature, humidity, and pressure
- tipping-bucket rain gauge for rainfall accumulation
- ultrasonic or weather-rated water-level sensor
- optional soil moisture sensor for drought or runoff context
- optional wind sensor for storm monitoring
- SQLite database logging
- threshold-based flood, storm, and heat-risk logic
- optional dashboard, local display, email/SMS test alert, or network export
The core design pattern is edge warning logic. The Raspberry Pi does not need to send every reading to a remote cloud system before making a local classification. It can store readings and calculate local alert states near the sensor site, which matters when connectivity is intermittent during storms or disasters.
System Requirements
A climate early warning prototype becomes useful only when its requirements are explicit. It must measure relevant signals, store data reliably, evaluate transparent rules, avoid false authority, and remain clear about public-safety limits.
| Requirement | Design Target | Reason |
|---|---|---|
| Multi-sensor observation | Measure atmospheric and hydrological signals | Hazards often emerge through interacting variables |
| Local time-series logging | Store readings with UTC timestamps, station ID, and quality flags | Supports review, validation, and trend analysis |
| Transparent thresholds | Use visible, adjustable, site-specific alert thresholds | Prevents hidden or arbitrary warning logic |
| Persistence rules | Require sustained or repeated conditions before escalating alerts where appropriate | Reduces false positives from noisy readings |
| Fail-safe communication | Label alerts as prototype conditions, not public emergency warnings | Prevents misuse in high-stakes public-safety contexts |
| Field reliability | Protect hardware with enclosure, power, mounting, and maintenance plans | Early warning systems must operate during difficult conditions |
| Validation workflow | Compare readings with reference devices or official data where possible | Improves trust and identifies sensor drift or placement problems |
These requirements frame the build as a prototype warning node rather than a simple weather station. It must observe, classify, log, communicate, and remain honest about uncertainty.
System Architecture
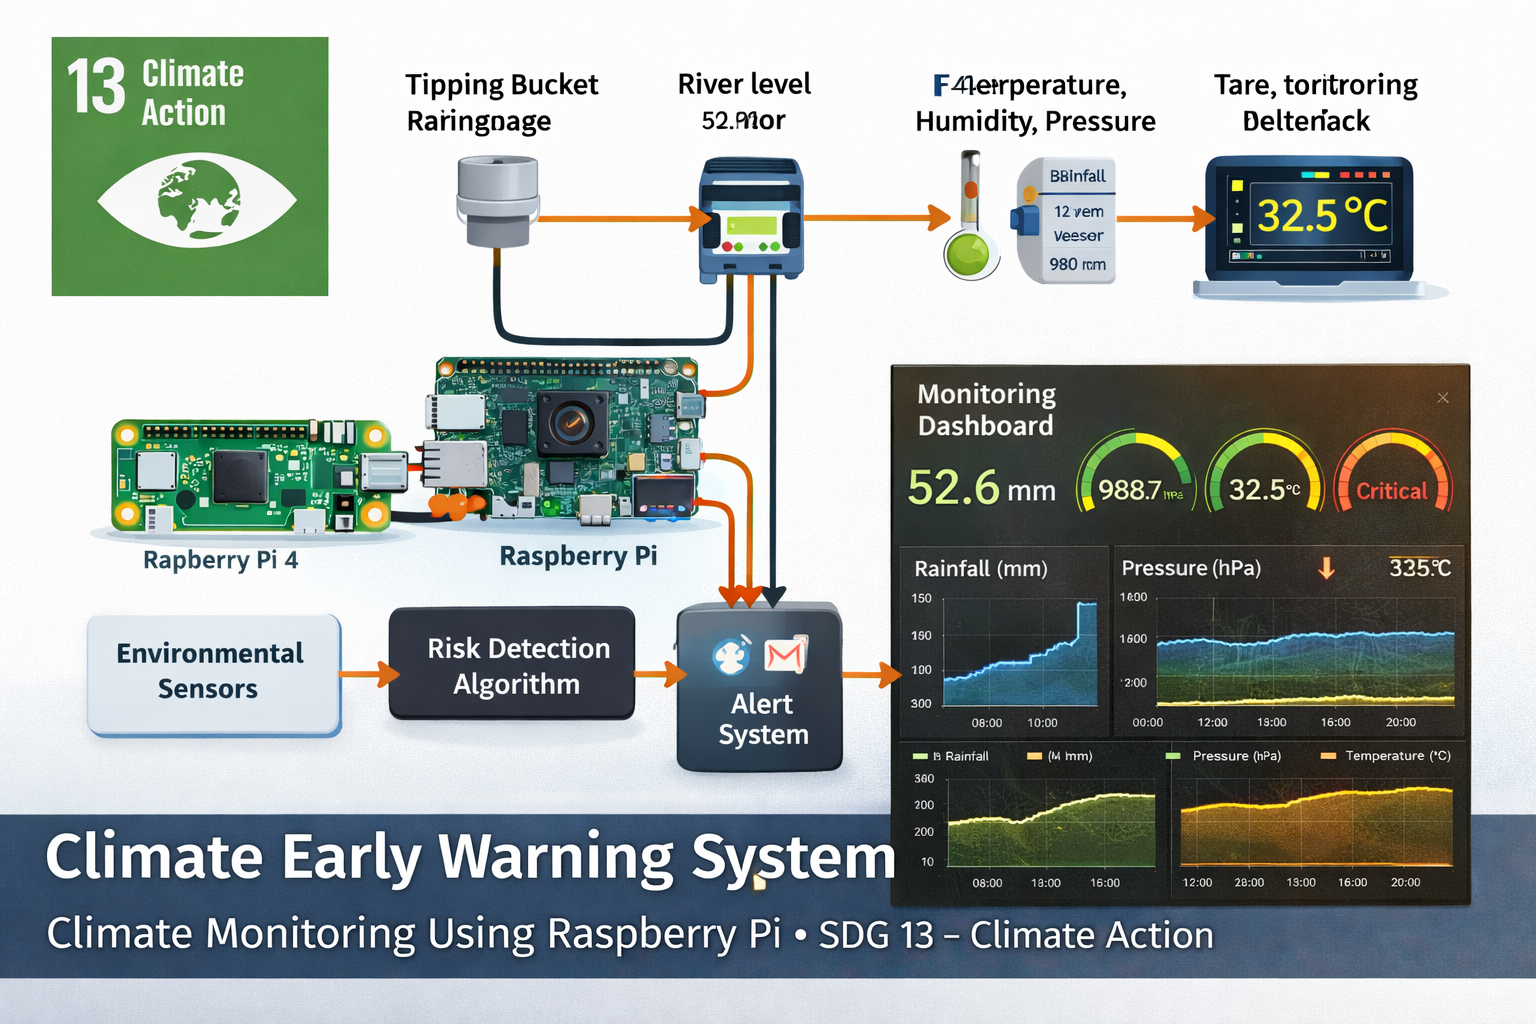
A Raspberry Pi early warning system combines environmental sensors, local data processing, storage, and communication systems to detect hazardous conditions.
Typical architecture:
Environmental Sensors → Raspberry Pi Data Processing → Risk Detection Algorithms → Alerts and Local StorageSensors measure environmental conditions continuously, while the Raspberry Pi analyzes data streams and triggers local alert states when thresholds are exceeded. The same architecture can also support local storage, dashboard export, and regional aggregation across multiple nodes.
At a systems level, the early warning node can be understood as five layers:
- Sensing layer: temperature, humidity, pressure, rainfall, water level, wind, soil moisture, or air-quality sensors
- Acquisition layer: GPIO, I2C, UART, pulse counting, or one-wire interfaces
- Storage layer: CSV, SQLite, InfluxDB, or cloud synchronization
- Analytics layer: threshold logic, trend detection, anomaly detection, persistence rules, and risk classification
- Communication layer: local dashboard, SMS/email test alerts, API export, or distributed monitoring networks
Public-safety use requires additional layers that this prototype does not provide: redundancy, official data integration, emergency-management governance, alert approval, communication reliability, audit logs, human oversight, and legal authority.
Environmental Sensors for Climate Monitoring
Early warning systems typically integrate multiple sensors to monitor atmospheric, hydrological, and local environmental conditions.
Common sensors include:
- Temperature sensors: detect heat exposure and local thermal stress.
- Humidity sensors: provide context for heat index, storm conditions, and moisture stress.
- Barometric pressure sensors: help identify pressure drops associated with storm systems.
- Tipping-bucket rainfall gauges: measure rainfall accumulation and intensity.
- River or water-level sensors: detect rising water levels in streams, channels, culverts, or flood-prone areas.
- Wind speed sensors: support storm-risk monitoring and severe weather observation.
- Soil moisture sensors: help interpret drought, runoff, and saturation risk.
Combining multiple environmental indicators improves risk interpretation because many hazards emerge from interacting signals rather than from a single variable alone. Rainfall matters more when soils are saturated. Heat matters more when humidity is high. Water level matters more when it rises rapidly. Pressure drops matter more when they coincide with wind, rainfall, or official forecasts.
Bill of Materials
- Raspberry Pi 4, Raspberry Pi 5, or Raspberry Pi Zero 2 W
- BME280 environmental sensor for temperature, humidity, and pressure
- tipping-bucket rainfall gauge
- ultrasonic water-level sensor or weather-rated distance sensor
- optional wind speed sensor
- optional soil moisture sensor
- microSD card with adequate endurance for logging
- weather-resistant enclosure
- solar power supply with battery storage for remote deployment
- network connection through Wi-Fi, Ethernet, cellular, or LoRa where appropriate
- secure mounting hardware, cable glands, drip loops, and strain relief
Outdoor monitoring stations often operate using solar panels and battery storage to support long-term field deployment in locations where grid power is unavailable. Weather-resistant enclosures, stable mounting, cable strain relief, sensor protection, and power reliability are essential for long-term usefulness.
Engineering Specifications
| Parameter | Reference Design |
|---|---|
| Compute platform | Raspberry Pi 4, Raspberry Pi 5, or Raspberry Pi Zero 2 W |
| Primary atmospheric sensor | BME280 for temperature, humidity, and pressure |
| Hydrological sensing | Ultrasonic water-level sensor or equivalent weather-rated distance sensor |
| Rainfall sensing | Tipping-bucket rain gauge |
| Optional sensors | Wind speed, soil moisture, solar power, air quality, or river-stage reference sensors |
| Storage options | CSV, SQLite, InfluxDB, or dashboard export |
| Alert mode | Threshold-based and trend-based local risk detection |
| Deployment mode | Distributed climate early warning node |
| Target scope | Educational, prototype, and experimental disaster-preparedness monitoring |
| Public-safety scope | Prototype awareness only; not an official emergency alert system |
The reference design is modular. It can begin with atmospheric sensing and local logging, then expand to rainfall, water level, dashboards, distributed nodes, and more advanced hazard-specific workflows.
Measurement Principle: Multi-Hazard Environmental Signals
A climate early warning node does not measure “risk” directly. It measures environmental signals associated with changing risk conditions. Temperature, humidity, pressure, rainfall, river level, and soil moisture are all partial indicators. Their meaning depends on local geography, infrastructure, season, watershed conditions, vulnerability, and historical patterns.
A BME280 sensor can measure local atmospheric conditions, but its placement determines whether it measures ambient air, enclosure heat, direct sunlight, or a shaded microclimate. A rainfall gauge can measure local rainfall, but wind, debris, leveling, and siting affect accuracy. A water-level sensor can estimate distance to a water surface, but waves, debris, mounting angle, and sensor height affect interpretation.
The measurement principle is therefore: collect multiple environmental signals, preserve timestamps and metadata, convert measurements into site-specific indicators, apply transparent rules, validate against reference data, and treat alerts as prototype awareness rather than official public warnings.
Early warning depends on relationships between variables. A pressure drop alone may be interesting. A pressure drop plus intense rainfall plus rising water level is more meaningful. A hot afternoon alone may be expected. High heat plus high humidity plus nighttime heat persistence may indicate greater public-health concern.
Mathematical Lens: From Environmental Signals to Early Warning
The Raspberry Pi climate early warning system can be understood as a time-series risk-classification system. It converts sensor readings into trends, thresholds, rise rates, persistence checks, and combined alert states.
\Delta x_t=x_t-x_{t-1}
\]
Interpretation: Change between consecutive readings helps identify rapid shifts such as pressure drops, rising water levels, or temperature increases.
Change detection is especially useful when absolute thresholds are not enough. A river still below a warning level may deserve attention if it is rising quickly.
r_t=\frac{x_t-x_{t-k}}{\Delta t}
\]
Interpretation: Rate of change \(r_t\) estimates how quickly a signal is rising or falling over a time interval.
Rise-rate logic can support flood awareness, pressure-change monitoring, and heat accumulation screening.
R_t =
\begin{cases}
\text{warning}, & x_t \geq T_{\mathrm{warning}} \\
\text{watch}, & x_t \geq T_{\mathrm{watch}} \\
\text{normal}, & x_t < T_{\mathrm{watch}}
\end{cases}
\]
Interpretation: A threshold classifier maps a measured variable \(x_t\) into a simple risk state.
Thresholds must be site-specific. Generic thresholds are useful for demonstration, but real early warning depends on local hydrology, heat risk, drainage systems, and historical experience.
\bar{x}_t=\frac{1}{n}\sum_{i=t-n+1}^{t}x_i
\]
Interpretation: A rolling average smooths noisy readings and helps identify baseline conditions.
Rolling baselines can reduce false alarms from brief sensor noise, but excessive smoothing can delay alerts. The time window should match the hazard.
A = \max(A_{\mathrm{flood}}, A_{\mathrm{storm}}, A_{\mathrm{heat}}, A_{\mathrm{drought}})
\]
Interpretation: A combined alert state can select the highest-priority hazard signal among multiple risk categories.
The mathematical lens shows why early warning is not only a sensor problem. It is a classification problem involving thresholds, trends, persistence, uncertainty, and communication.
Connecting Core Sensors
The BME280 communicates with the Raspberry Pi through the I2C interface.
- BME280 VCC → Raspberry Pi 3.3V
- BME280 GND → Raspberry Pi Ground
- BME280 SDA → Raspberry Pi GPIO 2
- BME280 SCL → Raspberry Pi GPIO 3
A tipping-bucket rain gauge typically behaves like a switch. Each bucket tip closes a circuit briefly. The Raspberry Pi can count pulses through a GPIO pin using a pull-up or pull-down configuration.
- rain gauge signal → selected GPIO input
- rain gauge ground → Raspberry Pi Ground
- software debounce → required to avoid double counting
An ultrasonic water-level sensor may require more caution. Some modules output 5V signals, while Raspberry Pi GPIO expects 3.3V logic. Use proper voltage division, level shifting, or weather-rated sensors appropriate to the deployment environment.
Enable I2C before running sensor scripts:
sudo raspi-config
# Interface Options → I2C → Enable

sudo apt update
sudo apt install -y i2c-tools
i2cdetect -y 1
Sensor wiring should be tested indoors before field deployment. In outdoor systems, cable routing, waterproof connectors, pull-up resistors, enclosure integrity, and grounding often matter as much as code.
Software Environment and Dependencies
The project uses Python because Raspberry Pi systems support sensor libraries, GPIO pulse counting, SQLite logging, local dashboards, and lightweight analytics in one environment.
sudo apt update
sudo apt install -y python3-pip python3-venv i2c-tools sqlite3

python3 -m venv .venv
source .venv/bin/activate

pip install adafruit-circuitpython-bme280 adafruit-blinka pandas requests RPi.GPIO
For first testing, run each layer separately: BME280 readings, rain-gauge pulse counting, water-level measurement, SQLite logging, risk classifiers, and alert engine. Once each layer works independently, combine them into a managed monitoring service.
For longer deployment, the system should run under systemd, cron, Docker, or a process supervisor. It should also include log rotation, storage monitoring, restart behavior, and safe handling of missing or invalid readings.
Reading Environmental Sensor Data with Python
The Raspberry Pi can collect environmental measurements using I2C sensors such as the BME280. The following example reads temperature, humidity, and pressure using a structured Python approach that can later be extended into logging, dashboard export, and alert logic.
"""
Raspberry Pi Climate Early Warning System
BME280 Environmental Sensor Reader

Reads:
- temperature in degrees Celsius
- relative humidity in percent
- atmospheric pressure in hectopascals

Notes:
- This is prototype code for educational and experimental monitoring.
- Sensor placement and enclosure design strongly affect data quality.
- Do not treat prototype readings as official public warning data.
"""

import time
from dataclasses import dataclass

import board
import busio
import adafruit_bme280


@dataclass
class ClimateReading:
    """Structured container for one atmospheric observation."""
    temperature_c: float
    humidity_percent: float
    pressure_hpa: float


def initialize_bme280() -> adafruit_bme280.Adafruit_BME280_I2C:
    """Initialize the BME280 sensor over the Raspberry Pi I2C bus."""
    i2c = busio.I2C(board.SCL, board.SDA)
    sensor = adafruit_bme280.Adafruit_BME280_I2C(i2c)

    return sensor


def read_climate_sensor(sensor: adafruit_bme280.Adafruit_BME280_I2C) -> ClimateReading:
    """Read one atmospheric observation from the BME280 sensor."""
    return ClimateReading(
        temperature_c=sensor.temperature,
        humidity_percent=sensor.humidity,
        pressure_hpa=sensor.pressure,
    )


def print_reading(reading: ClimateReading) -> None:
    """Print a formatted environmental reading."""
    print(
        f"Temperature: {reading.temperature_c:.2f} C | "
        f"Humidity: {reading.humidity_percent:.2f}% | "
        f"Pressure: {reading.pressure_hpa:.2f} hPa"
    )


def main() -> None:
    """Run a simple environmental monitoring loop."""
    sensor = initialize_bme280()

    print("Raspberry Pi Climate Early Warning System")
    print("Reading temperature, humidity, and pressure...")
    print("------------------------------------------------")

    while True:
        try:
            reading = read_climate_sensor(sensor)
            print_reading(reading)
        except Exception as exc:
            print(f"Sensor read error: {exc}")

        time.sleep(10)


if __name__ == "__main__":
    main()
These measurements can be logged continuously to build long-term local climate datasets and detect environmental shifts as they unfold.
Counting Rainfall Events from a Tipping-Bucket Gauge
A tipping-bucket rain gauge produces a pulse each time a small bucket tips. Each tip corresponds to a known rainfall depth, often specified by the gauge manufacturer. The Raspberry Pi can count these pulses and convert them into rainfall accumulation.
"""
Tipping-Bucket Rain Gauge Counter

Counts bucket tips using Raspberry Pi GPIO and converts them into rainfall
accumulation. The calibration value depends on the rain gauge.

This is prototype code. Validate pulse counting and rainfall calibration
before field interpretation.
"""

import time
from dataclasses import dataclass

import RPi.GPIO as GPIO


RAIN_PIN = 23

# Example: many tipping-bucket gauges use 0.2794 mm per tip.
# Replace this with the actual value for your gauge.
MM_PER_TIP = 0.2794

DEBOUNCE_SECONDS = 0.20


@dataclass
class RainfallState:
    """Tracks rainfall pulse count and accumulated rainfall."""
    tip_count: int = 0
    last_tip_time: float = 0.0

    @property
    def rainfall_mm(self) -> float:
        return self.tip_count * MM_PER_TIP


state = RainfallState()


def setup_gpio() -> None:
    """Configure rain gauge input pin."""
    GPIO.setmode(GPIO.BCM)
    GPIO.setup(RAIN_PIN, GPIO.IN, pull_up_down=GPIO.PUD_UP)


def rain_tip_callback(channel: int) -> None:
    """Handle one rain-gauge tip event with debounce."""
    now = time.time()

    if now - state.last_tip_time < DEBOUNCE_SECONDS:
        return

    state.tip_count += 1
    state.last_tip_time = now

    print(f"Rain tip count: {state.tip_count} | Rainfall: {state.rainfall_mm:.2f} mm")


if __name__ == "__main__":
    try:
        setup_gpio()

        GPIO.add_event_detect(
            RAIN_PIN,
            GPIO.FALLING,
            callback=rain_tip_callback,
            bouncetime=int(DEBOUNCE_SECONDS * 1000),
        )

        print("Rain gauge counter started.")

        while True:
            time.sleep(5)
            print(f"Accumulated rainfall: {state.rainfall_mm:.2f} mm")

    except KeyboardInterrupt:
        print("Stopping rain gauge counter.")

    finally:
        GPIO.cleanup()
Rainfall data becomes more useful when stored in intervals such as rainfall in the last 15 minutes, last hour, and last 24 hours. Flood-risk logic often depends on rainfall intensity and accumulation rather than total rainfall alone.
Water-Level Sensing for Flood Awareness
Water-level sensing can support flood awareness in streams, culverts, stormwater channels, detention basins, and low-lying drainage areas. A distance sensor can estimate how far the water surface is from a fixed reference point. If the distance decreases, water level is rising.
"""
Prototype Water-Level Calculation

Converts distance-to-water readings into estimated water level relative to a
fixed mounting reference.

This example assumes a separate function provides distance readings from a
weather-rated distance sensor.
"""

from dataclasses import dataclass


@dataclass
class WaterLevelReading:
    """Structured water-level observation."""
    sensor_height_cm: float
    distance_to_water_cm: float

    @property
    def water_level_cm(self) -> float:
        """
        Estimate water level relative to a fixed baseline.

        If the sensor is mounted 200 cm above a baseline and the measured
        distance to water is 120 cm, water level is 80 cm above baseline.
        """
        return self.sensor_height_cm - self.distance_to_water_cm


def classify_level(
    water_level_cm: float,
    watch_level_cm: float = 100.0,
    warning_level_cm: float = 130.0,
) -> str:
    """Classify water level using local thresholds."""
    if water_level_cm >= warning_level_cm:
        return "warning"

    if water_level_cm >= watch_level_cm:
        return "watch"

    return "normal"


if __name__ == "__main__":
    reading = WaterLevelReading(
        sensor_height_cm=200.0,
        distance_to_water_cm=84.0,
    )

    level = reading.water_level_cm
    print(f"Water level: {level:.1f} cm")
    print(f"Level state: {classify_level(level)}")
Water-level thresholds must be calibrated to the site. A 100 cm water level may be normal at one site and dangerous at another. Field reference marks, local flood history, official gauge data, and professional hydrological guidance are necessary for serious use.
Logging Climate Monitoring Data
Early warning systems become more useful when observations are stored over time. A lightweight SQLite database can preserve climate readings, alert states, and station metadata in a structured format.
"""
SQLite Logger for Raspberry Pi Climate Early Warning System

Stores timestamped climate observations:
- temperature
- humidity
- pressure
- rainfall
- water level
- alert state
- quality flags and notes

The resulting dataset can be analyzed with Python, R, SQL, or dashboards.
"""

import sqlite3
from datetime import datetime, timezone
from pathlib import Path


DATABASE_PATH = Path("climate_warning.db")


def create_connection(db_path: Path = DATABASE_PATH) -> sqlite3.Connection:
    """Create and return a SQLite database connection."""
    return sqlite3.connect(db_path)


def initialize_database(conn: sqlite3.Connection) -> None:
    """Create the climate_readings table if it does not already exist."""
    cursor = conn.cursor()

    cursor.execute("""
        CREATE TABLE IF NOT EXISTS climate_readings (
            id INTEGER PRIMARY KEY AUTOINCREMENT,
            timestamp_utc TEXT NOT NULL,
            temperature_c REAL,
            humidity_percent REAL,
            pressure_hpa REAL,
            rainfall_mm REAL,
            rainfall_mm_last_hour REAL,
            water_level_cm REAL,
            water_rise_rate_cm_per_hour REAL,
            alert_level TEXT DEFAULT 'normal',
            sensor_id TEXT DEFAULT 'climate_node_01',
            location_id TEXT DEFAULT 'prototype_site',
            quality_flag TEXT DEFAULT 'unchecked',
            notes TEXT DEFAULT ''
        )
    """)

    conn.commit()


def log_climate_reading(
    conn: sqlite3.Connection,
    temperature_c: float | None,
    humidity_percent: float | None,
    pressure_hpa: float | None,
    rainfall_mm: float | None,
    rainfall_mm_last_hour: float | None,
    water_level_cm: float | None,
    water_rise_rate_cm_per_hour: float | None,
    alert_level: str,
    sensor_id: str = "climate_node_01",
    location_id: str = "prototype_site",
    quality_flag: str = "unchecked",
    notes: str = "",
) -> None:
    """Insert one climate-monitoring observation into SQLite."""
    cursor = conn.cursor()

    timestamp_utc = datetime.now(timezone.utc).isoformat()

    cursor.execute("""
        INSERT INTO climate_readings (
            timestamp_utc,
            temperature_c,
            humidity_percent,
            pressure_hpa,
            rainfall_mm,
            rainfall_mm_last_hour,
            water_level_cm,
            water_rise_rate_cm_per_hour,
            alert_level,
            sensor_id,
            location_id,
            quality_flag,
            notes
        )
        VALUES (?, ?, ?, ?, ?, ?, ?, ?, ?, ?, ?, ?, ?)
    """, (
        timestamp_utc,
        temperature_c,
        humidity_percent,
        pressure_hpa,
        rainfall_mm,
        rainfall_mm_last_hour,
        water_level_cm,
        water_rise_rate_cm_per_hour,
        alert_level,
        sensor_id,
        location_id,
        quality_flag,
        notes,
    ))

    conn.commit()


if __name__ == "__main__":
    conn = create_connection()
    initialize_database(conn)

    # Example row. Replace these values with live sensor readings.
    log_climate_reading(
        conn=conn,
        temperature_c=32.5,
        humidity_percent=62.0,
        pressure_hpa=1004.2,
        rainfall_mm=14.5,
        rainfall_mm_last_hour=14.5,
        water_level_cm=96.0,
        water_rise_rate_cm_per_hour=8.0,
        alert_level="watch",
        quality_flag="demo",
        notes="example climate-monitoring observation",
    )

    conn.close()
Over time, this dataset can support trend analysis, alert validation, dashboarding, and comparison across distributed monitoring stations.
Climate Early Warning Data Model
A climate early warning system should store more than the latest sensor readings. It should preserve sensor identity, location ID, measurement units, alert level, quality flags, and field context.
| Field | Example | Purpose |
|---|---|---|
| timestamp_utc | 2026-05-28T09:15:00Z | Provides a consistent time reference for hazard analysis |
| location_id | creek_crossing_02 | Identifies the monitoring site without requiring public coordinates |
| sensor_id | climate_node_01 | Links readings to a specific station |
| temperature_c | 36.2 | Supports heat-risk screening |
| humidity_percent | 58.0 | Provides context for heat stress and storm conditions |
| pressure_hpa | 1006.8 | Supports pressure-drop and storm-change monitoring |
| rainfall_mm_last_hour | 24.0 | Supports rainfall-intensity and flood-risk logic |
| water_level_cm | 118.0 | Supports flood-stage awareness |
| alert_level | watch | Records current prototype risk state |
| quality_flag | valid | Marks readings as valid, suspect, demo, missing, or sensor-review-needed |
| notes | debris near water sensor | Preserves field and maintenance context |
A clear data model helps make the system auditable. When alerts occur, users should be able to see which readings, thresholds, and notes produced the alert state.
Flood Risk Monitoring
Flood monitoring systems can use ultrasonic sensors to measure river, stream, drainage-channel, or culvert water levels. If water levels rise rapidly or exceed defined thresholds, the system can trigger a local alert state.
The following example combines water level, rainfall, and rise-rate signals into a simple flood-risk classifier.
"""
Flood Risk Classifier

Combines water level, rainfall, and rate-of-rise indicators into a simple
prototype alert state.

This is not an official flood forecast. Public warning systems require
professional hydrological modeling, validation, redundancy, and governance.
"""

from dataclasses import dataclass


@dataclass
class FloodInputs:
    """Input values used by the flood-risk classifier."""
    water_level_cm: float
    rainfall_mm_last_hour: float
    rise_rate_cm_per_hour: float


@dataclass
class FloodThresholds:
    """Local thresholds that should be calibrated to the site."""
    watch_level_cm: float = 100.0
    warning_level_cm: float = 130.0
    rainfall_watch_mm: float = 20.0
    rapid_rise_cm_per_hour: float = 15.0


def classify_flood_risk(
    inputs: FloodInputs,
    thresholds: FloodThresholds = FloodThresholds(),
) -> str:
    """
    Classify flood risk using level, rainfall, and rise-rate values.

    Returns:
    - normal
    - watch
    - warning
    """
    if inputs.water_level_cm >= thresholds.warning_level_cm:
        return "warning"

    if inputs.water_level_cm >= thresholds.watch_level_cm:
        return "watch"

    if inputs.rainfall_mm_last_hour >= thresholds.rainfall_watch_mm:
        return "watch"

    if inputs.rise_rate_cm_per_hour >= thresholds.rapid_rise_cm_per_hour:
        return "watch"

    return "normal"


if __name__ == "__main__":
    sample_inputs = FloodInputs(
        water_level_cm=118.0,
        rainfall_mm_last_hour=24.0,
        rise_rate_cm_per_hour=9.5,
    )

    print(classify_flood_risk(sample_inputs))
This rule-based approach allows early detection of rising water levels and can be extended with additional context such as recent rainfall, upstream gauge data, soil saturation, weather forecasts, or historical baseline conditions.
Flood thresholds should be developed carefully. A prototype threshold can demonstrate logic, but real flood warning requires site surveys, official gauge references, professional hydrology, redundancy, and emergency-management governance.
Storm Detection Using Atmospheric Pressure
Rapid drops in atmospheric pressure can indicate developing or approaching storm systems. A monitoring system can detect pressure anomalies by comparing current measurements to recent local baselines.
"""
Storm Pressure Drop Detector

Tracks recent pressure readings and flags rapid pressure drops.

This is a simple prototype heuristic, not a certified severe-weather warning
method. Interpret results alongside official weather information.
"""

from collections import deque
from statistics import mean


class PressureDropDetector:
    """Tracks pressure readings and detects possible storm signals."""

    def __init__(self, window_size: int = 12, drop_threshold_hpa: float = 4.0):
        self.window_size = window_size
        self.drop_threshold_hpa = drop_threshold_hpa
        self.recent_pressure = deque(maxlen=window_size)

    def add_reading(self, pressure_hpa: float) -> dict:
        """
        Add a pressure reading and return pressure-drop diagnostics.

        A drop relative to recent baseline may indicate changing storm conditions.
        """
        if len(self.recent_pressure) == 0:
            baseline = pressure_hpa
        else:
            baseline = mean(self.recent_pressure)

        pressure_drop = baseline - pressure_hpa
        possible_storm_signal = pressure_drop >= self.drop_threshold_hpa

        self.recent_pressure.append(pressure_hpa)

        return {
            "pressure_hpa": pressure_hpa,
            "baseline_hpa": baseline,
            "pressure_drop_hpa": pressure_drop,
            "possible_storm_signal": possible_storm_signal,
        }


if __name__ == "__main__":
    detector = PressureDropDetector(window_size=6, drop_threshold_hpa=3.0)

    sample_pressure_values = [1012.4, 1011.9, 1011.5, 1010.8, 1009.2, 1006.8]

    for pressure in sample_pressure_values:
        print(detector.add_reading(pressure))
Machine learning models can later extend this logic by detecting more complex patterns that precede severe weather events. For a prototype system, pressure-drop logic is useful as one signal among several rather than as a standalone storm-warning mechanism.
Heat Risk Monitoring
Heat risk depends on more than air temperature. Humidity affects the body’s ability to cool itself, and urban surfaces can intensify local heat exposure. A Raspberry Pi early warning system can use temperature and humidity readings to classify local heat-risk conditions.
"""
Prototype Heat Risk Classifier

Uses temperature and humidity to produce a simple local heat-risk category.

This is a simplified educational example. Public health decisions should rely
on official heat advisories and validated heat-index methods.
"""

from dataclasses import dataclass


@dataclass
class HeatInputs:
    """Input values for local heat-risk classification."""
    temperature_c: float
    humidity_percent: float


def classify_heat_risk(inputs: HeatInputs) -> str:
    """
    Classify heat risk using simple threshold logic.

    This does not replace official heat-index calculations.
    """
    if inputs.temperature_c >= 38.0:
        return "warning"

    if inputs.temperature_c >= 35.0 and inputs.humidity_percent >= 50.0:
        return "watch"

    if inputs.temperature_c >= 32.0:
        return "caution"

    return "normal"


if __name__ == "__main__":
    sample = HeatInputs(
        temperature_c=36.2,
        humidity_percent=58.0,
    )

    print(f"Heat risk level: {classify_heat_risk(sample)}")
In more advanced systems, heat-risk logic could integrate official weather data, urban heat island monitoring, shade exposure, land-surface temperature, nighttime heat persistence, population vulnerability, and public-health thresholds.
Compound Risk and Multi-Signal Interpretation
Many climate hazards are compound events. A flood-risk signal may depend on rainfall, prior soil saturation, blocked drainage, river level, and upstream conditions. A heat-risk signal may depend on temperature, humidity, nighttime cooling, air quality, access to cooling, and local vulnerability.
A simple compound-risk score can help prioritize review when several signals are elevated at once.
"""
Compound Climate Risk Score

Combines normalized hazard indicators into a simple prototype review score.

This is not a public warning model. It is a transparent educational example
for multi-signal environmental interpretation.
"""


def bounded(value: float, minimum: float = 0.0, maximum: float = 1.0) -> float:
    """Clamp value between minimum and maximum."""
    return max(minimum, min(maximum, value))


def normalized_threshold_score(value: float, watch: float, warning: float) -> float:
    """
    Convert a measured value into a 0–1 score between watch and warning thresholds.
    """
    if warning == watch:
        return 0.0

    return bounded((value - watch) / (warning - watch))


def compound_risk_score(
    water_level_cm: float,
    rainfall_mm_last_hour: float,
    temperature_c: float,
    humidity_percent: float,
) -> dict:
    """Return a simple compound risk score from multiple indicators."""
    flood_component = normalized_threshold_score(
        value=water_level_cm,
        watch=100.0,
        warning=130.0,
    )

    rainfall_component = normalized_threshold_score(
        value=rainfall_mm_last_hour,
        watch=20.0,
        warning=40.0,
    )

    heat_component = normalized_threshold_score(
        value=temperature_c,
        watch=32.0,
        warning=38.0,
    )

    humidity_component = normalized_threshold_score(
        value=humidity_percent,
        watch=50.0,
        warning=80.0,
    )

    score = max(
        flood_component,
        rainfall_component,
        (heat_component + humidity_component) / 2.0,
    )

    if score >= 0.75:
        level = "warning"
    elif score >= 0.40:
        level = "watch"
    elif score >= 0.20:
        level = "caution"
    else:
        level = "normal"

    return {
        "compound_score": score,
        "compound_level": level,
    }


if __name__ == "__main__":
    result = compound_risk_score(
        water_level_cm=116.0,
        rainfall_mm_last_hour=28.0,
        temperature_c=33.5,
        humidity_percent=62.0,
    )

    print(result)
Compound scoring should remain transparent. A simple score can be useful for dashboards, but it should not hide which variables drove the result. Users should always be able to inspect the underlying readings.
Prototype Alert Engine
A climate early warning node becomes more useful when multiple hazard signals are combined into a single alert state. The following example merges flood, storm, and heat-risk signals into one local alert level.
"""
Prototype Climate Alert Engine

Combines flood, storm, and heat indicators into one local alert level.

This is not an official emergency alert system. It is a transparent prototype
for educational and experimental climate monitoring.
"""

ALERT_PRIORITY = {
    "normal": 0,
    "caution": 1,
    "watch": 2,
    "warning": 3,
}


def combine_alert_levels(*levels: str) -> str:
    """
    Return the highest-priority alert level from multiple hazard signals.

    Supported levels:
    - normal
    - caution
    - watch
    - warning
    """
    valid_levels = [level for level in levels if level in ALERT_PRIORITY]

    if not valid_levels:
        return "normal"

    return max(valid_levels, key=lambda level: ALERT_PRIORITY[level])


def print_alert_message(alert_level: str) -> None:
    """Print a human-readable alert message."""
    if alert_level == "warning":
        print("WARNING: Severe local environmental risk conditions detected.")
    elif alert_level == "watch":
        print("WATCH: Conditions indicate elevated risk. Continue monitoring.")
    elif alert_level == "caution":
        print("CAUTION: Environmental conditions deserve attention.")
    else:
        print("NORMAL: No elevated local risk detected.")


if __name__ == "__main__":
    flood_level = "watch"
    storm_level = "normal"
    heat_level = "caution"

    combined = combine_alert_levels(flood_level, storm_level, heat_level)
    print_alert_message(combined)
This alert engine can be connected to email, SMS, dashboard badges, local LEDs, or sirens in experimental settings. Any real public-warning function would require official coordination, validation, redundancy, and governance.
Alert Governance, Public Communication, and Escalation
Early warning is not only a technical function. It is a public communication responsibility. A dashboard that displays “warning” can create anxiety, false confidence, confusion, or action if users do not understand the system’s authority and limits.
For this prototype, alert language should remain conservative:
- normal: no elevated prototype risk signal detected
- caution: local conditions deserve attention
- watch: prototype readings indicate elevated local risk; check official sources
- warning: prototype readings indicate severe local conditions; use official emergency information and local guidance
Any public-facing version should avoid pretending to be an official emergency service. It should link users to trusted local weather, flood, heat, and emergency-management sources. It should also show the readings that produced the alert, the time of the latest update, data gaps, and sensor-quality status.
Escalation design matters. A classroom dashboard can display an alert badge. A community pilot might notify a volunteer coordinator. A public-warning network requires emergency-management integration, redundancy, validation, and institutional accountability.
Distributed Environmental Monitoring Networks
Individual monitoring stations can be connected into larger environmental monitoring networks. Multiple Raspberry Pi nodes may transmit environmental data to a central server that aggregates regional climate information.
Applications include:
- community flood monitoring systems
- regional climate observation networks
- citizen science weather monitoring
- agricultural climate monitoring
- urban heat island observation networks
- school, library, park, campus, or watershed resilience projects
Distributed networks significantly improve environmental visibility across larger geographic areas and can reveal patterns that isolated stations might miss. They also help communities compare local conditions across neighborhoods, elevation zones, watersheds, drainage basins, or infrastructure contexts.
Network consistency is important. If each station uses different sensor placement, calibration, units, timestamps, and quality flags, comparison becomes difficult. A network needs shared metadata conventions, station IDs, maintenance records, and data-quality rules.
AI and Predictive Climate Risk Detection
Machine learning models can enhance early warning systems by identifying environmental patterns associated with emerging hazards.
Examples include:
- flood prediction models
- storm risk detection
- heatwave forecasting
- drought monitoring
- sensor failure detection
- compound-risk classification
Lightweight frameworks such as TensorFlow Lite allow predictive models to run directly on Raspberry Pi devices. This enables climate-risk detection even in remote locations without reliable internet connectivity.
Predictive models require special caution. A model trained on one watershed, climate, sensor setup, or city may fail in another. A model can also learn sensor artifacts rather than real hazards. For prototype systems, machine learning should be used for screening and review rather than final warning authority.
"""
Simple Sensor Failure Screening

Flags missing values, impossible ranges, or unchanged readings that may
indicate sensor failure.

This kind of quality screen should run before hazard classification.
"""


def quality_check_reading(
    temperature_c: float | None,
    humidity_percent: float | None,
    pressure_hpa: float | None,
) -> list[str]:
    """Return quality flags for atmospheric readings."""
    flags = []

    if temperature_c is None:
        flags.append("missing_temperature")
    elif temperature_c < -50 or temperature_c > 60:
        flags.append("temperature_out_of_range")

    if humidity_percent is None:
        flags.append("missing_humidity")
    elif humidity_percent < 0 or humidity_percent > 100:
        flags.append("humidity_out_of_range")

    if pressure_hpa is None:
        flags.append("missing_pressure")
    elif pressure_hpa < 850 or pressure_hpa > 1100:
        flags.append("pressure_out_of_range")

    return flags


if __name__ == "__main__":
    flags = quality_check_reading(
        temperature_c=36.2,
        humidity_percent=58.0,
        pressure_hpa=1006.8,
    )

    print(flags or ["ok"])
Quality checks are as important as predictive models. An early warning system should not classify hazards from broken sensors, missing data, or impossible values.
GitHub Repository
The article body includes the core sensor-reading, rainfall, water-level, logging, flood, storm, heat, compound-risk, and alert-engine examples so the build remains readable. The full repository expands the project into a reproducible prototype package, including Python sensor-reading scripts, climate data logging utilities, threshold-based alert logic, anomaly detection scaffolding, deployment notes, and example climate-monitoring datasets.
Complete Code Repository
The full code distribution for this project, including Python sensor-reading scripts, climate data logging utilities, threshold-based alert logic, anomaly detection scaffolding, deployment notes, and example climate-monitoring datasets, is available on GitHub.
The repository contains the complete prototype build materials:
- Python sensor-reading scripts
- data logging utilities
- alert detection logic
- deployment notes
- example climate-monitoring datasets
- supporting environmental analysis files
Repository Structure
raspberry-pi-climate-early-warning-system/

README.md
LICENSE
requirements.txt

src/
  read_climate_sensors.py
  rain_gauge_counter.py
  water_level.py
  log_climate_data.py
  flood_risk.py
  storm_pressure_check.py
  heat_risk.py
  compound_risk.py
  alert_engine.py
  anomaly_detection.py
  quality_checks.py

docs/
  setup_guide.md
  deployment_notes.md
  sensor_notes.md
  alert_design.md
  safety_scope.md
  data_model.md
  responsible_use.md

data/
  example_climate_readings.csv

hardware/
Engineers can clone the repository, fork the design, or download the complete project using GitHub’s Download ZIP feature. All materials are released under the MIT License to support reuse in research, education, community resilience, and prototype engineering work.
Climate Resilience and SDG 13
Climate adaptation requires reliable environmental monitoring infrastructure. Early warning systems provide communities with the information needed to anticipate environmental risks and respond more quickly.
These systems contribute to:
- SDG 13: Climate Action by strengthening resilience to climate hazards
- SDG 11: Sustainable Cities and Communities by improving disaster preparedness and infrastructure awareness
- SDG 6: Clean Water and Sanitation by improving hydrological observation and water-risk monitoring
- SDG 9: Industry, Innovation and Infrastructure by demonstrating distributed sensing and resilient edge infrastructure
Climate resilience is not only a matter of infrastructure hardening. It is also a matter of perception: communities need systems that help them see changing risk conditions early enough to respond.
The strongest resilience systems combine formal institutions and local observation. Official weather and emergency systems provide authoritative warnings; local sensing can add neighborhood-scale visibility, education, and situational awareness. A responsible prototype should support that ecosystem rather than compete with it.
Engineering Notes
A few technical considerations are especially important in this build:
- Field reliability: enclosure design, power resilience, and sensor placement matter as much as code.
- Threshold realism: alert logic must reflect local environmental conditions rather than generic assumptions.
- Multi-signal value: combining rainfall, pressure, temperature, humidity, and water-level data improves risk interpretation.
- Distributed scaling: local node consistency becomes important when multiple stations are compared.
- Edge usefulness: local alert logic matters most when connectivity is intermittent or absent.
- Maintenance: sensors, batteries, enclosures, mounts, and communication links require inspection.
- False positives and false negatives: warning systems must be evaluated carefully so they do not create either panic or misplaced confidence.
- Governance: public alerts require authority, trust, escalation procedures, and official communication channels.
These considerations make the project more than a weather station. It becomes a prototype climate resilience infrastructure node.
Deployment Scope and Public-Safety Limits
This prototype is designed for educational, experimental, and early-stage climate monitoring. It should not be treated as a certified public warning network, official weather station, emergency alert system, or substitute for government weather, flood, or disaster-warning services.
Public warning is a high-stakes function. Real warning systems require validated models, redundant sensors, resilient communications, institutional responsibility, maintenance procedures, emergency protocols, legal authority, and coordination with public agencies.
These constraints do not make the prototype unhelpful. They define the appropriate scope of use: local observation, education, prototype analytics, climate-awareness projects, community science, watershed monitoring, and early-stage infrastructure experimentation. For public warning, emergency management, insurance, regulatory, or legal decisions, use official information and professionally validated systems.
Any dashboard, alert message, or public display should clearly state that the system is a prototype local monitoring tool. It should direct users to official weather, flood, heat, and emergency-management sources for consequential decisions.
Failure Modes and Practical Risks
A useful early-warning article should explain not only how the system works, but how it can fail. Warning systems are especially sensitive because both false positives and false negatives matter.
- False positives: noisy sensors, poor thresholds, or bouncing pulses may trigger unnecessary alerts.
- False negatives: failed sensors, missing data, bad placement, or overly high thresholds may miss emerging hazards.
- Sensor placement errors: direct sun, poor ventilation, blocked rain gauges, or poor water-level geometry can distort readings.
- Power failure: storms can interrupt power exactly when the station is most needed.
- Communication failure: network outages can prevent data export or alert messages.
- Storage failure: long-running logging can fill storage or corrupt data if not managed.
- Threshold mismatch: generic thresholds may not fit local hydrology, topography, or infrastructure.
- Message ambiguity: users may misunderstand “watch” or “warning” if the source and authority are unclear.
- Overreliance: users may trust a prototype more than official warnings or direct observations.
- Maintenance neglect: dirty sensors, debris, insects, corrosion, or shifted mounts can quietly degrade performance.
These risks do not make the project unusable. They make transparent scope, validation, redundancy, and careful communication essential. A prototype early-warning system should increase awareness without creating false authority.
Validation and Testing
To bring this project closer to engineering-grade documentation, validation should include:
- verify sensor communication with the BME280 and any additional rainfall or water-level sensors
- confirm that temperature, humidity, and pressure readings remain plausible under known conditions
- test rainfall pulse counting using simulated bucket tips
- validate water-level calculations against measured reference distances
- test threshold-based flood, storm, heat, and compound-risk logic using simulated input values
- verify CSV or SQLite logging over repeated intervals
- test alert logic under repeated trigger conditions
- run extended trials to assess uptime and storage reliability
- compare readings against nearby reference devices or official weather data where possible
- document sensor placement, enclosure design, location metadata, and maintenance intervals
If the system behaves inconsistently, the issue may be related to sensor placement, threshold selection, power instability, logging configuration, environmental noise, enclosure design, field exposure, or communication reliability rather than to the monitoring concept itself.
Example Validation Record
| Test | Expected Result | Observed Result | Likely Issue | Action |
|---|---|---|---|---|
| BME280 reading check | Temperature, humidity, pressure are plausible | Temperature high in afternoon | Direct sun or enclosure heat | Improve shading and ventilation |
| Rain gauge pulse test | Each tip counted once | Double count occurs | Switch bounce | Add debounce logic and retest |
| Water-level reference test | Measured distance matches reference | Readings jump near waves | Surface turbulence or sensor angle | Adjust mounting and smooth readings |
| Flood classifier simulation | Watch/warning triggers at defined inputs | Expected state returned | None | Proceed to field thresholds |
| Extended logging | No gaps over 24 hours | Gaps after Wi-Fi outage | Network-dependent workflow | Prioritize local logging and later sync |
Validation records like this help distinguish true environmental signals from measurement artifacts. That distinction is essential in early warning.
Suggested Performance Metrics
For a more rigorous evaluation, the system can be assessed using several simple metrics:
- sensor stability: consistency of repeated readings under unchanged conditions
- alert reliability: whether warning logic triggers under intended conditions without excessive false alarms
- false-positive rate: how often alert states occur without meaningful environmental change
- false-negative review: whether known events occurred without a prototype alert signal
- logging reliability: whether observations are stored without loss over long runs
- uptime: how consistently the station continues operating without intervention
- data completeness: whether expected observations are captured across monitoring intervals
- operational usefulness: whether collected data improves local understanding of environmental risk
- maintenance burden: how often the station requires cleaning, recalibration, rebooting, battery replacement, or enclosure repair
Even simple tracking of these metrics improves the project’s value as an experimental climate early warning platform. The goal is not only to produce alerts, but to produce alerts that are explainable, reviewable, and properly bounded.
Field Deployment, Power, Communications, and Maintenance
Field deployment is difficult because early warning stations must operate during the conditions that are most likely to stress them. Heavy rain, heat, wind, debris, insects, flooding, power loss, and communication outages can all occur during hazard events.
Responsible deployment should address:
- weather-resistant enclosure design
- sensor shielding without blocking airflow, rainfall, or distance measurement
- stable mounting above expected flood or splash levels
- solar power and battery sizing for cloudy or stormy periods
- local data logging during network outages
- watchdog or service restart behavior
- communications fallback where appropriate
- storage backup and log rotation
- maintenance schedule for cleaning sensors and checking mounts
- field notes after storms, heavy rain, alerts, or sensor adjustments
Maintenance is part of the warning system. A clogged rain gauge, tilted water-level sensor, overheated enclosure, drained battery, or shifted mount can make the alert logic wrong. Field logs should document every cleaning, relocation, calibration check, repair, and unusual environmental event.
The Future of Climate Monitoring Infrastructure
Advances in sensor networks, edge computing, satellite data, and climate analytics are transforming environmental monitoring.
Future early warning systems will increasingly integrate:
- satellite weather observations
- ground-based sensor networks
- weather radar and hydrological models
- AI-based risk detection
- automated emergency alerts
- open environmental databases
- community-based observation networks
- localized dashboards for adaptation planning
Platforms such as Raspberry Pi allow researchers, students, schools, libraries, watershed groups, resilience labs, and communities to prototype these systems at low cost while contributing valuable environmental data to broader resilience efforts.
The long-term challenge is not merely collecting more climate data. It is building monitoring systems that are accurate enough to be useful, resilient enough to operate during hazards, transparent enough to be trusted, and integrated enough to support real-world preparedness.
That future should remain accountable. Early warning infrastructure must not become a way to shift responsibility from public institutions to communities without support. Community monitoring can strengthen visibility, but emergency management, public infrastructure, and climate adaptation require institutional capacity and investment.
Responsible Deployment
This prototype is appropriate for classrooms, makerspaces, watershed groups, resilience labs, community science programs, environmental education, and early-stage climate adaptation projects. It should not be used as an official warning system, emergency alert service, evacuation trigger, public-health warning, or legal decision tool without professional validation and institutional governance.
Responsible deployment means matching the system to the consequence of error. A classroom demonstration can use simulated readings. A watershed education project can observe local conditions. A community pilot may support awareness and volunteer monitoring. A public warning network requires formal responsibility, redundancy, official data integration, maintenance guarantees, and emergency-management coordination.
A responsible version should include clear prototype labeling, official-source links, sensor-quality flags, data gaps, alert explanations, maintenance logs, threshold documentation, and a process for reviewing alerts after events.
The central rule is simple: early warning prototypes should increase preparedness and environmental awareness without pretending to replace official public-safety systems.
Reproducibility
All code, documentation, and supporting build materials necessary to reproduce the prototype are included in the project repository. The design intentionally relies on widely available Raspberry Pi hardware, open-source Python libraries, and common environmental sensing components so that it can be rebuilt in classrooms, labs, makerspaces, community resilience programs, and independent climate-monitoring projects.
The system is intended as a reference implementation rather than a certified public warning network. Engineers adapting it for longer-term deployment should validate threshold design, enclosure resilience, power systems, data retention, communications reliability, mounting geometry, sensor maintenance, local environmental assumptions, and public-safety communication boundaries under real operating conditions.
For the rest of this project series, reproducibility should mean more than making code available. Each article should include a clear bill of materials, setup instructions, validation notes, data model, known failure modes, test procedure, responsible-use framing, and realistic statement of appropriate scope.
Conclusion
Building a Raspberry Pi climate early warning system demonstrates how embedded sensing and local computation can support stronger climate resilience infrastructure. By combining environmental sensors, local logging, alert logic, and optional distributed monitoring workflows, the platform creates a flexible foundation for disaster-preparedness observation.
Although compact, the design reflects a broader sustainability principle: climate resilience depends on environmental visibility. When local conditions can be measured continuously and interpreted early, communities are better positioned to anticipate hazards and respond more effectively.
For classrooms, makerspaces, watershed groups, resilience labs, community science programs, and early-stage climate adaptation projects, this Raspberry Pi climate early warning system provides a practical foundation for understanding how sensing, data infrastructure, and disaster preparedness can work together.
The deeper lesson is not simply that a Raspberry Pi can read weather sensors and display alert states. The deeper lesson is that early warning requires a whole chain of responsible design: sensor placement, data quality, threshold calibration, trend logic, alert governance, official-source awareness, public-safety boundaries, maintenance, and trust. When those layers are treated seriously, even a small prototype can demonstrate the logic of climate resilience infrastructure.
Related Articles and Site Areas
- Raspberry Pi Sustainability Engineering Series
- Raspberry Pi Solar Microgrid Monitoring System
- Raspberry Pi Flood and River Monitoring Network
- Environmental Monitoring Systems
- Intelligent Infrastructure Systems
- Climate Change as a Planetary Boundary
- Freshwater Change and Earth System Risk
- Sustainable Development Goals Within Planetary Boundaries
- Planetary Boundaries
Further Reading
- Adafruit (n.d.) Adafruit BME280 Humidity, Barometric Pressure, and Temperature Sensor Breakout. Available at: https://learn.adafruit.com/adafruit-bme280-humidity-barometric-pressure-temperature-sensor-breakout
- Intergovernmental Panel on Climate Change (2022) Climate Change 2022: Impacts, Adaptation and Vulnerability. Available at: https://www.ipcc.ch/report/ar6/wg2/
- National Oceanic and Atmospheric Administration (n.d.) National Weather Service. Available at: https://www.weather.gov/
- Raspberry Pi Foundation (n.d.) Raspberry Pi Documentation. Available at: https://www.raspberrypi.com/documentation/
- United Nations (n.d.) Sustainable Development Goal 13: Climate Action. Available at: https://sdgs.un.org/goals/goal13
- United Nations Office for Disaster Risk Reduction (2015) Sendai Framework for Disaster Risk Reduction 2015–2030. Available at: https://www.undrr.org/publication/sendai-framework-disaster-risk-reduction-2015-2030
- United Nations Office for Disaster Risk Reduction (n.d.) Early Warnings for All. Available at: https://www.undrr.org/early-warnings-for-all
- U.S. Geological Survey (n.d.) Water Data for the Nation. Available at: https://waterdata.usgs.gov/nwis
- World Meteorological Organization (n.d.) Early Warnings for All. Available at: https://wmo.int/activities/early-warnings-all
- World Meteorological Organization (n.d.) Multi-Hazard Early Warning Systems. Available at: https://wmo.int/topics/multi-hazard-early-warning-systems
References
- Adafruit (n.d.) Adafruit BME280 Humidity, Barometric Pressure, and Temperature Sensor Breakout. Available at: https://learn.adafruit.com/adafruit-bme280-humidity-barometric-pressure-temperature-sensor-breakout
- Intergovernmental Panel on Climate Change (2022) Climate Change 2022: Impacts, Adaptation and Vulnerability. Available at: https://www.ipcc.ch/report/ar6/wg2/
- National Oceanic and Atmospheric Administration (n.d.) National Weather Service. Available at: https://www.weather.gov/
- Raspberry Pi Foundation (n.d.) Raspberry Pi Documentation. Available at: https://www.raspberrypi.com/documentation/
- United Nations (n.d.) The 17 Sustainable Development Goals. Available at: https://sdgs.un.org/goals
- United Nations (n.d.) Sustainable Development Goal 3: Good Health and Well-Being. Available at: https://sdgs.un.org/goals/goal3
- United Nations (n.d.) Sustainable Development Goal 6: Clean Water and Sanitation. Available at: https://sdgs.un.org/goals/goal6
- United Nations (n.d.) Sustainable Development Goal 9: Industry, Innovation and Infrastructure. Available at: https://sdgs.un.org/goals/goal9
- United Nations (n.d.) Sustainable Development Goal 11: Sustainable Cities and Communities. Available at: https://sdgs.un.org/goals/goal11
- United Nations (n.d.) Sustainable Development Goal 13: Climate Action. Available at: https://sdgs.un.org/goals/goal13
- United Nations Office for Disaster Risk Reduction (2015) Sendai Framework for Disaster Risk Reduction 2015–2030. Available at: https://www.undrr.org/publication/sendai-framework-disaster-risk-reduction-2015-2030
- United Nations Office for Disaster Risk Reduction (n.d.) Early Warnings for All. Available at: https://www.undrr.org/early-warnings-for-all
- U.S. Geological Survey (n.d.) Water Data for the Nation. Available at: https://waterdata.usgs.gov/nwis
- World Meteorological Organization (n.d.) Early Warnings for All. Available at: https://wmo.int/activities/early-warnings-all
- World Meteorological Organization (n.d.) Multi-Hazard Early Warning Systems. Available at: https://wmo.int/topics/multi-hazard-early-warning-systems