
Last Updated May 29, 2026
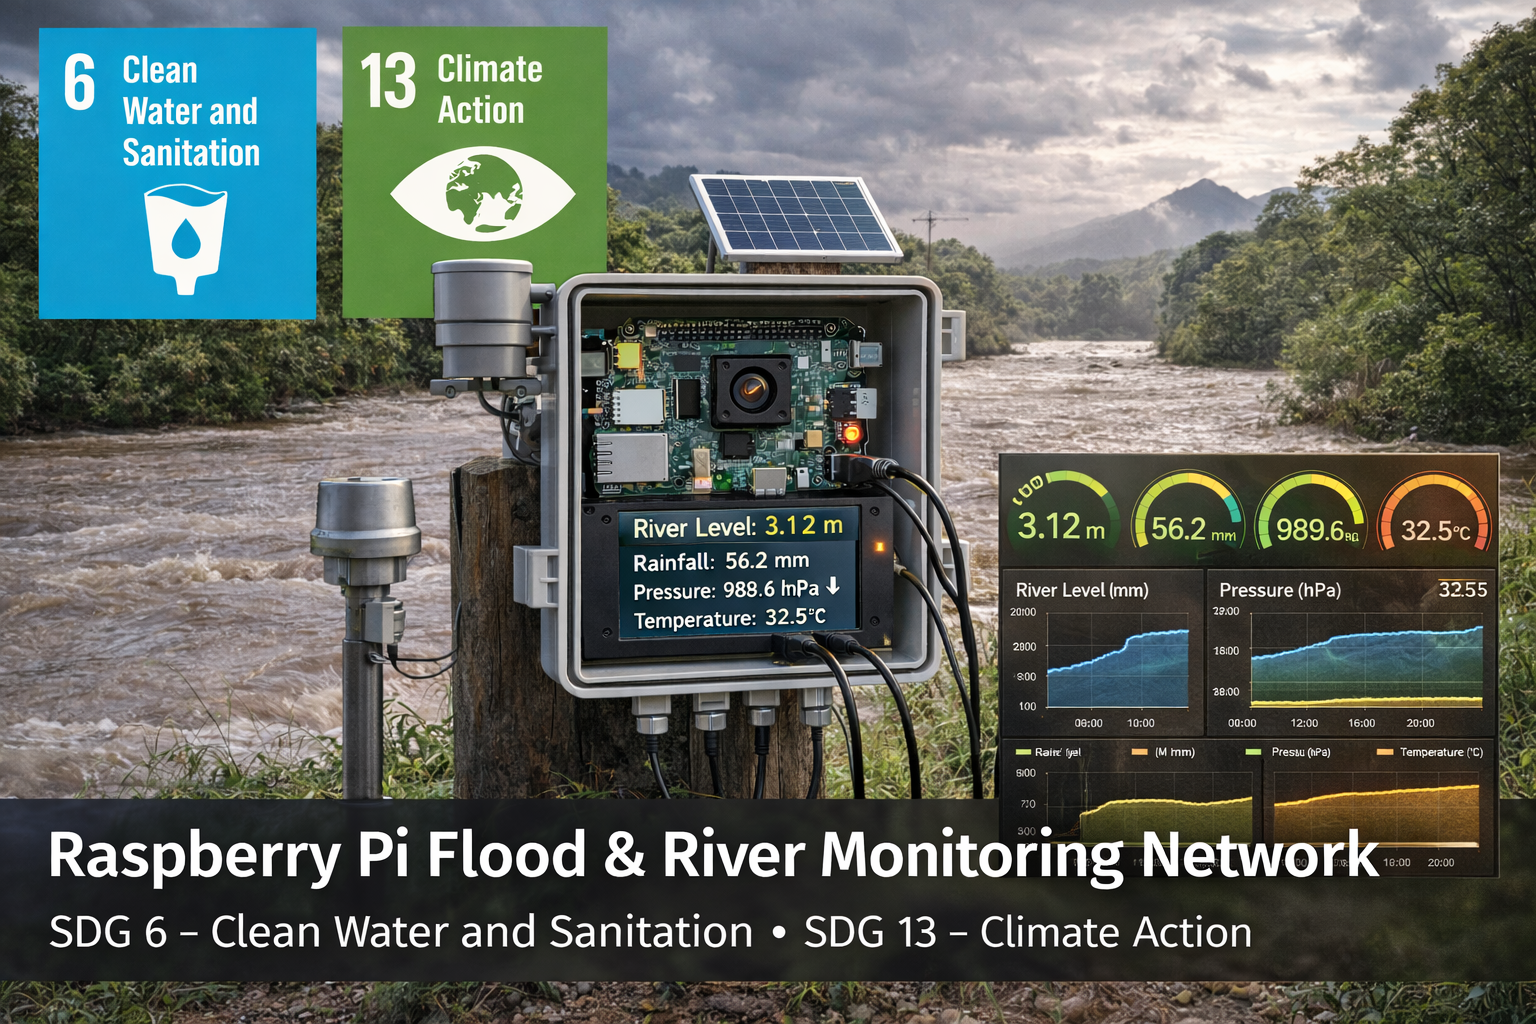
Flood resilience depends on reliable hydrological observation. A Raspberry Pi flood monitoring system can combine river-level sensing, rainfall monitoring, atmospheric data, local logging, and automated alert logic to detect emerging flood risk and support earlier response aligned with SDG 6: Clean Water and Sanitation and SDG 13: Climate Action.
Flooding is one of the most common and destructive environmental hazards worldwide. Rising river levels, intense rainfall, saturated soils, inadequate drainage infrastructure, stormwater overload, coastal or storm-surge conditions, land-use change, and climate-driven rainfall extremes can lead to rapid inundation that threatens communities, ecosystems, transportation systems, housing, agriculture, public health, and critical infrastructure.
This project demonstrates how to build a Raspberry Pi-based flood monitoring station capable of collecting hydrological and atmospheric data, storing local observations, and supporting threshold-based warning logic. While simple, the design reflects a broader sustainability principle: disaster risk becomes easier to manage when environmental change can be measured continuously, interpreted early, and communicated responsibly.
The project should not be treated as a certified public flood-warning system, official hydrological gauge, emergency alert network, flood forecast model, insurance or regulatory evidence system, or substitute for government flood monitoring and emergency-management services. Its purpose is educational and methodological: to show how water-level sensing, rainfall monitoring, edge computing, calibration, time-series logging, rate-of-rise detection, validation, and public-safety limits can work together in a hydrological monitoring workflow.
Main Library
Publications
Project Series
Raspberry Pi Projects
Related Topic
Environmental Monitoring
Related Topic
Freshwater Risk
Related Topic
Climate Boundary
This project also connects to broader site areas, including Environmental Monitoring Systems, Intelligent Infrastructure Systems, Freshwater Change and Earth System Risk, Climate Change as a Planetary Boundary, Sustainable Development Goals Within Planetary Boundaries, and Planetary Boundaries. In that wider context, this Raspberry Pi flood monitor is not only a maker project. It is a small prototype of the hydrological sensing, edge-computing, and alert infrastructure needed for climate adaptation, watershed stewardship, and disaster-risk reduction.
Abstract
This project presents a prototype Raspberry Pi flood monitoring system built around hydrological sensing, local data logging, threshold-based alert logic, and optional networked deployment. The platform measures river, stream, drainage-channel, or culvert water levels, monitors rainfall conditions, records supporting atmospheric variables, and stores observations for later analysis.
From an engineering perspective, the build demonstrates a compact edge-monitoring node for hydrological observation and flood-warning experimentation. From a sustainability perspective, it illustrates how low-cost distributed monitoring can strengthen climate adaptation, watershed awareness, local disaster preparedness, and responsible water-system governance.
The system is intentionally limited. It is not a certified public flood-warning system, official hydrological gauge, emergency alert network, hydraulic model, or substitute for government flood monitoring and emergency-management services. Its value is educational and methodological: it shows how local hydrological signals can be measured, logged, interpreted, and reviewed while preserving uncertainty, calibration needs, field limits, and public-safety boundaries.
SDG Alignment: Clean Water, Climate Action, Resilient Communities, and Infrastructure
This project aligns most directly with SDG 6: Clean Water and Sanitation and SDG 13: Climate Action. It supports water-resource monitoring by making river, stream, drainage, stormwater, and watershed conditions more visible over time. It supports climate action by strengthening resilience to flood hazards and improving the ability of communities to observe climate-related hydrological events.
The project also connects to SDG 11: Sustainable Cities and Communities, SDG 9: Industry, Innovation and Infrastructure, and SDG 15: Life on Land. Flood preparedness is central to resilient urban and regional infrastructure, while floodplains, wetlands, watersheds, riparian corridors, soils, and terrestrial ecosystems are shaped by hydrological dynamics.
| Sustainable Development Goal | How the Project Relates | Project-Level Mechanism |
|---|---|---|
| SDG 6: Clean Water and Sanitation | Supports water-resource monitoring, watershed awareness, stormwater visibility, and hydrological data literacy. | Water-level sensing, rainfall measurement, rise-rate tracking, and local hydrological logging. |
| SDG 13: Climate Action | Strengthens resilience to climate-related flood hazards and extreme rainfall conditions. | Threshold logic, rainfall-runoff observation, early awareness, and distributed monitoring workflows. |
| SDG 11: Sustainable Cities and Communities | Supports disaster preparedness, resilient infrastructure, drainage awareness, and safer communities. | Monitoring of culverts, streams, urban drainage channels, and flood-prone infrastructure. |
| SDG 9: Industry, Innovation and Infrastructure | Demonstrates distributed sensing, edge analytics, resilient monitoring systems, and local data infrastructure. | Raspberry Pi node with water-level sensing, rainfall counting, SQLite logging, and dashboard-ready records. |
| SDG 15: Life on Land | Relates to floodplains, wetlands, riparian ecosystems, soils, and habitat conditions shaped by hydrology. | Hydrological observation that can support restoration, floodplain awareness, and ecological monitoring. |
The strongest SDG connection is the pairing of SDG 6 and SDG 13. Flooding is both a water-system issue and a climate-risk issue. Rainfall extremes, river-level variability, stormwater capacity, watershed condition, and drainage infrastructure all shape whether water becomes a managed resource or a destructive hazard.
The connection to SDG 11 matters because flood risk is experienced locally. Homes, roads, rail lines, schools, hospitals, power systems, wastewater systems, and emergency routes can all be affected by rapidly changing water levels. Monitoring does not eliminate risk, but it can improve visibility and preparedness.
The connection to SDG 9 appears because flood resilience increasingly depends on data infrastructure: gauges, sensors, communication networks, dashboards, edge analytics, maintenance procedures, and institutional workflows. A Raspberry Pi prototype helps make that infrastructure logic visible.
Because the Sustainable Development Goals are broad public frameworks, it is important not to overclaim. This project is not a complete flood-risk management system, not a public warning service, and not a substitute for official hydrological infrastructure. Its contribution is narrower and still meaningful: it teaches the measurement architecture behind responsible flood-risk observation.
Connections to Other Site Areas
This Raspberry Pi flood monitoring system belongs to a wider body of work on environmental sensing, water systems, and intelligent infrastructure. It connects directly to Environmental Monitoring Systems, where field sensors, river stations, weather data, telemetry, and environmental datasets become tools for understanding climate and ecological conditions.
It also connects to Intelligent Infrastructure Systems. Flood monitoring becomes more useful when sensing nodes can collect observations, store time-series records, detect threshold crossings, issue local alert states, and support dashboard-based decision-making.
At the planetary-boundary level, the project relates to Freshwater Change and Earth System Risk. Local flood monitoring does not describe the entire freshwater boundary, but it demonstrates a crucial principle: water systems become more governable when their flows, levels, variability, and extremes are measured consistently.
The project also connects to Climate Change as a Planetary Boundary because extreme rainfall, altered hydrological cycles, storm intensity, and flood risk are increasingly central to climate adaptation planning.
Why Flood Monitoring Systems Matter
Flood hazards often emerge from measurable environmental changes before damaging overflow occurs. River levels rise, rainfall accumulates, soils saturate, stormwater systems reach capacity, and atmospheric conditions shift. Monitoring systems matter because they transform these precursors into actionable information.
A Raspberry Pi-based flood monitoring node matters for several reasons:
- it supports continuous local observation rather than only occasional manual checks
- it helps identify emerging risk before full flood onset
- it can scale across multiple sites in a watershed or drainage system
- it provides a foundation for threshold-based alerts and later predictive analytics
- it can support classrooms, community science, local resilience projects, and early-stage hydrological research
The platform is not a replacement for national hydrological infrastructure, certified emergency alert networks, or official flood-warning systems. Its value is that it translates the logic of flood monitoring into a reproducible edge-computing system that is accessible to researchers, communities, and educators.
The deeper value is time. A flood-monitoring system can make it possible to see a river or drainage channel changing before the most dangerous impacts appear. That lead time may support inspection, preparation, equipment movement, route awareness, or consultation of official warnings. But the chain from measurement to public action must be handled responsibly because flood warning is a high-stakes public-safety function.
Hydrological Indicators of Flood Risk
Flood events rarely occur without environmental signals. Hydrological and atmospheric indicators often reveal increasing risk before floodwaters reach dangerous levels.
Important flood indicators include:
- rapid increases in river, stream, or channel water level
- high rainfall intensity or prolonged precipitation
- soil saturation and increasing surface runoff
- changes in atmospheric pressure during storm systems
- blocked drainage or stormwater system overload
- storm surge conditions in coastal regions
- upstream rainfall that may affect downstream river levels after a delay
- snowmelt or frozen-ground conditions in colder regions
- land-cover changes that increase runoff and reduce infiltration
Monitoring these indicators continuously allows environmental monitoring systems to detect conditions that may precede dangerous flooding. Early detection gives communities, infrastructure managers, researchers, watershed groups, and emergency responders more time to understand changing conditions.
The most useful flood-monitoring systems do not rely on one signal alone. Water level, rainfall intensity, rate of rise, soil saturation, upstream conditions, drainage capacity, and official forecast context all contribute to the interpretation of risk.
Watershed Context: Why Location and Upstream Conditions Matter
Flood risk is spatial. A local sensor measures conditions at one point, but flooding is shaped by the entire watershed or drainage network feeding that point.
A small creek can rise quickly after intense rainfall over a steep or urbanized catchment. A large river may respond more slowly to upstream rainfall. A culvert can flood because of debris even if upstream water levels are not historically extreme. An urban street can flood because storm drains are undersized or blocked. A coastal site may flood from storm surge, high tide, rainfall, and drainage backup at the same time.
For this reason, a Raspberry Pi flood monitoring station should document:
- monitoring location and site type
- river, stream, culvert, drainage channel, or floodplain context
- sensor mount height and reference point
- upstream drainage area where known
- local infrastructure constraints such as culverts, bridges, and storm drains
- nearby official gauge or weather station references where available
- historical high-water marks or local flood observations where responsibly documented
Without this context, water-level readings can be misleading. A water level value is not meaningful by itself; it becomes meaningful when connected to the site, reference height, historical behavior, and consequences of overflow.
System Overview
The Raspberry Pi flood monitoring system measures distance to water, converts that distance into estimated water level, counts rainfall events, records supporting environmental data, stores observations in a local database, and applies transparent risk rules.
The system can include:
- ultrasonic or weather-rated distance sensor for water-level monitoring
- tipping-bucket rain gauge for rainfall accumulation and intensity
- BME280 environmental sensor for temperature, humidity, and pressure
- optional soil moisture sensor for saturation context
- optional solar power and battery system for field deployment
- SQLite database logging
- threshold-based flood-risk logic
- rate-of-rise analysis
- dashboard export or local status display
The key design pattern is hydrological visibility. The system does not predict floods with authority. It observes local water conditions, tracks change over time, and demonstrates how edge-computing tools can support early awareness.
System Requirements
A flood monitoring prototype becomes useful only when its requirements are explicit. It must measure water level consistently, preserve reference geometry, count rainfall reliably, store observations with metadata, apply transparent rules, and avoid false authority.
| Requirement | Design Target | Reason |
|---|---|---|
| Stable reference geometry | Mount the water-level sensor at a fixed known height | Water-level estimates depend on the reference point remaining stable |
| Reliable distance readings | Use median filtering, timeout handling, and range checks | Water turbulence, debris, and echo errors can distort raw readings |
| Rainfall measurement | Count tipping-bucket pulses with debounce logic | Rainfall intensity helps interpret runoff and rising water levels |
| Time-series logging | Store UTC timestamps, sensor IDs, location IDs, and quality flags | Flood risk is meaningful as a trend over time |
| Rate-of-rise logic | Track how quickly water levels are changing | Rapid rise can matter before absolute thresholds are crossed |
| Public-safety limits | Label outputs as prototype observations, not official warnings | Flood warning requires validated systems and institutional authority |
| Field survivability | Protect hardware from water, debris, heat, corrosion, and power loss | Flood monitors must operate during harsh conditions |
These requirements frame the build as a hydrological monitoring node rather than a simple ultrasonic sensor project. It must measure, document, analyze, and communicate responsibly.
System Architecture
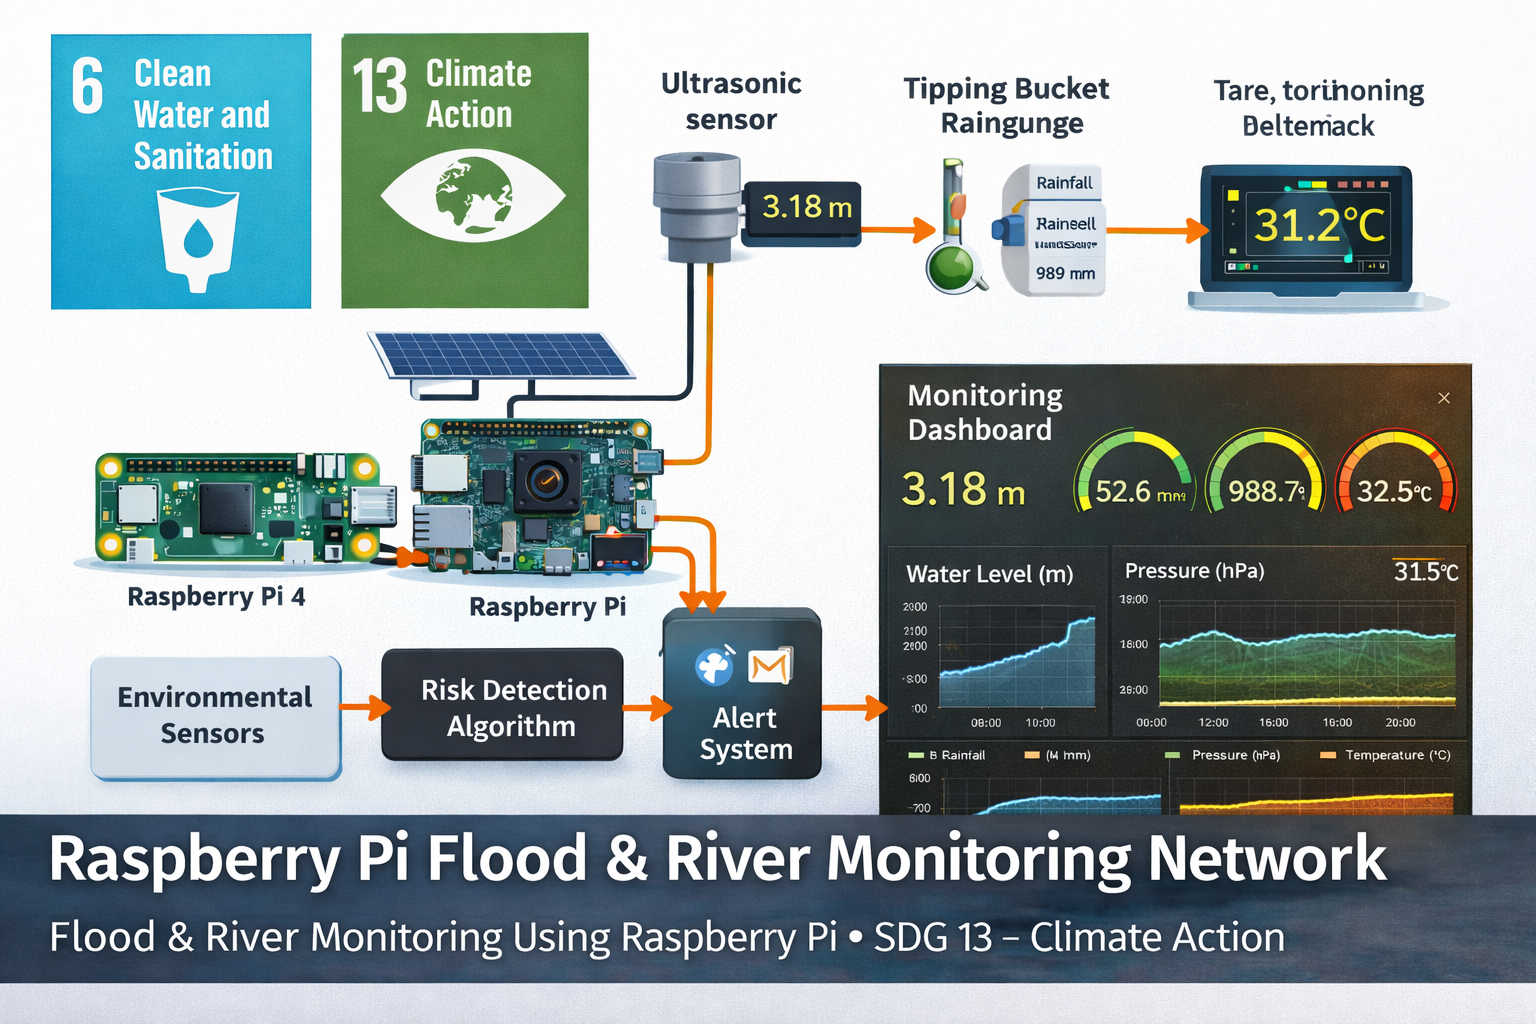
A Raspberry Pi flood monitoring station combines environmental sensors with edge computing, local data storage, and automated alert logic.
Typical architecture:
Water Level Sensors → Raspberry Pi Edge Processing → Flood Risk Detection → Alerts and Data StorageMultiple monitoring stations can be deployed along river systems, streams, culverts, storm drains, drainage basins, or flood-prone areas. Environmental measurements from each station may be transmitted to a central server where regional flood conditions can be analyzed. This distributed architecture allows monitoring networks to scale across watersheds and urban drainage systems.
At a systems level, the flood-monitoring station can be understood as five layers:
- Sensing layer: water-level, rainfall, temperature, humidity, pressure, and optional soil-moisture sensors
- Acquisition layer: GPIO, I2C, pulse counting, or serial interfaces on the Raspberry Pi
- Storage layer: CSV, SQLite, or time-series database logging
- Analytics layer: threshold logic, trend detection, rate-of-rise checks, persistence rules, and anomaly detection
- Communication layer: local dashboard, SMS/email test alerts, network export, or cloud synchronization
Public warning systems require additional layers that this prototype does not provide: official data integration, redundancy, professional hydrological models, emergency-management governance, alert approval, communication reliability, and institutional accountability.
Environmental Sensors for Flood Monitoring
Flood monitoring systems often integrate several sensor types to capture hydrological and atmospheric conditions.
Common sensors include:
- Ultrasonic water-level sensors: estimate distance to the water surface from a fixed mount.
- Weather-rated distance sensors: improve field reliability compared with exposed hobby sensors.
- Tipping-bucket rainfall gauges: count rainfall increments over time.
- Soil moisture sensors: indicate saturation conditions that can increase runoff risk.
- BME280 or similar atmospheric sensors: measure temperature, humidity, and barometric pressure.
- Pressure transducers: provide submerged water-level readings in more advanced deployments.
- Staff gauges: provide manual reference readings for calibration and validation.
Combining multiple environmental measurements improves the reliability of flood detection systems and allows monitoring algorithms to identify more complex environmental patterns associated with flood events. It also helps separate measurement artifacts from real hydrological change.
Bill of Materials
- Raspberry Pi 4, Raspberry Pi 5, or Raspberry Pi Zero 2 W
- ultrasonic distance sensor such as HC-SR04 for indoor/prototype tests or a weather-rated equivalent for field use
- tipping-bucket rain gauge
- BME280 environmental sensor
- optional soil moisture sensor
- optional staff gauge or fixed reference marker for validation
- solar power supply with battery storage for field deployment
- microSD card with adequate endurance for logging
- weather-resistant enclosure
- mounting bracket or fixed reference structure
- network connection through Wi-Fi, Ethernet, cellular, or LoRa where appropriate
- cable glands, drip loops, strain relief, fuses, and waterproof connectors
Outdoor monitoring stations often operate in remote locations and must run continuously using resilient power systems. Weather-resistant enclosures, stable mounting, cable strain relief, protective sensor placement, and safe field access are essential for long-term reliability.
Engineering Specifications
| Parameter | Reference Design |
|---|---|
| Compute platform | Raspberry Pi 4, Raspberry Pi 5, or Raspberry Pi Zero 2 W |
| Primary hydrological sensor | Ultrasonic distance sensor for prototype water-level estimation; weather-rated sensor preferred for field use |
| Rainfall sensing | Tipping-bucket rain gauge |
| Atmospheric sensing | BME280 for temperature, humidity, and pressure |
| Optional sensing | Soil moisture, pressure transducer, staff gauge reference, camera, solar power telemetry |
| Storage options | CSV, SQLite, InfluxDB, or dashboard export |
| Alert mode | Threshold-based and trend-based flood-risk detection |
| Deployment mode | Distributed flood-monitoring node |
| Target scope | Educational, prototype, and experimental flood-risk observation |
| Public-safety scope | Prototype awareness only; not an official flood warning system |
The reference design is modular. It can begin with water-level measurement and rainfall counting, then expand to atmospheric context, rate-of-rise analysis, dashboards, distributed networks, solar power, and more robust field sensors.
Measurement Principle: Water Level, Rainfall, Rise Rate, and Flood Visibility
A flood monitoring station does not measure “flood risk” directly. It measures environmental signals associated with changing hydrological conditions. Water level, rainfall intensity, water-level rise rate, soil saturation, and upstream rainfall are all partial indicators. Their meaning depends on watershed size, drainage capacity, topography, land cover, infrastructure, season, and local flood history.
An ultrasonic sensor estimates distance between the sensor and the water surface. If the sensor is mounted above the channel, rising water reduces the measured distance. The software converts that distance into estimated water level relative to a fixed reference. A rainfall gauge counts bucket tips and converts them into rainfall depth. The Raspberry Pi stores these readings and applies rules that classify conditions as normal, watch, or warning.
The measurement principle is therefore: measure water-level geometry, count rainfall events, preserve timestamps and metadata, apply filtering and quality checks, calculate rate of rise, compare readings with site-specific thresholds, and interpret results as prototype awareness rather than official warnings.
Flood monitoring depends heavily on reference points. If the sensor mount shifts, the bridge deck reference changes, the channel bed erodes, or debris changes the water surface, the numbers may still look precise while becoming less meaningful. A responsible deployment treats sensor geometry as part of the data system.
Mathematical Lens: From Water-Level Signals to Flood Awareness
The Raspberry Pi flood monitoring system can be understood as a time-series hydrological classification system. It transforms distance readings, rainfall counts, and timestamps into water-level estimates, rise rates, and alert states.
H_t = H_{\mathrm{mount}} – d_t
\]
Interpretation: Estimated water level \(H_t\) is calculated from fixed sensor mount height \(H_{\mathrm{mount}}\) minus measured distance to water \(d_t\).
This calculation is simple, but it depends on stable sensor mounting and a clearly defined reference height.
r_t=\frac{H_t-H_{t-k}}{\Delta t}
\]
Interpretation: Rate of rise \(r_t\) estimates how quickly water level is increasing over a time interval.
Rate of rise is often as important as absolute level. A lower water level rising quickly may deserve attention before a threshold is crossed.
R = n_{\mathrm{tips}} \cdot c_{\mathrm{tip}}
\]
Interpretation: Rainfall accumulation \(R\) can be estimated from tipping-bucket count \(n_{\mathrm{tips}}\) multiplied by the gauge calibration \(c_{\mathrm{tip}}\).
Rainfall intensity can be calculated by dividing rainfall accumulation by the interval over which it was measured.
A_t =
\begin{cases}
\text{warning}, & H_t \geq T_{\mathrm{warning}} \\
\text{watch}, & H_t \geq T_{\mathrm{watch}} \\
\text{watch}, & r_t \geq T_{\mathrm{rise}} \\
\text{watch}, & R_{1h} \geq T_{\mathrm{rain}} \\
\text{normal}, & \text{otherwise}
\end{cases}
\]
Interpretation: A simple flood alert state can combine absolute water level, rate of rise, and recent rainfall intensity.
These thresholds should be treated as configurable site parameters, not universal constants.
Q_t =
\begin{cases}
\text{suspect}, & d_t \notin [d_{\min}, d_{\max}] \\
\text{suspect}, & |H_t-H_{t-1}| > T_{\mathrm{jump}} \\
\text{valid}, & \text{otherwise}
\end{cases}
\]
Interpretation: Quality flags can mark readings as suspect when they fall outside expected ranges or jump implausibly between samples.
The mathematical lens shows why flood monitoring is more than reading an ultrasonic sensor. It requires reference geometry, filtering, rainfall accumulation, trend detection, quality flags, and local threshold design.
Measuring River Water Levels
Ultrasonic sensors estimate the distance between the sensor and the water surface by measuring the time required for a sound pulse to travel to the water and return to the sensor.
The HC-SR04 emits a high-frequency acoustic signal and calculates distance using the speed of sound in air. In a flood-monitoring system, the sensor is mounted above the water surface. The measured distance is then converted into water height using the known sensor mount height.
The following Python example includes timeout handling, repeated sampling, median filtering, and water-level conversion.
"""
Raspberry Pi Flood Monitoring System
Ultrasonic Water-Level Reader

Measures:
- distance from sensor to water surface
- estimated water level relative to a reference height

Notes:
- This is prototype code for education and experimental monitoring.
- Outdoor flood monitoring requires weather-rated sensors and stable mounting.
- Do not use this alone as a public flood-warning system.
"""

import statistics
import time
from dataclasses import dataclass

import RPi.GPIO as GPIO


TRIG_PIN = 23
ECHO_PIN = 24

# Known height from sensor face to reference point, in centimeters.
# Example: sensor mounted 250 cm above the riverbed reference.
SENSOR_MOUNT_HEIGHT_CM = 250.0

# Timeout prevents the program from hanging if no echo is detected.
ECHO_TIMEOUT_SECONDS = 0.03


@dataclass
class WaterLevelReading:
    """Structured container for one water-level observation."""
    distance_to_water_cm: float
    estimated_water_level_cm: float


def setup_gpio() -> None:
    """Configure GPIO pins for the ultrasonic distance sensor."""
    GPIO.setmode(GPIO.BCM)
    GPIO.setup(TRIG_PIN, GPIO.OUT)
    GPIO.setup(ECHO_PIN, GPIO.IN)
    GPIO.output(TRIG_PIN, False)
    time.sleep(0.2)


def measure_distance_cm() -> float | None:
    """
    Measure distance using ultrasonic echo timing.

    Returns None if the echo pulse times out.
    """
    GPIO.output(TRIG_PIN, True)
    time.sleep(0.00001)
    GPIO.output(TRIG_PIN, False)

    start_time = time.time()
    timeout_start = start_time

    while GPIO.input(ECHO_PIN) == 0:
        start_time = time.time()

        if start_time - timeout_start > ECHO_TIMEOUT_SECONDS:
            return None

    stop_time = time.time()
    timeout_start = stop_time

    while GPIO.input(ECHO_PIN) == 1:
        stop_time = time.time()

        if stop_time - timeout_start > ECHO_TIMEOUT_SECONDS:
            return None

    elapsed_seconds = stop_time - start_time

    # Speed of sound is approximately 34300 cm/s at 20 C.
    distance_cm = (elapsed_seconds * 34300.0) / 2.0

    return distance_cm


def filtered_distance_cm(sample_count: int = 7) -> float | None:
    """
    Collect multiple readings and return the median.

    Median filtering helps reduce the effect of occasional noisy reflections.
    """
    samples = []

    for _ in range(sample_count):
        distance = measure_distance_cm()

        if distance is not None:
            samples.append(distance)

        time.sleep(0.1)

    if not samples:
        return None

    return statistics.median(samples)


def estimate_water_level(distance_to_water_cm: float) -> WaterLevelReading:
    """
    Convert sensor-to-water distance into estimated water level.

    Water level rises as distance to water decreases.
    """
    water_level_cm = SENSOR_MOUNT_HEIGHT_CM - distance_to_water_cm

    return WaterLevelReading(
        distance_to_water_cm=distance_to_water_cm,
        estimated_water_level_cm=water_level_cm,
    )


if __name__ == "__main__":
    try:
        setup_gpio()

        while True:
            distance = filtered_distance_cm()

            if distance is None:
                print("No valid ultrasonic reading.")
            else:
                reading = estimate_water_level(distance)
                print(
                    f"Distance to water: {reading.distance_to_water_cm:.1f} cm | "
                    f"Estimated water level: {reading.estimated_water_level_cm:.1f} cm"
                )

            time.sleep(10)

    finally:
        GPIO.cleanup()
For field use, a weather-rated distance sensor or pressure transducer may be more appropriate than a hobby ultrasonic module. The HC-SR04 is useful for learning the measurement logic but is not designed as a rugged hydrological instrument.
Sensor Calibration
To convert ultrasonic distance measurements into river-height estimates, the system must account for the installation height of the sensor above the water surface, riverbed, channel floor, bridge deck, culvert reference, or another fixed reference point.
If the sensor is mounted at a known height above the reference surface, water height can be estimated using:
\text{Water Height} = \text{Sensor Mount Height} – \text{Measured Distance}
\]
Interpretation: Water level rises as the measured distance from the sensor to the water surface decreases.
Calibration is critical because environmental conditions such as temperature, humidity, wind, turbulence, sensor angle, surface reflectivity, debris, and mounting movement can affect ultrasonic measurements. Regular calibration improves long-term reliability in field deployments.
A practical calibration process should include:
- measure the physical sensor mount height from a fixed reference point
- record several ultrasonic readings under stable water conditions
- compare readings against a manual staff gauge or known water-level reference
- adjust mount-height or offset values in the code
- repeat after storms, maintenance, sensor movement, enclosure changes, or suspected debris impact
Example Calibration Record
| Calibration Item | Reference | Sensor Reading | Adjustment | Notes |
|---|---|---|---|---|
| Mount height | Manual tape measurement | 250.0 cm | Set mount height in code | Measured from fixed bridge-deck reference |
| Stable water level | Staff gauge: 106.0 cm | 105.2 cm | Offset +0.8 cm | Low turbulence during test |
| Rain gauge | Manual pour test | 10 tips | Confirm mm-per-tip calibration | Debounce verified |
| Post-storm check | Visual inspection | Sensor angle changed | Re-mount and recalibrate | Debris impact suspected |
A calibration record like this makes readings more interpretable and prevents precise-looking sensor outputs from being mistaken for validated hydrological measurements.
Handling Sensor Noise and Measurement Error
Environmental sensors often produce noisy measurements due to water surface turbulence, wind, wave reflections, rain, debris, temperature variation, insects, condensation, and changing sensor angles. Flood monitoring systems should not rely on a single raw reading.
Common filtering techniques include:
- Moving average smoothing: reduces short-term random variation.
- Median filtering: rejects occasional outlier echoes.
- Persistence rules: require risk conditions to persist for multiple readings before triggering an alert.
- Rate-of-rise checks: detect rapid increases even before a high-level threshold is crossed.
- Sensor-health flags: identify missing readings, implausible values, or stuck measurements.
These methods help stabilize water-level measurements and improve flood-detection reliability. They also reduce the risk that a single bad echo, passing debris, or temporary splash will trigger an alert state.
"""
Simple Water-Level Quality Check

Flags missing, out-of-range, or implausibly large jump readings.
"""


def quality_check_water_level(
    current_level_cm: float | None,
    previous_level_cm: float | None,
    min_level_cm: float = 0.0,
    max_level_cm: float = 300.0,
    max_jump_cm: float = 40.0,
) -> list[str]:
    """Return quality flags for a water-level reading."""
    flags = []

    if current_level_cm is None:
        return ["missing_water_level"]

    if current_level_cm < min_level_cm or current_level_cm > max_level_cm:
        flags.append("water_level_out_of_range")

    if previous_level_cm is not None:
        jump = abs(current_level_cm - previous_level_cm)

        if jump > max_jump_cm:
            flags.append("implausible_level_jump")

    return flags


if __name__ == "__main__":
    flags = quality_check_water_level(
        current_level_cm=118.0,
        previous_level_cm=112.0,
    )

    print(flags or ["valid"])
Quality flags should be stored in the data model. A dashboard should not display suspicious readings with the same confidence as validated readings.
Rainfall Monitoring
Flood risk is often strongly influenced by rainfall intensity. Tipping-bucket rain gauges measure precipitation by counting small bucket tips, each corresponding to a known amount of rainfall.
Rainfall accumulation data may be used to calculate:
- rainfall intensity
- cumulative precipitation
- short-term runoff risk
- storm-event duration
- upstream flood potential
The following Python example counts tipping-bucket pulses and converts them into rainfall totals.
"""
Raspberry Pi Rainfall Monitor
Tipping-Bucket Gauge Example

Counts bucket tips and estimates rainfall accumulation.

Notes:
- The millimeters-per-tip value depends on the rain gauge model.
- Debouncing is important because switch contacts can bounce.
"""

import time
from dataclasses import dataclass

import RPi.GPIO as GPIO


RAIN_PIN = 17

# Example calibration value. Replace with the value for your rain gauge.
MM_PER_TIP = 0.2794

# Debounce interval in milliseconds.
BOUNCE_TIME_MS = 300


@dataclass
class RainfallState:
    """Tracks rainfall accumulation from tipping-bucket pulses."""
    tip_count: int = 0

    @property
    def rainfall_mm(self) -> float:
        return self.tip_count * MM_PER_TIP


rainfall_state = RainfallState()


def rain_tip_callback(channel: int) -> None:
    """Increment rainfall count whenever the bucket tips."""
    rainfall_state.tip_count += 1


def setup_rain_gauge() -> None:
    """Configure GPIO interrupt for rain gauge pulses."""
    GPIO.setmode(GPIO.BCM)
    GPIO.setup(RAIN_PIN, GPIO.IN, pull_up_down=GPIO.PUD_UP)

    GPIO.add_event_detect(
        RAIN_PIN,
        GPIO.FALLING,
        callback=rain_tip_callback,
        bouncetime=BOUNCE_TIME_MS,
    )


if __name__ == "__main__":
    try:
        setup_rain_gauge()

        print("Rainfall monitor started.")

        while True:
            print(
                f"Tips: {rainfall_state.tip_count} | "
                f"Rainfall: {rainfall_state.rainfall_mm:.2f} mm"
            )

            time.sleep(60)

    finally:
        GPIO.cleanup()
When rainfall exceeds predefined thresholds, monitoring systems may increase measurement frequency or trigger alerts. Rainfall data becomes especially useful when combined with water-level trends, soil-saturation indicators, upstream data, and drainage-system context.
Logging Flood Monitoring Data
Flood monitoring systems become more useful when observations are logged over time. A lightweight SQLite database allows water levels, rainfall totals, alert states, quality flags, and sensor metadata to be stored in a structured way.
"""
SQLite Logger for Raspberry Pi Flood Monitoring

Stores timestamped flood-monitoring observations:
- estimated water level
- distance to water surface
- rainfall accumulation
- rise rate
- flood risk status
- quality flags

The resulting dataset can be analyzed with Python, R, SQL, or dashboards.
"""

import sqlite3
from datetime import datetime, timezone
from pathlib import Path


DATABASE_PATH = Path("flood_monitoring.db")


def create_connection(db_path: Path = DATABASE_PATH) -> sqlite3.Connection:
    """Create and return a SQLite database connection."""
    return sqlite3.connect(db_path)


def initialize_database(conn: sqlite3.Connection) -> None:
    """Create the flood_readings table if it does not already exist."""
    cursor = conn.cursor()

    cursor.execute("""
        CREATE TABLE IF NOT EXISTS flood_readings (
            id INTEGER PRIMARY KEY AUTOINCREMENT,
            timestamp_utc TEXT NOT NULL,
            distance_to_water_cm REAL,
            water_level_cm REAL,
            rainfall_mm REAL,
            rainfall_mm_last_hour REAL,
            rise_rate_cm_per_hour REAL,
            alert_level TEXT DEFAULT 'normal',
            sensor_id TEXT DEFAULT 'flood_node_01',
            location_id TEXT DEFAULT 'prototype_site',
            quality_flag TEXT DEFAULT 'unchecked',
            notes TEXT DEFAULT ''
        )
    """)

    conn.commit()


def log_flood_reading(
    conn: sqlite3.Connection,
    distance_to_water_cm: float | None,
    water_level_cm: float | None,
    rainfall_mm: float | None,
    rainfall_mm_last_hour: float | None,
    rise_rate_cm_per_hour: float | None,
    alert_level: str,
    sensor_id: str = "flood_node_01",
    location_id: str = "prototype_site",
    quality_flag: str = "unchecked",
    notes: str = "",
) -> None:
    """Insert one flood-monitoring observation into SQLite."""
    cursor = conn.cursor()

    timestamp_utc = datetime.now(timezone.utc).isoformat()

    cursor.execute("""
        INSERT INTO flood_readings (
            timestamp_utc,
            distance_to_water_cm,
            water_level_cm,
            rainfall_mm,
            rainfall_mm_last_hour,
            rise_rate_cm_per_hour,
            alert_level,
            sensor_id,
            location_id,
            quality_flag,
            notes
        )
        VALUES (?, ?, ?, ?, ?, ?, ?, ?, ?, ?, ?)
    """, (
        timestamp_utc,
        distance_to_water_cm,
        water_level_cm,
        rainfall_mm,
        rainfall_mm_last_hour,
        rise_rate_cm_per_hour,
        alert_level,
        sensor_id,
        location_id,
        quality_flag,
        notes,
    ))

    conn.commit()


if __name__ == "__main__":
    conn = create_connection()
    initialize_database(conn)

    # Example row. Replace these values with live sensor readings.
    log_flood_reading(
        conn=conn,
        distance_to_water_cm=142.5,
        water_level_cm=107.5,
        rainfall_mm=18.2,
        rainfall_mm_last_hour=12.4,
        rise_rate_cm_per_hour=8.5,
        alert_level="watch",
        quality_flag="demo",
        notes="example flood-monitoring observation",
    )

    conn.close()
Over time, the resulting dataset can support trend review, alert validation, dashboard display, manual comparison with staff gauges, and analysis of rainfall-runoff behavior.
Flood Monitoring Data Model
A flood monitoring system should store more than the latest water level. It should preserve distance readings, converted water levels, rainfall context, rise rates, alert state, sensor identity, location ID, quality flags, and field notes.
| Field | Example | Purpose |
|---|---|---|
| timestamp_utc | 2026-05-28T09:15:00Z | Provides a consistent time reference for hydrological analysis |
| location_id | creek_crossing_02 | Identifies the monitoring site without requiring public coordinates |
| sensor_id | flood_node_01 | Links readings to specific hardware |
| distance_to_water_cm | 142.5 | Stores raw distance-to-surface estimate for debugging and recalculation |
| water_level_cm | 107.5 | Stores converted water level relative to the chosen reference |
| rainfall_mm_last_hour | 12.4 | Supports rainfall intensity and runoff interpretation |
| rise_rate_cm_per_hour | 8.5 | Supports trend and rapid-rise detection |
| alert_level | watch | Records prototype risk state |
| quality_flag | valid | Marks readings as valid, suspect, demo, missing, or calibration-needed |
| notes | debris near sensor mount | Preserves field and maintenance context |
A clear data model helps make the system auditable. When an alert occurs, users should be able to see which readings, thresholds, quality flags, and field notes produced the alert state.
Flood Risk Detection Logic
Flood detection algorithms typically combine multiple environmental signals. The simplest systems use threshold logic. More useful systems also consider persistence, rainfall intensity, and rate of water-level rise.
"""
Threshold-Based Flood Alert Logic

Combines water level, rainfall, and rate-of-rise indicators into a simple
alert state.

This is prototype logic. Real public warning systems require professional
hydrological modeling, validation, redundancy, and official governance.
"""

from dataclasses import dataclass


@dataclass
class FloodInputs:
    """Input values used by the flood alert classifier."""
    water_level_cm: float
    rainfall_mm_last_hour: float
    rise_rate_cm_per_hour: float


@dataclass
class FloodThresholds:
    """Local thresholds that should be calibrated to the site."""
    watch_level_cm: float = 100.0
    warning_level_cm: float = 130.0
    rainfall_watch_mm: float = 20.0
    rapid_rise_cm_per_hour: float = 15.0


def classify_flood_risk(
    inputs: FloodInputs,
    thresholds: FloodThresholds = FloodThresholds(),
) -> str:
    """
    Classify flood risk using water level, rainfall, and rise-rate signals.

    Returns:
    - normal
    - watch
    - warning
    """
    if inputs.water_level_cm >= thresholds.warning_level_cm:
        return "warning"

    if inputs.water_level_cm >= thresholds.watch_level_cm:
        return "watch"

    if inputs.rainfall_mm_last_hour >= thresholds.rainfall_watch_mm:
        return "watch"

    if inputs.rise_rate_cm_per_hour >= thresholds.rapid_rise_cm_per_hour:
        return "watch"

    return "normal"


if __name__ == "__main__":
    current_inputs = FloodInputs(
        water_level_cm=118.0,
        rainfall_mm_last_hour=24.0,
        rise_rate_cm_per_hour=9.5,
    )

    risk = classify_flood_risk(current_inputs)
    print(f"Flood alert level: {risk}")
Combining rainfall data with water-level measurements improves flood detection reliability and reduces false alarms. More advanced systems may incorporate upstream sensor data, persistence rules, hydraulic models, weather forecasts, watershed characteristics, and historical flood records.
For public-facing dashboards, labels should remain careful. “Prototype watch condition detected” is safer than “flood warning” unless the system is part of an official, validated, governed warning program.
Persistence Rules, False Alarms, and Alert Stability
Flood monitoring systems must manage both false positives and false negatives. A false positive can create unnecessary alarm or cause users to ignore future alerts. A false negative can create misplaced confidence during a real hazard. Persistence rules help stabilize alert logic by requiring conditions to remain elevated for more than one reading before escalation.
"""
Persistence-Based Alert Stabilizer

Requires multiple consecutive elevated readings before escalating an alert.
This helps reduce false alarms from noisy sensor readings.
"""

from collections import deque


ALERT_PRIORITY = {
    "normal": 0,
    "watch": 1,
    "warning": 2,
}


class AlertStabilizer:
    """Stabilizes alert levels using a short history of classifications."""

    def __init__(self, required_count: int = 3):
        self.required_count = required_count
        self.history = deque(maxlen=required_count)

    def add_alert(self, alert_level: str) -> str:
        """Return stabilized alert level from recent classifications."""
        if alert_level not in ALERT_PRIORITY:
            alert_level = "normal"

        self.history.append(alert_level)

        if len(self.history) < self.required_count:
            return "normal"

        if all(level == "warning" for level in self.history):
            return "warning"

        if all(ALERT_PRIORITY[level] >= ALERT_PRIORITY["watch"] for level in self.history):
            return "watch"

        return "normal"


if __name__ == "__main__":
    stabilizer = AlertStabilizer(required_count=3)

    sequence = ["normal", "watch", "watch", "watch", "warning", "warning", "warning"]

    for level in sequence:
        print(level, "→", stabilizer.add_alert(level))
Persistence rules should be used carefully. They can reduce false alarms, but they can also delay warnings. The appropriate logic depends on the hazard, site conditions, sensor reliability, and intended use.
Distributed Flood Monitoring Networks
Individual monitoring stations can be connected into distributed monitoring networks. Multiple Raspberry Pi stations may transmit environmental data to a centralized database or dashboard.
Applications include:
- river basin monitoring
- urban drainage monitoring
- community flood early-warning experiments
- agricultural water management
- culvert and stormwater infrastructure monitoring
- campus, park, or municipal resilience projects
Distributed networks improve regional flood awareness and enable more coordinated emergency response. They also create richer data records for understanding how rainfall, drainage capacity, land cover, infrastructure, and water-level response vary across different parts of a watershed.
Network design should standardize station IDs, timestamps, units, quality flags, threshold documentation, sensor metadata, and maintenance records. Without shared conventions, comparing data across stations becomes difficult and error-prone.
AI and Predictive Flood Detection
Machine learning models can analyze historical environmental data to identify patterns associated with flood events.
Potential applications include:
- predicting flood probability
- analyzing rainfall-runoff relationships
- detecting abnormal water-level trends
- predicting river overflow conditions
- classifying storm-event risk
- identifying sensor drift or sensor failure
The following lightweight example tracks rate of rise and flags rapid changes. It is not a flood forecast, but it demonstrates how time-series logic can detect potentially important hydrological change.
"""
Water-Level Trend Detector

Calculates approximate water-level rise rate from recent observations.
This is a lightweight trend heuristic for prototype monitoring systems.
"""

from collections import deque
from dataclasses import dataclass


@dataclass
class LevelObservation:
    """One timestamped water-level observation."""
    timestamp_seconds: float
    water_level_cm: float


class WaterLevelTrendDetector:
    """Tracks recent water levels and estimates rate of rise."""

    def __init__(self, max_observations: int = 12):
        self.observations = deque(maxlen=max_observations)

    def add_observation(self, timestamp_seconds: float, water_level_cm: float) -> dict:
        """Add an observation and return rate-of-rise diagnostics."""
        self.observations.append(
            LevelObservation(
                timestamp_seconds=timestamp_seconds,
                water_level_cm=water_level_cm,
            )
        )

        if len(self.observations) < 2:
            return {
                "rise_rate_cm_per_hour": 0.0,
                "rapid_rise": False,
            }

        first = self.observations[0]
        last = self.observations[-1]

        elapsed_hours = (last.timestamp_seconds - first.timestamp_seconds) / 3600.0

        if elapsed_hours <= 0:
            return {
                "rise_rate_cm_per_hour": 0.0,
                "rapid_rise": False,
            }

        level_change_cm = last.water_level_cm - first.water_level_cm
        rise_rate = level_change_cm / elapsed_hours

        return {
            "rise_rate_cm_per_hour": rise_rate,
            "rapid_rise": rise_rate >= 15.0,
        }


if __name__ == "__main__":
    detector = WaterLevelTrendDetector()

    sample_data = [
        (0, 90),
        (600, 94),
        (1200, 99),
        (1800, 108),
    ]

    for timestamp, level in sample_data:
        result = detector.add_observation(timestamp, level)
        print(result)
Lightweight machine learning frameworks such as TensorFlow Lite can also run directly on Raspberry Pi devices, allowing predictive flood detection to occur at the edge. However, any public warning system requires careful validation, redundancy, and governance. Prototype analytics should be treated as decision support, not authoritative emergency warnings.
AI should also be evaluated against real local conditions. A model trained on one watershed may not generalize to another. Local channel geometry, drainage infrastructure, rainfall intensity, soil saturation, land cover, and upstream timing all influence flood response.
GitHub Repository
The article body includes the core water-level, rainfall, logging, flood-alert, persistence, quality-check, and trend-detection examples so the build remains readable. The full repository expands the project into a reproducible prototype package, including Python water-level sensing scripts, rainfall monitoring examples, SQLite logging utilities, threshold-based alert logic, anomaly detection scaffolding, deployment notes, and example flood-monitoring datasets.
Complete Code Repository
The full code distribution for this project, including Python water-level sensing scripts, rainfall monitoring examples, SQLite logging utilities, threshold-based alert logic, anomaly detection scaffolding, deployment notes, and example flood-monitoring datasets, is available on GitHub.
The repository contains the complete prototype build materials:
- Python sensor-reading scripts
- water-level and rainfall monitoring examples
- alert detection logic
- deployment notes
- example flood-monitoring datasets
- supporting environmental analysis files
Repository Structure
raspberry-pi-flood-monitoring-system/

README.md
LICENSE
requirements.txt

src/
  read_water_level.py
  rainfall_monitor.py
  log_flood_data.py
  flood_alerts.py
  trend_detection.py
  alert_stabilizer.py
  quality_checks.py
  anomaly_detection.py

docs/
  setup_guide.md
  deployment_notes.md
  sensor_notes.md
  calibration.md
  data_model.md
  alert_design.md
  safety_scope.md
  responsible_use.md

data/
  example_flood_readings.csv

hardware/
Engineers can clone the repository, fork the design, or download the complete project using GitHub’s Download ZIP feature. All materials are released under the MIT License to support reuse in research, education, community resilience, and prototype engineering work.
Engineering Notes
A few technical considerations are especially important in this build:
- Mounting geometry: water-level interpretation depends heavily on stable sensor placement and a fixed reference height.
- Environmental noise: wind, turbulence, rain, debris, and surface reflection can distort ultrasonic measurements.
- Power resilience: flood-monitoring nodes may be most critical during storms when power and network conditions are unstable.
- Threshold realism: warning levels should reflect local watershed behavior, not generic values.
- Network design: distributed systems benefit from consistent data structures, synchronized timestamps, and location metadata.
- Physical survivability: sensors must be mounted where they can observe flood risk without being washed away by the event they are measuring.
- Maintenance: debris, insects, corrosion, battery degradation, and enclosure leaks can degrade field performance over time.
- Public-safety boundaries: prototype alert states should not be presented as official flood warnings.
These considerations make the project more than a single-purpose sensor demo. It becomes a prototype hydrological resilience infrastructure node.
Deployment Scope and Public-Safety Limits
This prototype is designed for educational, experimental, and early-stage hydrological monitoring. It should not be treated as a certified public flood-warning system, emergency alert network, official hydrological gauge, or substitute for government flood monitoring.
Flood warning is a high-stakes public-safety function. Real-world warning systems require validated hydrological models, redundant sensors, robust communications, institutional responsibility, maintenance procedures, emergency protocols, legal authority, and coordination with public authorities.
These constraints do not make the prototype unhelpful. They define the appropriate scope of use: local observation, education, prototype analytics, watershed awareness, community science, and early-stage infrastructure experimentation. For public warning, regulatory, insurance, legal, or emergency-management decisions, use official hydrological data and professionally validated systems.
Any dashboard or alert state should clearly identify the system as a prototype. The interface should direct users to official flood, weather, and emergency-management sources for consequential decisions.
Failure Modes and Practical Risks
A useful flood-monitoring article should explain not only how the system works, but how it can fail. Hydrological monitoring is difficult because the field environment is exactly what becomes dangerous during the event being measured.
- Sensor washout: equipment may be damaged or removed by high water, debris, or flow forces.
- Mount movement: small shifts in sensor angle or mount height can distort water-level estimates.
- Echo errors: turbulence, rain, foam, debris, or waves can produce unstable ultrasonic readings.
- Blocked rain gauge: leaves, insects, ice, or debris can prevent accurate rainfall measurement.
- Power failure: storms can interrupt solar charging, batteries, or wired power exactly when monitoring matters most.
- Communication failure: flooding and storms can disrupt Wi-Fi, cellular, or backhaul links.
- False positives: noisy readings or poor thresholds can trigger unnecessary alert states.
- False negatives: bad placement, failed sensors, or overly high thresholds can miss rising risk.
- Threshold mismatch: generic thresholds may not reflect local hydrology or infrastructure consequences.
- Overreliance: users may trust a prototype more than official warnings or direct observations.
These risks do not make the project unusable. They make calibration, maintenance, quality flags, redundancy, careful communication, and public-safety boundaries essential. A prototype flood monitor should increase awareness without creating false authority.
Validation and Testing
To bring this project closer to engineering-grade documentation, validation should include:
- verify sensor communication with the BME280 and any rainfall or water-level sensors
- confirm that ultrasonic distance readings remain plausible under controlled conditions
- test calibration logic against known reference heights
- compare water-level readings with a staff gauge or manual reference where possible
- simulate threshold crossings for rainfall and flood-alert rules
- verify CSV or SQLite logging over repeated intervals
- test rate-of-rise calculations using known sample data
- test persistence rules for false-alarm reduction
- run extended trials to assess uptime and storage reliability
- document sensor placement, mount height, location metadata, and environmental conditions
If the system behaves inconsistently, the issue may be related to sensor placement, threshold selection, power instability, logging configuration, environmental interference, wiring, enclosure conditions, or mounting geometry rather than to the monitoring concept itself.
Example Validation Record
| Test | Expected Result | Observed Result | Likely Issue | Action |
|---|---|---|---|---|
| Known distance test | Ultrasonic reading matches reference distance | Reading within 2 cm | Acceptable for prototype context | Proceed to mount-height calibration |
| Staff gauge comparison | Water-level estimate matches manual reference | Estimate 3 cm high | Mount offset or sensor angle | Apply offset and document calibration |
| Rain gauge pulse test | Each tip counted once | Double counts during test | Switch bounce | Increase debounce and retest |
| Flood alert simulation | Watch/warning states trigger at thresholds | Expected states returned | None | Proceed to persistence testing |
| Storm trial | Station logs continuously through rain | Short data gap during outage | Power or network instability | Prioritize local logging and improve power backup |
Validation records like this help distinguish hydrological signal from sensor artifact. That distinction is essential in flood monitoring.
Suggested Performance Metrics
For a more rigorous evaluation, the system can be assessed using several simple metrics:
- sensor stability: consistency of repeated readings under unchanged conditions
- calibration accuracy: agreement between estimated water level and manual reference measurements
- alert reliability: whether warning logic triggers under intended conditions without excessive false alarms
- false-positive rate: how often alert states occur without meaningful hydrological change
- false-negative review: whether known water-level events occurred without a prototype alert signal
- logging reliability: whether observations are stored without loss over long runs
- uptime: how consistently the station continues operating without intervention
- data completeness: whether expected observations are captured across monitoring intervals
- operational usefulness: whether the collected data improves local understanding of flood risk
- maintenance burden: how often the station requires cleaning, recalibration, battery replacement, or enclosure repair
Even simple tracking of these metrics improves the project’s value as an experimental flood-monitoring platform. The goal is not merely to produce readings, but to produce readings that are stable, documented, interpretable, and properly bounded.
Field Deployment, Survivability, Power, and Maintenance
Field deployment is where flood monitoring becomes difficult. Flood sensors must operate in places where water, debris, mud, insects, freezing, heat, vandalism, unstable power, and communication outages can all occur.
Responsible deployment should address:
- mounting above expected flood debris and direct flow impact where possible
- stable reference geometry that can be rechecked after storms
- weather-resistant enclosures and cable glands
- drip loops, strain relief, and waterproof connectors
- solar power and battery sizing for stormy or cloudy periods
- local logging during network outages
- watchdog or service restart behavior
- safe field access procedures during and after storms
- cleaning schedule for rain gauges and sensors
- maintenance logs after heavy rainfall, flooding, debris impacts, or sensor movement
Maintenance is part of the monitoring system. A clogged rain gauge, shifted mount, loose wire, fouled sensor face, drained battery, or damaged enclosure can make the data misleading. Field notes should document every cleaning, inspection, calibration, relocation, and suspected anomaly.
Flood Monitoring and Sustainable Development
Flood monitoring systems contribute directly to sustainable development goals.
They support:
- SDG 6: Clean Water and Sanitation by improving water-resource monitoring and watershed awareness
- SDG 13: Climate Action by strengthening resilience to climate-related hazards
- SDG 11: Sustainable Cities and Communities by improving disaster preparedness and local infrastructure awareness
- SDG 9: Industry, Innovation and Infrastructure by demonstrating distributed sensing and resilient data infrastructure
Environmental monitoring infrastructure enables governments, researchers, schools, community organizations, watershed groups, and local institutions to detect environmental risks earlier and respond more effectively. Better data does not eliminate flood risk, but weak data makes preparedness far more difficult.
Flood monitoring also has a justice dimension. Flood exposure is shaped by housing location, infrastructure investment, drainage quality, land-use decisions, insurance access, emergency response capacity, and historical patterns of inequality. A responsible monitoring project should help make risk visible without shifting responsibility away from public institutions or affected communities.
The Future of Flood Monitoring Infrastructure
Next-generation flood monitoring systems will increasingly integrate:
- distributed sensor networks
- satellite observations
- weather radar
- machine learning models
- hydrological simulations
- real-time emergency alert systems
- open environmental databases
- community-based monitoring programs
Accessible computing platforms such as Raspberry Pi allow researchers, students, and communities to prototype systems capable of collecting valuable environmental data. These systems demonstrate how open hardware and open-source software can contribute to climate resilience and sustainable water management.
The long-term challenge is not merely collecting more flood data. It is building monitoring systems that are accurate enough to be useful, resilient enough to operate during storms, transparent enough to be trusted, and integrated enough to support real-world preparedness.
The most responsible future will combine community-scale observation with official hydrological networks, emergency-management institutions, public infrastructure investment, floodplain restoration, drainage planning, and climate adaptation policy. Sensors can make risk visible, but governance determines whether that visibility becomes protection.
Responsible Deployment
This prototype is appropriate for classrooms, makerspaces, watershed groups, resilience labs, environmental education, community science programs, and early-stage hydrological monitoring projects. It should not be used as an official flood-warning system, emergency alert service, evacuation trigger, insurance evidence platform, legal compliance tool, or public-safety decision system without professional validation and institutional governance.
Responsible deployment means matching the system to the consequence of error. A classroom demonstration can use simulated readings and known distances. A watershed awareness project can observe local conditions. A community pilot may support volunteer monitoring and education. A public flood-warning network requires formal responsibility, redundancy, official data integration, maintenance guarantees, hydraulic understanding, and emergency-management coordination.
A responsible version should include clear prototype labeling, official-source links, sensor-quality flags, data gaps, threshold documentation, maintenance logs, calibration records, alert explanations, and review after major rainfall or flood events.
The central rule is simple: flood monitoring prototypes should increase preparedness and water-system awareness without pretending to replace official public-safety systems.
Reproducibility
All code, documentation, and supporting build materials necessary to reproduce the prototype are included in the project repository. The design intentionally relies on widely available Raspberry Pi hardware, open-source Python libraries, and common environmental sensing components so that it can be rebuilt in classrooms, labs, makerspaces, community resilience programs, and independent flood-monitoring projects.
The system is intended as a reference implementation rather than a certified public warning network. Engineers adapting it for longer-term deployment should validate threshold design, enclosure resilience, power systems, data retention, sensor maintenance, mounting geometry, communications reliability, and local hydrological assumptions under real operating conditions.
For the rest of this project series, reproducibility should mean more than making code available. Each article should include a clear bill of materials, setup instructions, validation notes, data model, known failure modes, test procedure, responsible-use framing, and realistic statement of appropriate scope.
Conclusion
Building a Raspberry Pi flood monitoring system demonstrates how embedded sensing and local computation can support stronger hydrological resilience infrastructure. By combining river-level sensing, rainfall monitoring, atmospheric data, local logging, and threshold-based alert logic, the platform creates a flexible foundation for distributed flood-risk observation.
Although compact, the design reflects a broader sustainability principle: flood resilience depends on environmental visibility. When local hydrological conditions can be measured continuously and interpreted early, communities are better positioned to anticipate hazards and respond more effectively.
For classrooms, makerspaces, watershed groups, resilience labs, community science programs, and early-stage hydrological monitoring projects, this Raspberry Pi flood monitoring system provides a practical foundation for understanding how sensing, data infrastructure, and climate adaptation can work together.
The deeper lesson is not simply that a Raspberry Pi can measure distance to water. The deeper lesson is that flood monitoring requires a whole chain of responsible design: stable reference geometry, calibration, rainfall context, rate-of-rise logic, data quality, field survivability, public-safety boundaries, maintenance, and trustworthy communication. When those layers are treated seriously, even a small prototype can demonstrate the logic of resilient hydrological infrastructure.
Related Articles and Site Areas
- Raspberry Pi Sustainability Engineering Series
- Raspberry Pi Climate Early Warning System
- Environmental Monitoring Systems
- Intelligent Infrastructure Systems
- Freshwater Change and Earth System Risk
- Climate Change as a Planetary Boundary
- Sustainable Development Goals Within Planetary Boundaries
- Planetary Boundaries
Further Reading
- Adafruit (n.d.) Distance Measurement Sensors. Available at: https://learn.adafruit.com/distance-measurement-ultrasound-hcsr04
- Intergovernmental Panel on Climate Change (2022) Climate Change 2022: Impacts, Adaptation and Vulnerability. Available at: https://www.ipcc.ch/report/ar6/wg2/
- National Oceanic and Atmospheric Administration (n.d.) National Weather Service: Flood Safety. Available at: https://www.weather.gov/safety/flood
- Raspberry Pi Foundation (n.d.) Raspberry Pi Documentation. Available at: https://www.raspberrypi.com/documentation/
- United Nations (n.d.) Sustainable Development Goal 6: Clean Water and Sanitation. Available at: https://sdgs.un.org/goals/goal6
- United Nations (n.d.) Sustainable Development Goal 13: Climate Action. Available at: https://sdgs.un.org/goals/goal13
- United Nations Office for Disaster Risk Reduction (2015) Sendai Framework for Disaster Risk Reduction 2015–2030. Available at: https://www.undrr.org/publication/sendai-framework-disaster-risk-reduction-2015-2030
- U.S. Geological Survey (n.d.) Water Data for the Nation. Available at: https://waterdata.usgs.gov/nwis
- U.S. Geological Survey (n.d.) Floods and High Water. Available at: https://www.usgs.gov/special-topics/water-science-school/science/floods-and-high-water
- World Meteorological Organization (n.d.) Multi-Hazard Early Warning Systems. Available at: https://wmo.int/topics/multi-hazard-early-warning-systems
References
- Adafruit (n.d.) Distance Measurement Sensors. Available at: https://learn.adafruit.com/distance-measurement-ultrasound-hcsr04
- Intergovernmental Panel on Climate Change (2022) Climate Change 2022: Impacts, Adaptation and Vulnerability. Available at: https://www.ipcc.ch/report/ar6/wg2/
- National Oceanic and Atmospheric Administration (n.d.) National Weather Service: Flood Safety. Available at: https://www.weather.gov/safety/flood
- Raspberry Pi Foundation (n.d.) Raspberry Pi Documentation. Available at: https://www.raspberrypi.com/documentation/
- United Nations (n.d.) The 17 Sustainable Development Goals. Available at: https://sdgs.un.org/goals
- United Nations (n.d.) Sustainable Development Goal 6: Clean Water and Sanitation. Available at: https://sdgs.un.org/goals/goal6
- United Nations (n.d.) Sustainable Development Goal 9: Industry, Innovation and Infrastructure. Available at: https://sdgs.un.org/goals/goal9
- United Nations (n.d.) Sustainable Development Goal 11: Sustainable Cities and Communities. Available at: https://sdgs.un.org/goals/goal11
- United Nations (n.d.) Sustainable Development Goal 13: Climate Action. Available at: https://sdgs.un.org/goals/goal13
- United Nations (n.d.) Sustainable Development Goal 15: Life on Land. Available at: https://sdgs.un.org/goals/goal15
- United Nations Office for Disaster Risk Reduction (2015) Sendai Framework for Disaster Risk Reduction 2015–2030. Available at: https://www.undrr.org/publication/sendai-framework-disaster-risk-reduction-2015-2030
- U.S. Geological Survey (n.d.) Water Data for the Nation. Available at: https://waterdata.usgs.gov/nwis
- U.S. Geological Survey (n.d.) Floods and High Water. Available at: https://www.usgs.gov/special-topics/water-science-school/science/floods-and-high-water
- World Meteorological Organization (n.d.) Multi-Hazard Early Warning Systems. Available at: https://wmo.int/topics/multi-hazard-early-warning-systems
Flood resilience depends on reliable hydrological observation. A Raspberry Pi flood monitoring system can combine river-level sensing, rainfall monitoring, atmospheric data, local logging, and automated alert logic to detect emerging flood risk and support earlier response aligned with SDG 6: Clean Water and Sanitation and SDG 13: Climate Action.
Flooding is one of the most common and destructive environmental hazards worldwide. Rising river levels, intense rainfall, saturated soils, inadequate drainage infrastructure, stormwater overload, coastal or storm-surge conditions, land-use change, and climate-driven rainfall extremes can lead to rapid inundation that threatens communities, ecosystems, transportation systems, housing, agriculture, public health, and critical infrastructure.
This project demonstrates how to build a Raspberry Pi-based flood monitoring station capable of collecting hydrological and atmospheric data, storing local observations, and supporting threshold-based warning logic. While simple, the design reflects a broader sustainability principle: disaster risk becomes easier to manage when environmental change can be measured continuously, interpreted early, and communicated responsibly.
The project should not be treated as a certified public flood-warning system, official hydrological gauge, emergency alert network, flood forecast model, insurance or regulatory evidence system, or substitute for government flood monitoring and emergency-management services. Its purpose is educational and methodological: to show how water-level sensing, rainfall monitoring, edge computing, calibration, time-series logging, rate-of-rise detection, validation, and public-safety limits can work together in a hydrological monitoring workflow.
Main Library
Publications
Project Series
Raspberry Pi Projects
Related Topic
Environmental Monitoring
Related Topic
Freshwater Risk
Related Topic
Climate Boundary
This project also connects to broader site areas, including Environmental Monitoring Systems, Intelligent Infrastructure Systems, Freshwater Change and Earth System Risk, Climate Change as a Planetary Boundary, Sustainable Development Goals Within Planetary Boundaries, and Planetary Boundaries. In that wider context, this Raspberry Pi flood monitor is not only a maker project. It is a small prototype of the hydrological sensing, edge-computing, and alert infrastructure needed for climate adaptation, watershed stewardship, and disaster-risk reduction.
Abstract
This project presents a prototype Raspberry Pi flood monitoring system built around hydrological sensing, local data logging, threshold-based alert logic, and optional networked deployment. The platform measures river, stream, drainage-channel, or culvert water levels, monitors rainfall conditions, records supporting atmospheric variables, and stores observations for later analysis.
From an engineering perspective, the build demonstrates a compact edge-monitoring node for hydrological observation and flood-warning experimentation. From a sustainability perspective, it illustrates how low-cost distributed monitoring can strengthen climate adaptation, watershed awareness, local disaster preparedness, and responsible water-system governance.
The system is intentionally limited. It is not a certified public flood-warning system, official hydrological gauge, emergency alert network, hydraulic model, or substitute for government flood monitoring and emergency-management services. Its value is educational and methodological: it shows how local hydrological signals can be measured, logged, interpreted, and reviewed while preserving uncertainty, calibration needs, field limits, and public-safety boundaries.
SDG Alignment: Clean Water, Climate Action, Resilient Communities, and Infrastructure
This project aligns most directly with SDG 6: Clean Water and Sanitation and SDG 13: Climate Action. It supports water-resource monitoring by making river, stream, drainage, stormwater, and watershed conditions more visible over time. It supports climate action by strengthening resilience to flood hazards and improving the ability of communities to observe climate-related hydrological events.
The project also connects to SDG 11: Sustainable Cities and Communities, SDG 9: Industry, Innovation and Infrastructure, and SDG 15: Life on Land. Flood preparedness is central to resilient urban and regional infrastructure, while floodplains, wetlands, watersheds, riparian corridors, soils, and terrestrial ecosystems are shaped by hydrological dynamics.
| Sustainable Development Goal | How the Project Relates | Project-Level Mechanism |
|---|---|---|
| SDG 6: Clean Water and Sanitation | Supports water-resource monitoring, watershed awareness, stormwater visibility, and hydrological data literacy. | Water-level sensing, rainfall measurement, rise-rate tracking, and local hydrological logging. |
| SDG 13: Climate Action | Strengthens resilience to climate-related flood hazards and extreme rainfall conditions. | Threshold logic, rainfall-runoff observation, early awareness, and distributed monitoring workflows. |
| SDG 11: Sustainable Cities and Communities | Supports disaster preparedness, resilient infrastructure, drainage awareness, and safer communities. | Monitoring of culverts, streams, urban drainage channels, and flood-prone infrastructure. |
| SDG 9: Industry, Innovation and Infrastructure | Demonstrates distributed sensing, edge analytics, resilient monitoring systems, and local data infrastructure. | Raspberry Pi node with water-level sensing, rainfall counting, SQLite logging, and dashboard-ready records. |
| SDG 15: Life on Land | Relates to floodplains, wetlands, riparian ecosystems, soils, and habitat conditions shaped by hydrology. | Hydrological observation that can support restoration, floodplain awareness, and ecological monitoring. |
The strongest SDG connection is the pairing of SDG 6 and SDG 13. Flooding is both a water-system issue and a climate-risk issue. Rainfall extremes, river-level variability, stormwater capacity, watershed condition, and drainage infrastructure all shape whether water becomes a managed resource or a destructive hazard.
The connection to SDG 11 matters because flood risk is experienced locally. Homes, roads, rail lines, schools, hospitals, power systems, wastewater systems, and emergency routes can all be affected by rapidly changing water levels. Monitoring does not eliminate risk, but it can improve visibility and preparedness.
The connection to SDG 9 appears because flood resilience increasingly depends on data infrastructure: gauges, sensors, communication networks, dashboards, edge analytics, maintenance procedures, and institutional workflows. A Raspberry Pi prototype helps make that infrastructure logic visible.
Because the Sustainable Development Goals are broad public frameworks, it is important not to overclaim. This project is not a complete flood-risk management system, not a public warning service, and not a substitute for official hydrological infrastructure. Its contribution is narrower and still meaningful: it teaches the measurement architecture behind responsible flood-risk observation.
Connections to Other Site Areas
This Raspberry Pi flood monitoring system belongs to a wider body of work on environmental sensing, water systems, and intelligent infrastructure. It connects directly to Environmental Monitoring Systems, where field sensors, river stations, weather data, telemetry, and environmental datasets become tools for understanding climate and ecological conditions.
It also connects to Intelligent Infrastructure Systems. Flood monitoring becomes more useful when sensing nodes can collect observations, store time-series records, detect threshold crossings, issue local alert states, and support dashboard-based decision-making.
At the planetary-boundary level, the project relates to Freshwater Change and Earth System Risk. Local flood monitoring does not describe the entire freshwater boundary, but it demonstrates a crucial principle: water systems become more governable when their flows, levels, variability, and extremes are measured consistently.
The project also connects to Climate Change as a Planetary Boundary because extreme rainfall, altered hydrological cycles, storm intensity, and flood risk are increasingly central to climate adaptation planning.
Why Flood Monitoring Systems Matter
Flood hazards often emerge from measurable environmental changes before damaging overflow occurs. River levels rise, rainfall accumulates, soils saturate, stormwater systems reach capacity, and atmospheric conditions shift. Monitoring systems matter because they transform these precursors into actionable information.
A Raspberry Pi-based flood monitoring node matters for several reasons:
- it supports continuous local observation rather than only occasional manual checks
- it helps identify emerging risk before full flood onset
- it can scale across multiple sites in a watershed or drainage system
- it provides a foundation for threshold-based alerts and later predictive analytics
- it can support classrooms, community science, local resilience projects, and early-stage hydrological research
The platform is not a replacement for national hydrological infrastructure, certified emergency alert networks, or official flood-warning systems. Its value is that it translates the logic of flood monitoring into a reproducible edge-computing system that is accessible to researchers, communities, and educators.
The deeper value is time. A flood-monitoring system can make it possible to see a river or drainage channel changing before the most dangerous impacts appear. That lead time may support inspection, preparation, equipment movement, route awareness, or consultation of official warnings. But the chain from measurement to public action must be handled responsibly because flood warning is a high-stakes public-safety function.
Hydrological Indicators of Flood Risk
Flood events rarely occur without environmental signals. Hydrological and atmospheric indicators often reveal increasing risk before floodwaters reach dangerous levels.
Important flood indicators include:
- rapid increases in river, stream, or channel water level
- high rainfall intensity or prolonged precipitation
- soil saturation and increasing surface runoff
- changes in atmospheric pressure during storm systems
- blocked drainage or stormwater system overload
- storm surge conditions in coastal regions
- upstream rainfall that may affect downstream river levels after a delay
- snowmelt or frozen-ground conditions in colder regions
- land-cover changes that increase runoff and reduce infiltration
Monitoring these indicators continuously allows environmental monitoring systems to detect conditions that may precede dangerous flooding. Early detection gives communities, infrastructure managers, researchers, watershed groups, and emergency responders more time to understand changing conditions.
The most useful flood-monitoring systems do not rely on one signal alone. Water level, rainfall intensity, rate of rise, soil saturation, upstream conditions, drainage capacity, and official forecast context all contribute to the interpretation of risk.
Watershed Context: Why Location and Upstream Conditions Matter
Flood risk is spatial. A local sensor measures conditions at one point, but flooding is shaped by the entire watershed or drainage network feeding that point.
A small creek can rise quickly after intense rainfall over a steep or urbanized catchment. A large river may respond more slowly to upstream rainfall. A culvert can flood because of debris even if upstream water levels are not historically extreme. An urban street can flood because storm drains are undersized or blocked. A coastal site may flood from storm surge, high tide, rainfall, and drainage backup at the same time.
For this reason, a Raspberry Pi flood monitoring station should document:
- monitoring location and site type
- river, stream, culvert, drainage channel, or floodplain context
- sensor mount height and reference point
- upstream drainage area where known
- local infrastructure constraints such as culverts, bridges, and storm drains
- nearby official gauge or weather station references where available
- historical high-water marks or local flood observations where responsibly documented
Without this context, water-level readings can be misleading. A water level value is not meaningful by itself; it becomes meaningful when connected to the site, reference height, historical behavior, and consequences of overflow.
System Overview
The Raspberry Pi flood monitoring system measures distance to water, converts that distance into estimated water level, counts rainfall events, records supporting environmental data, stores observations in a local database, and applies transparent risk rules.
The system can include:
- ultrasonic or weather-rated distance sensor for water-level monitoring
- tipping-bucket rain gauge for rainfall accumulation and intensity
- BME280 environmental sensor for temperature, humidity, and pressure
- optional soil moisture sensor for saturation context
- optional solar power and battery system for field deployment
- SQLite database logging
- threshold-based flood-risk logic
- rate-of-rise analysis
- dashboard export or local status display
The key design pattern is hydrological visibility. The system does not predict floods with authority. It observes local water conditions, tracks change over time, and demonstrates how edge-computing tools can support early awareness.
System Requirements
A flood monitoring prototype becomes useful only when its requirements are explicit. It must measure water level consistently, preserve reference geometry, count rainfall reliably, store observations with metadata, apply transparent rules, and avoid false authority.
| Requirement | Design Target | Reason |
|---|---|---|
| Stable reference geometry | Mount the water-level sensor at a fixed known height | Water-level estimates depend on the reference point remaining stable |
| Reliable distance readings | Use median filtering, timeout handling, and range checks | Water turbulence, debris, and echo errors can distort raw readings |
| Rainfall measurement | Count tipping-bucket pulses with debounce logic | Rainfall intensity helps interpret runoff and rising water levels |
| Time-series logging | Store UTC timestamps, sensor IDs, location IDs, and quality flags | Flood risk is meaningful as a trend over time |
| Rate-of-rise logic | Track how quickly water levels are changing | Rapid rise can matter before absolute thresholds are crossed |
| Public-safety limits | Label outputs as prototype observations, not official warnings | Flood warning requires validated systems and institutional authority |
| Field survivability | Protect hardware from water, debris, heat, corrosion, and power loss | Flood monitors must operate during harsh conditions |
These requirements frame the build as a hydrological monitoring node rather than a simple ultrasonic sensor project. It must measure, document, analyze, and communicate responsibly.
System Architecture
A Raspberry Pi flood monitoring station combines environmental sensors with edge computing, local data storage, and automated alert logic.
Typical architecture:
Water Level Sensors → Raspberry Pi Edge Processing → Flood Risk Detection → Alerts and Data StorageMultiple monitoring stations can be deployed along river systems, streams, culverts, storm drains, drainage basins, or flood-prone areas. Environmental measurements from each station may be transmitted to a central server where regional flood conditions can be analyzed. This distributed architecture allows monitoring networks to scale across watersheds and urban drainage systems.
At a systems level, the flood-monitoring station can be understood as five layers:
- Sensing layer: water-level, rainfall, temperature, humidity, pressure, and optional soil-moisture sensors
- Acquisition layer: GPIO, I2C, pulse counting, or serial interfaces on the Raspberry Pi
- Storage layer: CSV, SQLite, or time-series database logging
- Analytics layer: threshold logic, trend detection, rate-of-rise checks, persistence rules, and anomaly detection
- Communication layer: local dashboard, SMS/email test alerts, network export, or cloud synchronization
Public warning systems require additional layers that this prototype does not provide: official data integration, redundancy, professional hydrological models, emergency-management governance, alert approval, communication reliability, and institutional accountability.
Environmental Sensors for Flood Monitoring
Flood monitoring systems often integrate several sensor types to capture hydrological and atmospheric conditions.
Common sensors include:
- Ultrasonic water-level sensors: estimate distance to the water surface from a fixed mount.
- Weather-rated distance sensors: improve field reliability compared with exposed hobby sensors.
- Tipping-bucket rainfall gauges: count rainfall increments over time.
- Soil moisture sensors: indicate saturation conditions that can increase runoff risk.
- BME280 or similar atmospheric sensors: measure temperature, humidity, and barometric pressure.
- Pressure transducers: provide submerged water-level readings in more advanced deployments.
- Staff gauges: provide manual reference readings for calibration and validation.
Combining multiple environmental measurements improves the reliability of flood detection systems and allows monitoring algorithms to identify more complex environmental patterns associated with flood events. It also helps separate measurement artifacts from real hydrological change.
Bill of Materials
- Raspberry Pi 4, Raspberry Pi 5, or Raspberry Pi Zero 2 W
- ultrasonic distance sensor such as HC-SR04 for indoor/prototype tests or a weather-rated equivalent for field use
- tipping-bucket rain gauge
- BME280 environmental sensor
- optional soil moisture sensor
- optional staff gauge or fixed reference marker for validation
- solar power supply with battery storage for field deployment
- microSD card with adequate endurance for logging
- weather-resistant enclosure
- mounting bracket or fixed reference structure
- network connection through Wi-Fi, Ethernet, cellular, or LoRa where appropriate
- cable glands, drip loops, strain relief, fuses, and waterproof connectors
Outdoor monitoring stations often operate in remote locations and must run continuously using resilient power systems. Weather-resistant enclosures, stable mounting, cable strain relief, protective sensor placement, and safe field access are essential for long-term reliability.
Engineering Specifications
| Parameter | Reference Design |
|---|---|
| Compute platform | Raspberry Pi 4, Raspberry Pi 5, or Raspberry Pi Zero 2 W |
| Primary hydrological sensor | Ultrasonic distance sensor for prototype water-level estimation; weather-rated sensor preferred for field use |
| Rainfall sensing | Tipping-bucket rain gauge |
| Atmospheric sensing | BME280 for temperature, humidity, and pressure |
| Optional sensing | Soil moisture, pressure transducer, staff gauge reference, camera, solar power telemetry |
| Storage options | CSV, SQLite, InfluxDB, or dashboard export |
| Alert mode | Threshold-based and trend-based flood-risk detection |
| Deployment mode | Distributed flood-monitoring node |
| Target scope | Educational, prototype, and experimental flood-risk observation |
| Public-safety scope | Prototype awareness only; not an official flood warning system |
The reference design is modular. It can begin with water-level measurement and rainfall counting, then expand to atmospheric context, rate-of-rise analysis, dashboards, distributed networks, solar power, and more robust field sensors.
Measurement Principle: Water Level, Rainfall, Rise Rate, and Flood Visibility
A flood monitoring station does not measure “flood risk” directly. It measures environmental signals associated with changing hydrological conditions. Water level, rainfall intensity, water-level rise rate, soil saturation, and upstream rainfall are all partial indicators. Their meaning depends on watershed size, drainage capacity, topography, land cover, infrastructure, season, and local flood history.
An ultrasonic sensor estimates distance between the sensor and the water surface. If the sensor is mounted above the channel, rising water reduces the measured distance. The software converts that distance into estimated water level relative to a fixed reference. A rainfall gauge counts bucket tips and converts them into rainfall depth. The Raspberry Pi stores these readings and applies rules that classify conditions as normal, watch, or warning.
The measurement principle is therefore: measure water-level geometry, count rainfall events, preserve timestamps and metadata, apply filtering and quality checks, calculate rate of rise, compare readings with site-specific thresholds, and interpret results as prototype awareness rather than official warnings.
Flood monitoring depends heavily on reference points. If the sensor mount shifts, the bridge deck reference changes, the channel bed erodes, or debris changes the water surface, the numbers may still look precise while becoming less meaningful. A responsible deployment treats sensor geometry as part of the data system.
Mathematical Lens: From Water-Level Signals to Flood Awareness
The Raspberry Pi flood monitoring system can be understood as a time-series hydrological classification system. It transforms distance readings, rainfall counts, and timestamps into water-level estimates, rise rates, and alert states.
H_t = H_{\mathrm{mount}} – d_t
\]
Interpretation: Estimated water level \(H_t\) is calculated from fixed sensor mount height \(H_{\mathrm{mount}}\) minus measured distance to water \(d_t\).
This calculation is simple, but it depends on stable sensor mounting and a clearly defined reference height.
r_t=\frac{H_t-H_{t-k}}{\Delta t}
\]
Interpretation: Rate of rise \(r_t\) estimates how quickly water level is increasing over a time interval.
Rate of rise is often as important as absolute level. A lower water level rising quickly may deserve attention before a threshold is crossed.
R = n_{\mathrm{tips}} \cdot c_{\mathrm{tip}}
\]
Interpretation: Rainfall accumulation \(R\) can be estimated from tipping-bucket count \(n_{\mathrm{tips}}\) multiplied by the gauge calibration \(c_{\mathrm{tip}}\).
Rainfall intensity can be calculated by dividing rainfall accumulation by the interval over which it was measured.
A_t =
\begin{cases}
\text{warning}, & H_t \geq T_{\mathrm{warning}} \\
\text{watch}, & H_t \geq T_{\mathrm{watch}} \\
\text{watch}, & r_t \geq T_{\mathrm{rise}} \\
\text{watch}, & R_{1h} \geq T_{\mathrm{rain}} \\
\text{normal}, & \text{otherwise}
\end{cases}
\]
Interpretation: A simple flood alert state can combine absolute water level, rate of rise, and recent rainfall intensity.
These thresholds should be treated as configurable site parameters, not universal constants.
Q_t =
\begin{cases}
\text{suspect}, & d_t \notin [d_{\min}, d_{\max}] \\
\text{suspect}, & |H_t-H_{t-1}| > T_{\mathrm{jump}} \\
\text{valid}, & \text{otherwise}
\end{cases}
\]
Interpretation: Quality flags can mark readings as suspect when they fall outside expected ranges or jump implausibly between samples.
The mathematical lens shows why flood monitoring is more than reading an ultrasonic sensor. It requires reference geometry, filtering, rainfall accumulation, trend detection, quality flags, and local threshold design.
Measuring River Water Levels
Ultrasonic sensors estimate the distance between the sensor and the water surface by measuring the time required for a sound pulse to travel to the water and return to the sensor.
The HC-SR04 emits a high-frequency acoustic signal and calculates distance using the speed of sound in air. In a flood-monitoring system, the sensor is mounted above the water surface. The measured distance is then converted into water height using the known sensor mount height.
The following Python example includes timeout handling, repeated sampling, median filtering, and water-level conversion.
"""
Raspberry Pi Flood Monitoring System
Ultrasonic Water-Level Reader

Measures:
- distance from sensor to water surface
- estimated water level relative to a reference height

Notes:
- This is prototype code for education and experimental monitoring.
- Outdoor flood monitoring requires weather-rated sensors and stable mounting.
- Do not use this alone as a public flood-warning system.
"""

import statistics
import time
from dataclasses import dataclass

import RPi.GPIO as GPIO


TRIG_PIN = 23
ECHO_PIN = 24

# Known height from sensor face to reference point, in centimeters.
# Example: sensor mounted 250 cm above the riverbed reference.
SENSOR_MOUNT_HEIGHT_CM = 250.0

# Timeout prevents the program from hanging if no echo is detected.
ECHO_TIMEOUT_SECONDS = 0.03


@dataclass
class WaterLevelReading:
    """Structured container for one water-level observation."""
    distance_to_water_cm: float
    estimated_water_level_cm: float


def setup_gpio() -> None:
    """Configure GPIO pins for the ultrasonic distance sensor."""
    GPIO.setmode(GPIO.BCM)
    GPIO.setup(TRIG_PIN, GPIO.OUT)
    GPIO.setup(ECHO_PIN, GPIO.IN)
    GPIO.output(TRIG_PIN, False)
    time.sleep(0.2)


def measure_distance_cm() -> float | None:
    """
    Measure distance using ultrasonic echo timing.

    Returns None if the echo pulse times out.
    """
    GPIO.output(TRIG_PIN, True)
    time.sleep(0.00001)
    GPIO.output(TRIG_PIN, False)

    start_time = time.time()
    timeout_start = start_time

    while GPIO.input(ECHO_PIN) == 0:
        start_time = time.time()

        if start_time - timeout_start > ECHO_TIMEOUT_SECONDS:
            return None

    stop_time = time.time()
    timeout_start = stop_time

    while GPIO.input(ECHO_PIN) == 1:
        stop_time = time.time()

        if stop_time - timeout_start > ECHO_TIMEOUT_SECONDS:
            return None

    elapsed_seconds = stop_time - start_time

    # Speed of sound is approximately 34300 cm/s at 20 C.
    distance_cm = (elapsed_seconds * 34300.0) / 2.0

    return distance_cm


def filtered_distance_cm(sample_count: int = 7) -> float | None:
    """
    Collect multiple readings and return the median.

    Median filtering helps reduce the effect of occasional noisy reflections.
    """
    samples = []

    for _ in range(sample_count):
        distance = measure_distance_cm()

        if distance is not None:
            samples.append(distance)

        time.sleep(0.1)

    if not samples:
        return None

    return statistics.median(samples)


def estimate_water_level(distance_to_water_cm: float) -> WaterLevelReading:
    """
    Convert sensor-to-water distance into estimated water level.

    Water level rises as distance to water decreases.
    """
    water_level_cm = SENSOR_MOUNT_HEIGHT_CM - distance_to_water_cm

    return WaterLevelReading(
        distance_to_water_cm=distance_to_water_cm,
        estimated_water_level_cm=water_level_cm,
    )


if __name__ == "__main__":
    try:
        setup_gpio()

        while True:
            distance = filtered_distance_cm()

            if distance is None:
                print("No valid ultrasonic reading.")
            else:
                reading = estimate_water_level(distance)
                print(
                    f"Distance to water: {reading.distance_to_water_cm:.1f} cm | "
                    f"Estimated water level: {reading.estimated_water_level_cm:.1f} cm"
                )

            time.sleep(10)

    finally:
        GPIO.cleanup()
For field use, a weather-rated distance sensor or pressure transducer may be more appropriate than a hobby ultrasonic module. The HC-SR04 is useful for learning the measurement logic but is not designed as a rugged hydrological instrument.
Sensor Calibration
To convert ultrasonic distance measurements into river-height estimates, the system must account for the installation height of the sensor above the water surface, riverbed, channel floor, bridge deck, culvert reference, or another fixed reference point.
If the sensor is mounted at a known height above the reference surface, water height can be estimated using:
\text{Water Height} = \text{Sensor Mount Height} – \text{Measured Distance}
\]
Interpretation: Water level rises as the measured distance from the sensor to the water surface decreases.
Calibration is critical because environmental conditions such as temperature, humidity, wind, turbulence, sensor angle, surface reflectivity, debris, and mounting movement can affect ultrasonic measurements. Regular calibration improves long-term reliability in field deployments.
A practical calibration process should include:
- measure the physical sensor mount height from a fixed reference point
- record several ultrasonic readings under stable water conditions
- compare readings against a manual staff gauge or known water-level reference
- adjust mount-height or offset values in the code
- repeat after storms, maintenance, sensor movement, enclosure changes, or suspected debris impact
Example Calibration Record
| Calibration Item | Reference | Sensor Reading | Adjustment | Notes |
|---|---|---|---|---|
| Mount height | Manual tape measurement | 250.0 cm | Set mount height in code | Measured from fixed bridge-deck reference |
| Stable water level | Staff gauge: 106.0 cm | 105.2 cm | Offset +0.8 cm | Low turbulence during test |
| Rain gauge | Manual pour test | 10 tips | Confirm mm-per-tip calibration | Debounce verified |
| Post-storm check | Visual inspection | Sensor angle changed | Re-mount and recalibrate | Debris impact suspected |
A calibration record like this makes readings more interpretable and prevents precise-looking sensor outputs from being mistaken for validated hydrological measurements.
Handling Sensor Noise and Measurement Error
Environmental sensors often produce noisy measurements due to water surface turbulence, wind, wave reflections, rain, debris, temperature variation, insects, condensation, and changing sensor angles. Flood monitoring systems should not rely on a single raw reading.
Common filtering techniques include:
- Moving average smoothing: reduces short-term random variation.
- Median filtering: rejects occasional outlier echoes.
- Persistence rules: require risk conditions to persist for multiple readings before triggering an alert.
- Rate-of-rise checks: detect rapid increases even before a high-level threshold is crossed.
- Sensor-health flags: identify missing readings, implausible values, or stuck measurements.
These methods help stabilize water-level measurements and improve flood-detection reliability. They also reduce the risk that a single bad echo, passing debris, or temporary splash will trigger an alert state.
"""
Simple Water-Level Quality Check

Flags missing, out-of-range, or implausibly large jump readings.
"""


def quality_check_water_level(
    current_level_cm: float | None,
    previous_level_cm: float | None,
    min_level_cm: float = 0.0,
    max_level_cm: float = 300.0,
    max_jump_cm: float = 40.0,
) -> list[str]:
    """Return quality flags for a water-level reading."""
    flags = []

    if current_level_cm is None:
        return ["missing_water_level"]

    if current_level_cm < min_level_cm or current_level_cm > max_level_cm:
        flags.append("water_level_out_of_range")

    if previous_level_cm is not None:
        jump = abs(current_level_cm - previous_level_cm)

        if jump > max_jump_cm:
            flags.append("implausible_level_jump")

    return flags


if __name__ == "__main__":
    flags = quality_check_water_level(
        current_level_cm=118.0,
        previous_level_cm=112.0,
    )

    print(flags or ["valid"])
Quality flags should be stored in the data model. A dashboard should not display suspicious readings with the same confidence as validated readings.
Rainfall Monitoring
Flood risk is often strongly influenced by rainfall intensity. Tipping-bucket rain gauges measure precipitation by counting small bucket tips, each corresponding to a known amount of rainfall.
Rainfall accumulation data may be used to calculate:
- rainfall intensity
- cumulative precipitation
- short-term runoff risk
- storm-event duration
- upstream flood potential
The following Python example counts tipping-bucket pulses and converts them into rainfall totals.
"""
Raspberry Pi Rainfall Monitor
Tipping-Bucket Gauge Example

Counts bucket tips and estimates rainfall accumulation.

Notes:
- The millimeters-per-tip value depends on the rain gauge model.
- Debouncing is important because switch contacts can bounce.
"""

import time
from dataclasses import dataclass

import RPi.GPIO as GPIO


RAIN_PIN = 17

# Example calibration value. Replace with the value for your rain gauge.
MM_PER_TIP = 0.2794

# Debounce interval in milliseconds.
BOUNCE_TIME_MS = 300


@dataclass
class RainfallState:
    """Tracks rainfall accumulation from tipping-bucket pulses."""
    tip_count: int = 0

    @property
    def rainfall_mm(self) -> float:
        return self.tip_count * MM_PER_TIP


rainfall_state = RainfallState()


def rain_tip_callback(channel: int) -> None:
    """Increment rainfall count whenever the bucket tips."""
    rainfall_state.tip_count += 1


def setup_rain_gauge() -> None:
    """Configure GPIO interrupt for rain gauge pulses."""
    GPIO.setmode(GPIO.BCM)
    GPIO.setup(RAIN_PIN, GPIO.IN, pull_up_down=GPIO.PUD_UP)

    GPIO.add_event_detect(
        RAIN_PIN,
        GPIO.FALLING,
        callback=rain_tip_callback,
        bouncetime=BOUNCE_TIME_MS,
    )


if __name__ == "__main__":
    try:
        setup_rain_gauge()

        print("Rainfall monitor started.")

        while True:
            print(
                f"Tips: {rainfall_state.tip_count} | "
                f"Rainfall: {rainfall_state.rainfall_mm:.2f} mm"
            )

            time.sleep(60)

    finally:
        GPIO.cleanup()
When rainfall exceeds predefined thresholds, monitoring systems may increase measurement frequency or trigger alerts. Rainfall data becomes especially useful when combined with water-level trends, soil-saturation indicators, upstream data, and drainage-system context.
Logging Flood Monitoring Data
Flood monitoring systems become more useful when observations are logged over time. A lightweight SQLite database allows water levels, rainfall totals, alert states, quality flags, and sensor metadata to be stored in a structured way.
"""
SQLite Logger for Raspberry Pi Flood Monitoring

Stores timestamped flood-monitoring observations:
- estimated water level
- distance to water surface
- rainfall accumulation
- rise rate
- flood risk status
- quality flags

The resulting dataset can be analyzed with Python, R, SQL, or dashboards.
"""

import sqlite3
from datetime import datetime, timezone
from pathlib import Path


DATABASE_PATH = Path("flood_monitoring.db")


def create_connection(db_path: Path = DATABASE_PATH) -> sqlite3.Connection:
    """Create and return a SQLite database connection."""
    return sqlite3.connect(db_path)


def initialize_database(conn: sqlite3.Connection) -> None:
    """Create the flood_readings table if it does not already exist."""
    cursor = conn.cursor()

    cursor.execute("""
        CREATE TABLE IF NOT EXISTS flood_readings (
            id INTEGER PRIMARY KEY AUTOINCREMENT,
            timestamp_utc TEXT NOT NULL,
            distance_to_water_cm REAL,
            water_level_cm REAL,
            rainfall_mm REAL,
            rainfall_mm_last_hour REAL,
            rise_rate_cm_per_hour REAL,
            alert_level TEXT DEFAULT 'normal',
            sensor_id TEXT DEFAULT 'flood_node_01',
            location_id TEXT DEFAULT 'prototype_site',
            quality_flag TEXT DEFAULT 'unchecked',
            notes TEXT DEFAULT ''
        )
    """)

    conn.commit()


def log_flood_reading(
    conn: sqlite3.Connection,
    distance_to_water_cm: float | None,
    water_level_cm: float | None,
    rainfall_mm: float | None,
    rainfall_mm_last_hour: float | None,
    rise_rate_cm_per_hour: float | None,
    alert_level: str,
    sensor_id: str = "flood_node_01",
    location_id: str = "prototype_site",
    quality_flag: str = "unchecked",
    notes: str = "",
) -> None:
    """Insert one flood-monitoring observation into SQLite."""
    cursor = conn.cursor()

    timestamp_utc = datetime.now(timezone.utc).isoformat()

    cursor.execute("""
        INSERT INTO flood_readings (
            timestamp_utc,
            distance_to_water_cm,
            water_level_cm,
            rainfall_mm,
            rainfall_mm_last_hour,
            rise_rate_cm_per_hour,
            alert_level,
            sensor_id,
            location_id,
            quality_flag,
            notes
        )
        VALUES (?, ?, ?, ?, ?, ?, ?, ?, ?, ?, ?)
    """, (
        timestamp_utc,
        distance_to_water_cm,
        water_level_cm,
        rainfall_mm,
        rainfall_mm_last_hour,
        rise_rate_cm_per_hour,
        alert_level,
        sensor_id,
        location_id,
        quality_flag,
        notes,
    ))

    conn.commit()


if __name__ == "__main__":
    conn = create_connection()
    initialize_database(conn)

    # Example row. Replace these values with live sensor readings.
    log_flood_reading(
        conn=conn,
        distance_to_water_cm=142.5,
        water_level_cm=107.5,
        rainfall_mm=18.2,
        rainfall_mm_last_hour=12.4,
        rise_rate_cm_per_hour=8.5,
        alert_level="watch",
        quality_flag="demo",
        notes="example flood-monitoring observation",
    )

    conn.close()
Over time, the resulting dataset can support trend review, alert validation, dashboard display, manual comparison with staff gauges, and analysis of rainfall-runoff behavior.
Flood Monitoring Data Model
A flood monitoring system should store more than the latest water level. It should preserve distance readings, converted water levels, rainfall context, rise rates, alert state, sensor identity, location ID, quality flags, and field notes.
| Field | Example | Purpose |
|---|---|---|
| timestamp_utc | 2026-05-28T09:15:00Z | Provides a consistent time reference for hydrological analysis |
| location_id | creek_crossing_02 | Identifies the monitoring site without requiring public coordinates |
| sensor_id | flood_node_01 | Links readings to specific hardware |
| distance_to_water_cm | 142.5 | Stores raw distance-to-surface estimate for debugging and recalculation |
| water_level_cm | 107.5 | Stores converted water level relative to the chosen reference |
| rainfall_mm_last_hour | 12.4 | Supports rainfall intensity and runoff interpretation |
| rise_rate_cm_per_hour | 8.5 | Supports trend and rapid-rise detection |
| alert_level | watch | Records prototype risk state |
| quality_flag | valid | Marks readings as valid, suspect, demo, missing, or calibration-needed |
| notes | debris near sensor mount | Preserves field and maintenance context |
A clear data model helps make the system auditable. When an alert occurs, users should be able to see which readings, thresholds, quality flags, and field notes produced the alert state.
Flood Risk Detection Logic
Flood detection algorithms typically combine multiple environmental signals. The simplest systems use threshold logic. More useful systems also consider persistence, rainfall intensity, and rate of water-level rise.
"""
Threshold-Based Flood Alert Logic

Combines water level, rainfall, and rate-of-rise indicators into a simple
alert state.

This is prototype logic. Real public warning systems require professional
hydrological modeling, validation, redundancy, and official governance.
"""

from dataclasses import dataclass


@dataclass
class FloodInputs:
    """Input values used by the flood alert classifier."""
    water_level_cm: float
    rainfall_mm_last_hour: float
    rise_rate_cm_per_hour: float


@dataclass
class FloodThresholds:
    """Local thresholds that should be calibrated to the site."""
    watch_level_cm: float = 100.0
    warning_level_cm: float = 130.0
    rainfall_watch_mm: float = 20.0
    rapid_rise_cm_per_hour: float = 15.0


def classify_flood_risk(
    inputs: FloodInputs,
    thresholds: FloodThresholds = FloodThresholds(),
) -> str:
    """
    Classify flood risk using water level, rainfall, and rise-rate signals.

    Returns:
    - normal
    - watch
    - warning
    """
    if inputs.water_level_cm >= thresholds.warning_level_cm:
        return "warning"

    if inputs.water_level_cm >= thresholds.watch_level_cm:
        return "watch"

    if inputs.rainfall_mm_last_hour >= thresholds.rainfall_watch_mm:
        return "watch"

    if inputs.rise_rate_cm_per_hour >= thresholds.rapid_rise_cm_per_hour:
        return "watch"

    return "normal"


if __name__ == "__main__":
    current_inputs = FloodInputs(
        water_level_cm=118.0,
        rainfall_mm_last_hour=24.0,
        rise_rate_cm_per_hour=9.5,
    )

    risk = classify_flood_risk(current_inputs)
    print(f"Flood alert level: {risk}")
Combining rainfall data with water-level measurements improves flood detection reliability and reduces false alarms. More advanced systems may incorporate upstream sensor data, persistence rules, hydraulic models, weather forecasts, watershed characteristics, and historical flood records.
For public-facing dashboards, labels should remain careful. “Prototype watch condition detected” is safer than “flood warning” unless the system is part of an official, validated, governed warning program.
Persistence Rules, False Alarms, and Alert Stability
Flood monitoring systems must manage both false positives and false negatives. A false positive can create unnecessary alarm or cause users to ignore future alerts. A false negative can create misplaced confidence during a real hazard. Persistence rules help stabilize alert logic by requiring conditions to remain elevated for more than one reading before escalation.
"""
Persistence-Based Alert Stabilizer

Requires multiple consecutive elevated readings before escalating an alert.
This helps reduce false alarms from noisy sensor readings.
"""

from collections import deque


ALERT_PRIORITY = {
    "normal": 0,
    "watch": 1,
    "warning": 2,
}


class AlertStabilizer:
    """Stabilizes alert levels using a short history of classifications."""

    def __init__(self, required_count: int = 3):
        self.required_count = required_count
        self.history = deque(maxlen=required_count)

    def add_alert(self, alert_level: str) -> str:
        """Return stabilized alert level from recent classifications."""
        if alert_level not in ALERT_PRIORITY:
            alert_level = "normal"

        self.history.append(alert_level)

        if len(self.history) < self.required_count:
            return "normal"

        if all(level == "warning" for level in self.history):
            return "warning"

        if all(ALERT_PRIORITY[level] >= ALERT_PRIORITY["watch"] for level in self.history):
            return "watch"

        return "normal"


if __name__ == "__main__":
    stabilizer = AlertStabilizer(required_count=3)

    sequence = ["normal", "watch", "watch", "watch", "warning", "warning", "warning"]

    for level in sequence:
        print(level, "→", stabilizer.add_alert(level))
Persistence rules should be used carefully. They can reduce false alarms, but they can also delay warnings. The appropriate logic depends on the hazard, site conditions, sensor reliability, and intended use.
Distributed Flood Monitoring Networks
Individual monitoring stations can be connected into distributed monitoring networks. Multiple Raspberry Pi stations may transmit environmental data to a centralized database or dashboard.
Applications include:
- river basin monitoring
- urban drainage monitoring
- community flood early-warning experiments
- agricultural water management
- culvert and stormwater infrastructure monitoring
- campus, park, or municipal resilience projects
Distributed networks improve regional flood awareness and enable more coordinated emergency response. They also create richer data records for understanding how rainfall, drainage capacity, land cover, infrastructure, and water-level response vary across different parts of a watershed.
Network design should standardize station IDs, timestamps, units, quality flags, threshold documentation, sensor metadata, and maintenance records. Without shared conventions, comparing data across stations becomes difficult and error-prone.
AI and Predictive Flood Detection
Machine learning models can analyze historical environmental data to identify patterns associated with flood events.
Potential applications include:
- predicting flood probability
- analyzing rainfall-runoff relationships
- detecting abnormal water-level trends
- predicting river overflow conditions
- classifying storm-event risk
- identifying sensor drift or sensor failure
The following lightweight example tracks rate of rise and flags rapid changes. It is not a flood forecast, but it demonstrates how time-series logic can detect potentially important hydrological change.
"""
Water-Level Trend Detector

Calculates approximate water-level rise rate from recent observations.
This is a lightweight trend heuristic for prototype monitoring systems.
"""

from collections import deque
from dataclasses import dataclass


@dataclass
class LevelObservation:
    """One timestamped water-level observation."""
    timestamp_seconds: float
    water_level_cm: float


class WaterLevelTrendDetector:
    """Tracks recent water levels and estimates rate of rise."""

    def __init__(self, max_observations: int = 12):
        self.observations = deque(maxlen=max_observations)

    def add_observation(self, timestamp_seconds: float, water_level_cm: float) -> dict:
        """Add an observation and return rate-of-rise diagnostics."""
        self.observations.append(
            LevelObservation(
                timestamp_seconds=timestamp_seconds,
                water_level_cm=water_level_cm,
            )
        )

        if len(self.observations) < 2:
            return {
                "rise_rate_cm_per_hour": 0.0,
                "rapid_rise": False,
            }

        first = self.observations[0]
        last = self.observations[-1]

        elapsed_hours = (last.timestamp_seconds - first.timestamp_seconds) / 3600.0

        if elapsed_hours <= 0:
            return {
                "rise_rate_cm_per_hour": 0.0,
                "rapid_rise": False,
            }

        level_change_cm = last.water_level_cm - first.water_level_cm
        rise_rate = level_change_cm / elapsed_hours

        return {
            "rise_rate_cm_per_hour": rise_rate,
            "rapid_rise": rise_rate >= 15.0,
        }


if __name__ == "__main__":
    detector = WaterLevelTrendDetector()

    sample_data = [
        (0, 90),
        (600, 94),
        (1200, 99),
        (1800, 108),
    ]

    for timestamp, level in sample_data:
        result = detector.add_observation(timestamp, level)
        print(result)
Lightweight machine learning frameworks such as TensorFlow Lite can also run directly on Raspberry Pi devices, allowing predictive flood detection to occur at the edge. However, any public warning system requires careful validation, redundancy, and governance. Prototype analytics should be treated as decision support, not authoritative emergency warnings.
AI should also be evaluated against real local conditions. A model trained on one watershed may not generalize to another. Local channel geometry, drainage infrastructure, rainfall intensity, soil saturation, land cover, and upstream timing all influence flood response.
GitHub Repository
The article body includes the core water-level, rainfall, logging, flood-alert, persistence, quality-check, and trend-detection examples so the build remains readable. The full repository expands the project into a reproducible prototype package, including Python water-level sensing scripts, rainfall monitoring examples, SQLite logging utilities, threshold-based alert logic, anomaly detection scaffolding, deployment notes, and example flood-monitoring datasets.
Complete Code Repository
The full code distribution for this project, including Python water-level sensing scripts, rainfall monitoring examples, SQLite logging utilities, threshold-based alert logic, anomaly detection scaffolding, deployment notes, and example flood-monitoring datasets, is available on GitHub.
The repository contains the complete prototype build materials:
- Python sensor-reading scripts
- water-level and rainfall monitoring examples
- alert detection logic
- deployment notes
- example flood-monitoring datasets
- supporting environmental analysis files
Repository Structure
raspberry-pi-flood-monitoring-system/

README.md
LICENSE
requirements.txt

src/
  read_water_level.py
  rainfall_monitor.py
  log_flood_data.py
  flood_alerts.py
  trend_detection.py
  alert_stabilizer.py
  quality_checks.py
  anomaly_detection.py

docs/
  setup_guide.md
  deployment_notes.md
  sensor_notes.md
  calibration.md
  data_model.md
  alert_design.md
  safety_scope.md
  responsible_use.md

data/
  example_flood_readings.csv

hardware/
Engineers can clone the repository, fork the design, or download the complete project using GitHub’s Download ZIP feature. All materials are released under the MIT License to support reuse in research, education, community resilience, and prototype engineering work.
Engineering Notes
A few technical considerations are especially important in this build:
- Mounting geometry: water-level interpretation depends heavily on stable sensor placement and a fixed reference height.
- Environmental noise: wind, turbulence, rain, debris, and surface reflection can distort ultrasonic measurements.
- Power resilience: flood-monitoring nodes may be most critical during storms when power and network conditions are unstable.
- Threshold realism: warning levels should reflect local watershed behavior, not generic values.
- Network design: distributed systems benefit from consistent data structures, synchronized timestamps, and location metadata.
- Physical survivability: sensors must be mounted where they can observe flood risk without being washed away by the event they are measuring.
- Maintenance: debris, insects, corrosion, battery degradation, and enclosure leaks can degrade field performance over time.
- Public-safety boundaries: prototype alert states should not be presented as official flood warnings.
These considerations make the project more than a single-purpose sensor demo. It becomes a prototype hydrological resilience infrastructure node.
Deployment Scope and Public-Safety Limits
This prototype is designed for educational, experimental, and early-stage hydrological monitoring. It should not be treated as a certified public flood-warning system, emergency alert network, official hydrological gauge, or substitute for government flood monitoring.
Flood warning is a high-stakes public-safety function. Real-world warning systems require validated hydrological models, redundant sensors, robust communications, institutional responsibility, maintenance procedures, emergency protocols, legal authority, and coordination with public authorities.
These constraints do not make the prototype unhelpful. They define the appropriate scope of use: local observation, education, prototype analytics, watershed awareness, community science, and early-stage infrastructure experimentation. For public warning, regulatory, insurance, legal, or emergency-management decisions, use official hydrological data and professionally validated systems.
Any dashboard or alert state should clearly identify the system as a prototype. The interface should direct users to official flood, weather, and emergency-management sources for consequential decisions.
Failure Modes and Practical Risks
A useful flood-monitoring article should explain not only how the system works, but how it can fail. Hydrological monitoring is difficult because the field environment is exactly what becomes dangerous during the event being measured.
- Sensor washout: equipment may be damaged or removed by high water, debris, or flow forces.
- Mount movement: small shifts in sensor angle or mount height can distort water-level estimates.
- Echo errors: turbulence, rain, foam, debris, or waves can produce unstable ultrasonic readings.
- Blocked rain gauge: leaves, insects, ice, or debris can prevent accurate rainfall measurement.
- Power failure: storms can interrupt solar charging, batteries, or wired power exactly when monitoring matters most.
- Communication failure: flooding and storms can disrupt Wi-Fi, cellular, or backhaul links.
- False positives: noisy readings or poor thresholds can trigger unnecessary alert states.
- False negatives: bad placement, failed sensors, or overly high thresholds can miss rising risk.
- Threshold mismatch: generic thresholds may not reflect local hydrology or infrastructure consequences.
- Overreliance: users may trust a prototype more than official warnings or direct observations.
These risks do not make the project unusable. They make calibration, maintenance, quality flags, redundancy, careful communication, and public-safety boundaries essential. A prototype flood monitor should increase awareness without creating false authority.
Validation and Testing
To bring this project closer to engineering-grade documentation, validation should include:
- verify sensor communication with the BME280 and any rainfall or water-level sensors
- confirm that ultrasonic distance readings remain plausible under controlled conditions
- test calibration logic against known reference heights
- compare water-level readings with a staff gauge or manual reference where possible
- simulate threshold crossings for rainfall and flood-alert rules
- verify CSV or SQLite logging over repeated intervals
- test rate-of-rise calculations using known sample data
- test persistence rules for false-alarm reduction
- run extended trials to assess uptime and storage reliability
- document sensor placement, mount height, location metadata, and environmental conditions
If the system behaves inconsistently, the issue may be related to sensor placement, threshold selection, power instability, logging configuration, environmental interference, wiring, enclosure conditions, or mounting geometry rather than to the monitoring concept itself.
Example Validation Record
| Test | Expected Result | Observed Result | Likely Issue | Action |
|---|---|---|---|---|
| Known distance test | Ultrasonic reading matches reference distance | Reading within 2 cm | Acceptable for prototype context | Proceed to mount-height calibration |
| Staff gauge comparison | Water-level estimate matches manual reference | Estimate 3 cm high | Mount offset or sensor angle | Apply offset and document calibration |
| Rain gauge pulse test | Each tip counted once | Double counts during test | Switch bounce | Increase debounce and retest |
| Flood alert simulation | Watch/warning states trigger at thresholds | Expected states returned | None | Proceed to persistence testing |
| Storm trial | Station logs continuously through rain | Short data gap during outage | Power or network instability | Prioritize local logging and improve power backup |
Validation records like this help distinguish hydrological signal from sensor artifact. That distinction is essential in flood monitoring.
Suggested Performance Metrics
For a more rigorous evaluation, the system can be assessed using several simple metrics:
- sensor stability: consistency of repeated readings under unchanged conditions
- calibration accuracy: agreement between estimated water level and manual reference measurements
- alert reliability: whether warning logic triggers under intended conditions without excessive false alarms
- false-positive rate: how often alert states occur without meaningful hydrological change
- false-negative review: whether known water-level events occurred without a prototype alert signal
- logging reliability: whether observations are stored without loss over long runs
- uptime: how consistently the station continues operating without intervention
- data completeness: whether expected observations are captured across monitoring intervals
- operational usefulness: whether the collected data improves local understanding of flood risk
- maintenance burden: how often the station requires cleaning, recalibration, battery replacement, or enclosure repair
Even simple tracking of these metrics improves the project’s value as an experimental flood-monitoring platform. The goal is not merely to produce readings, but to produce readings that are stable, documented, interpretable, and properly bounded.
Field Deployment, Survivability, Power, and Maintenance
Field deployment is where flood monitoring becomes difficult. Flood sensors must operate in places where water, debris, mud, insects, freezing, heat, vandalism, unstable power, and communication outages can all occur.
Responsible deployment should address:
- mounting above expected flood debris and direct flow impact where possible
- stable reference geometry that can be rechecked after storms
- weather-resistant enclosures and cable glands
- drip loops, strain relief, and waterproof connectors
- solar power and battery sizing for stormy or cloudy periods
- local logging during network outages
- watchdog or service restart behavior
- safe field access procedures during and after storms
- cleaning schedule for rain gauges and sensors
- maintenance logs after heavy rainfall, flooding, debris impacts, or sensor movement
Maintenance is part of the monitoring system. A clogged rain gauge, shifted mount, loose wire, fouled sensor face, drained battery, or damaged enclosure can make the data misleading. Field notes should document every cleaning, inspection, calibration, relocation, and suspected anomaly.
Flood Monitoring and Sustainable Development
Flood monitoring systems contribute directly to sustainable development goals.
They support:
- SDG 6: Clean Water and Sanitation by improving water-resource monitoring and watershed awareness
- SDG 13: Climate Action by strengthening resilience to climate-related hazards
- SDG 11: Sustainable Cities and Communities by improving disaster preparedness and local infrastructure awareness
- SDG 9: Industry, Innovation and Infrastructure by demonstrating distributed sensing and resilient data infrastructure
Environmental monitoring infrastructure enables governments, researchers, schools, community organizations, watershed groups, and local institutions to detect environmental risks earlier and respond more effectively. Better data does not eliminate flood risk, but weak data makes preparedness far more difficult.
Flood monitoring also has a justice dimension. Flood exposure is shaped by housing location, infrastructure investment, drainage quality, land-use decisions, insurance access, emergency response capacity, and historical patterns of inequality. A responsible monitoring project should help make risk visible without shifting responsibility away from public institutions or affected communities.
The Future of Flood Monitoring Infrastructure
Next-generation flood monitoring systems will increasingly integrate:
- distributed sensor networks
- satellite observations
- weather radar
- machine learning models
- hydrological simulations
- real-time emergency alert systems
- open environmental databases
- community-based monitoring programs
Accessible computing platforms such as Raspberry Pi allow researchers, students, and communities to prototype systems capable of collecting valuable environmental data. These systems demonstrate how open hardware and open-source software can contribute to climate resilience and sustainable water management.
The long-term challenge is not merely collecting more flood data. It is building monitoring systems that are accurate enough to be useful, resilient enough to operate during storms, transparent enough to be trusted, and integrated enough to support real-world preparedness.
The most responsible future will combine community-scale observation with official hydrological networks, emergency-management institutions, public infrastructure investment, floodplain restoration, drainage planning, and climate adaptation policy. Sensors can make risk visible, but governance determines whether that visibility becomes protection.
Responsible Deployment
This prototype is appropriate for classrooms, makerspaces, watershed groups, resilience labs, environmental education, community science programs, and early-stage hydrological monitoring projects. It should not be used as an official flood-warning system, emergency alert service, evacuation trigger, insurance evidence platform, legal compliance tool, or public-safety decision system without professional validation and institutional governance.
Responsible deployment means matching the system to the consequence of error. A classroom demonstration can use simulated readings and known distances. A watershed awareness project can observe local conditions. A community pilot may support volunteer monitoring and education. A public flood-warning network requires formal responsibility, redundancy, official data integration, maintenance guarantees, hydraulic understanding, and emergency-management coordination.
A responsible version should include clear prototype labeling, official-source links, sensor-quality flags, data gaps, threshold documentation, maintenance logs, calibration records, alert explanations, and review after major rainfall or flood events.
The central rule is simple: flood monitoring prototypes should increase preparedness and water-system awareness without pretending to replace official public-safety systems.
Reproducibility
All code, documentation, and supporting build materials necessary to reproduce the prototype are included in the project repository. The design intentionally relies on widely available Raspberry Pi hardware, open-source Python libraries, and common environmental sensing components so that it can be rebuilt in classrooms, labs, makerspaces, community resilience programs, and independent flood-monitoring projects.
The system is intended as a reference implementation rather than a certified public warning network. Engineers adapting it for longer-term deployment should validate threshold design, enclosure resilience, power systems, data retention, sensor maintenance, mounting geometry, communications reliability, and local hydrological assumptions under real operating conditions.
For the rest of this project series, reproducibility should mean more than making code available. Each article should include a clear bill of materials, setup instructions, validation notes, data model, known failure modes, test procedure, responsible-use framing, and realistic statement of appropriate scope.
Conclusion
Building a Raspberry Pi flood monitoring system demonstrates how embedded sensing and local computation can support stronger hydrological resilience infrastructure. By combining river-level sensing, rainfall monitoring, atmospheric data, local logging, and threshold-based alert logic, the platform creates a flexible foundation for distributed flood-risk observation.
Although compact, the design reflects a broader sustainability principle: flood resilience depends on environmental visibility. When local hydrological conditions can be measured continuously and interpreted early, communities are better positioned to anticipate hazards and respond more effectively.
For classrooms, makerspaces, watershed groups, resilience labs, community science programs, and early-stage hydrological monitoring projects, this Raspberry Pi flood monitoring system provides a practical foundation for understanding how sensing, data infrastructure, and climate adaptation can work together.
The deeper lesson is not simply that a Raspberry Pi can measure distance to water. The deeper lesson is that flood monitoring requires a whole chain of responsible design: stable reference geometry, calibration, rainfall context, rate-of-rise logic, data quality, field survivability, public-safety boundaries, maintenance, and trustworthy communication. When those layers are treated seriously, even a small prototype can demonstrate the logic of resilient hydrological infrastructure.
Related Articles and Site Areas
- Raspberry Pi Sustainability Engineering Series
- Raspberry Pi Climate Early Warning System
- Environmental Monitoring Systems
- Intelligent Infrastructure Systems
- Freshwater Change and Earth System Risk
- Climate Change as a Planetary Boundary
- Sustainable Development Goals Within Planetary Boundaries
- Planetary Boundaries
Further Reading
- Adafruit (n.d.) Distance Measurement Sensors. Available at: https://learn.adafruit.com/distance-measurement-ultrasound-hcsr04
- Intergovernmental Panel on Climate Change (2022) Climate Change 2022: Impacts, Adaptation and Vulnerability. Available at: https://www.ipcc.ch/report/ar6/wg2/
- National Oceanic and Atmospheric Administration (n.d.) National Weather Service: Flood Safety. Available at: https://www.weather.gov/safety/flood
- Raspberry Pi Foundation (n.d.) Raspberry Pi Documentation. Available at: https://www.raspberrypi.com/documentation/
- United Nations (n.d.) Sustainable Development Goal 6: Clean Water and Sanitation. Available at: https://sdgs.un.org/goals/goal6
- United Nations (n.d.) Sustainable Development Goal 13: Climate Action. Available at: https://sdgs.un.org/goals/goal13
- United Nations Office for Disaster Risk Reduction (2015) Sendai Framework for Disaster Risk Reduction 2015–2030. Available at: https://www.undrr.org/publication/sendai-framework-disaster-risk-reduction-2015-2030
- U.S. Geological Survey (n.d.) Water Data for the Nation. Available at: https://waterdata.usgs.gov/nwis
- U.S. Geological Survey (n.d.) Floods and High Water. Available at: https://www.usgs.gov/special-topics/water-science-school/science/floods-and-high-water
- World Meteorological Organization (n.d.) Multi-Hazard Early Warning Systems. Available at: https://wmo.int/topics/multi-hazard-early-warning-systems
References
- Adafruit (n.d.) Distance Measurement Sensors. Available at: https://learn.adafruit.com/distance-measurement-ultrasound-hcsr04
- Intergovernmental Panel on Climate Change (2022) Climate Change 2022: Impacts, Adaptation and Vulnerability. Available at: https://www.ipcc.ch/report/ar6/wg2/
- National Oceanic and Atmospheric Administration (n.d.) National Weather Service: Flood Safety. Available at: https://www.weather.gov/safety/flood
- Raspberry Pi Foundation (n.d.) Raspberry Pi Documentation. Available at: https://www.raspberrypi.com/documentation/
- United Nations (n.d.) The 17 Sustainable Development Goals. Available at: https://sdgs.un.org/goals
- United Nations (n.d.) Sustainable Development Goal 6: Clean Water and Sanitation. Available at: https://sdgs.un.org/goals/goal6
- United Nations (n.d.) Sustainable Development Goal 9: Industry, Innovation and Infrastructure. Available at: https://sdgs.un.org/goals/goal9
- United Nations (n.d.) Sustainable Development Goal 11: Sustainable Cities and Communities. Available at: https://sdgs.un.org/goals/goal11
- United Nations (n.d.) Sustainable Development Goal 13: Climate Action. Available at: https://sdgs.un.org/goals/goal13
- United Nations (n.d.) Sustainable Development Goal 15: Life on Land. Available at: https://sdgs.un.org/goals/goal15
- United Nations Office for Disaster Risk Reduction (2015) Sendai Framework for Disaster Risk Reduction 2015–2030. Available at: https://www.undrr.org/publication/sendai-framework-disaster-risk-reduction-2015-2030
- U.S. Geological Survey (n.d.) Water Data for the Nation. Available at: https://waterdata.usgs.gov/nwis
- U.S. Geological Survey (n.d.) Floods and High Water. Available at: https://www.usgs.gov/special-topics/water-science-school/science/floods-and-high-water
- World Meteorological Organization (n.d.) Multi-Hazard Early Warning Systems. Available at: https://wmo.int/topics/multi-hazard-early-warning-systems