
Last Updated May 11, 2026
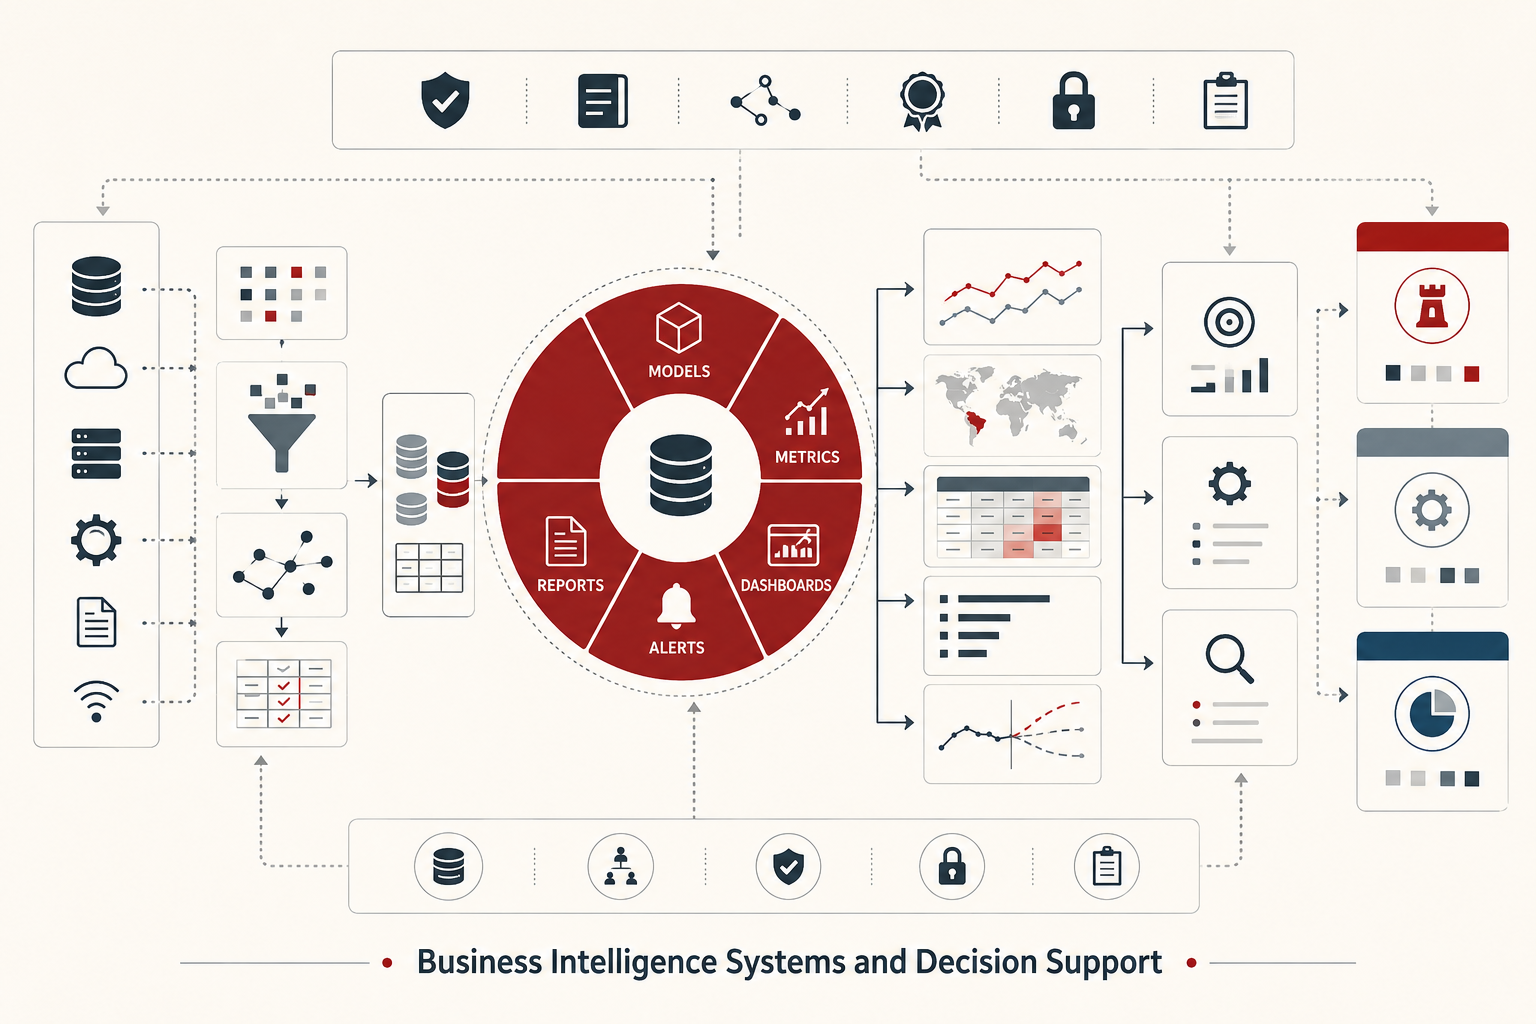
Business intelligence systems and decision support sit at the operational center of contemporary data-driven organizations. They translate distributed data assets into reports, dashboards, models, alerts, analytical workflows, and interpretive routines that help decision-makers understand current conditions, identify emerging risks, compare alternatives, and act with greater confidence. Yet the real significance of business intelligence is not that it makes data visible. It is that, when properly designed, it makes judgment more disciplined. A mature business intelligence environment does not merely surface metrics; it creates a structured relationship between evidence, interpretation, accountability, and organizational action.
In practice, this means that business intelligence systems should be understood not only as reporting tools, but as socio-technical infrastructures for decision support. They depend on data architecture, metadata, governance, semantic consistency, analytical modeling, visualization design, quality monitoring, user literacy, and organizational routines. They are valuable not because a dashboard exists, but because the dashboard is connected to reliable data pipelines, intelligible definitions, timely refresh cycles, appropriate access controls, decision thresholds, escalation pathways, and feedback loops. Where these foundations are weak, dashboards become decorative interfaces over unresolved ambiguity. Where these foundations are strong, business intelligence becomes a core institutional capability for learning, coordination, and strategic adaptation.
Main Library
Publications
Article Map
Data Systems & Analytics
Related Topic
Artificial Intelligence Systems
Related Topic
Intelligent Infrastructure Systems
Related Topic
Economic Systems
This article places business intelligence within that broader systems perspective. It connects reporting environments to organizational decision-making, analytical communication, governance, uncertainty, and learning, while showing why decision support is strongest when paired with sound data architecture, clear semantic layers, trustworthy quality controls, and well-designed human interpretation.
Business intelligence as decision infrastructure
Business intelligence is often described in instrumental terms: dashboards, scorecards, reports, KPIs, drill-down analysis, alerts, and self-service exploration. Those functions are real, but they are secondary to a larger architectural purpose. Business intelligence systems organize information for management decision-making by consolidating data from heterogeneous sources, structuring it for analysis, and presenting it in forms that support interpretation and action. In that sense, business intelligence is not a peripheral reporting layer. It is decision infrastructure that links operational data, managerial oversight, strategic judgment, and institutional accountability.
The language of decision support helps clarify this role. Decision support systems emerged as technologies intended to improve decision quality rather than replace human decision-makers. Their function was to assist with semi-structured and unstructured decisions by combining data, analytical models, domain knowledge, and interactive interfaces. Contemporary business intelligence platforms inherit much of this tradition. They extend classic decision support by integrating enterprise data pipelines, cloud analytics, semantic modeling, interactive visualization, automated alerts, embedded analytics, and increasingly AI-assisted exploration. But the core question remains the same: does the system improve the quality, speed, transparency, and defensibility of organizational decisions?
This framing matters because many organizations still confuse information display with decision support. A dashboard can summarize the past without helping leaders choose among alternatives. A report can be accurate yet strategically irrelevant. A visually attractive analytics environment can still fail if it does not distinguish between descriptive monitoring, diagnostic investigation, predictive estimation, and prescriptive evaluation. Mature BI systems therefore differentiate between informing a user, alerting a user, guiding an investigation, comparing scenarios, and supporting a decision. Each is a distinct analytical function requiring different data structures, interfaces, quality signals, and governance expectations.
From data pipelines to judgment
Business intelligence begins far upstream from the dashboard layer. Every chart rests on prior design choices about data integration, transformation logic, entity resolution, grain, temporal alignment, metadata, quality checks, access rules, and semantic definitions. If the underlying data model is unstable, the dashboard will inherit that instability. If definitions differ across departments, the metric shown to executives may conceal semantic conflict. If freshness expectations are unclear, users may act on stale signals while believing they are seeing current performance. For this reason, decision support quality is inseparable from data systems quality.
The most effective BI environments establish a clear chain from source systems to decision interfaces. Operational systems generate transactions and events; integration layers move and reconcile data; warehouses or lakehouse environments organize analytical storage; semantic layers standardize business meaning; dashboards and reports provide tailored views; and governance processes document ownership, lineage, certification status, and acceptable use. When these layers are aligned, users can move from a metric to its definition, from its definition to its source logic, and from its source logic to the accountable team responsible for maintenance. That traceability is central to decision confidence.
This is why business intelligence should never be treated as a purely front-end discipline. Visual design matters, but it does not substitute for model integrity. A decision support environment becomes credible when metric logic is standardized, assumptions are visible, exceptions are documented, refresh cycles are known, uncertainty is communicated, and analytical outputs can be interrogated rather than merely consumed. In that respect, BI is deeply connected to Data Integration and Interoperability, Master Data Management and Entity Resolution, and Data Security, Privacy, and Access Control.
The main functions of decision support
A robust BI system typically supports four interrelated forms of decision work.
First, descriptive monitoring. This is the most familiar function: tracking revenue, costs, service levels, inventory positions, conversion rates, quality indicators, operational uptime, risk exposure, customer satisfaction, product usage, or other performance measures. Descriptive monitoring provides situational awareness. It helps decision-makers answer the question: what is happening?
Second, diagnostic analysis. When a metric moves unexpectedly, users need to investigate drivers, segment patterns, compare cohorts, examine process bottlenecks, trace exceptions, and identify causal hypotheses. Diagnostic decision support helps answer: why is this happening?
Third, predictive estimation. Decision-makers often need forward-looking signals such as forecasts, propensity estimates, demand projections, anomaly alerts, risk probabilities, or scenario-based expectations. Predictive decision support addresses: what is likely to happen next?
Fourth, prescriptive and evaluative support. The most advanced BI environments do not stop at prediction. They compare interventions, test thresholds, model trade-offs, and support scenario evaluation. Here the question becomes: what should we do, given our objectives, constraints, values, and uncertainty?
These functions should not be collapsed into one interface. Executives may need concise strategic summaries. Analysts require drill-through and exploratory flexibility. Operators need real-time monitoring and alerting. Governance teams need auditability and documentation. Planners need scenario and sensitivity analysis. Effective decision support therefore depends on role-specific interface design anchored to shared semantic foundations.
Dashboards, reports, and analytical interfaces
Dashboards are useful because they compress complexity into interpretable views, but their value depends on disciplined scope. A dashboard should not attempt to answer every question. It should orient the user, highlight variance, show relationships among core measures, identify exceptions, and indicate where deeper investigation is warranted. The strongest dashboards are therefore structured around decision context. A strategic dashboard differs from an operational monitor; a stewardship dashboard differs from an executive scorecard; a diagnostic workbench differs from a board-level summary.
Reports serve a different function. They are often more stable, more narrative, and more suitable for compliance, board communication, periodic review, and archival comparison. Reports impose a sequence and can embed explanation alongside evidence. Dashboards, by contrast, are more exploratory and interactive. Treating them as interchangeable usually weakens both. Organizations need both reporting and dashboarding, but they should be designed for distinct cognitive tasks.
Analytical interfaces should also make uncertainty visible. Too many BI systems present figures with an unwarranted air of precision. Forecast ranges, confidence bounds, missingness indicators, quality flags, data freshness timestamps, sample sizes, and model limitations help users interpret outputs responsibly. Decision support improves when users can see not only the signal, but also the strength of the evidence, the volatility of the pattern, and the limits of the model. That principle connects directly to Model Evaluation and Performance Metrics and Information Design and Analytical Reporting.
A mathematical lens for BI and decision support
Business intelligence can also be evaluated through a mathematical lens. The point is not to pretend that organizational judgment can be reduced to a formula. The point is to make the conditions of decision-support trust explicit. A dashboard or report has value only when the evidence, semantics, quality, timeliness, uncertainty, and decision context are strong enough to support responsible action.
D_i = f(M_i, Q_i, S_i, F_i, U_i, A_i, C_i)
\]
Interpretation: Decision-support value \(D_i\) for BI interface \(i\) depends on metric relevance \(M_i\), data quality \(Q_i\), semantic consistency \(S_i\), freshness \(F_i\), uncertainty visibility \(U_i\), actionability \(A_i\), and contextual fit \(C_i\).
This formulation helps distinguish a reporting surface from a decision system. A dashboard with accurate metrics but weak action pathways may inform users without changing decisions. A dashboard with high usage but poor semantic consistency may spread confusion quickly. A report with strong definitions but stale data may be credible historically but weak operationally. Decision support depends on the combination.
A second useful model evaluates metric trust:
T_m = w_Q Q_m + w_S S_m + w_L L_m + w_F F_m + w_U U_m
\]
Interpretation: Metric trust \(T_m\) for metric \(m\) is a weighted combination of data quality \(Q_m\), semantic certification \(S_m\), lineage visibility \(L_m\), freshness \(F_m\), and uncertainty visibility \(U_m\).
The weights should be explicit:
w_Q + w_S + w_L + w_F + w_U = 1
\]
Interpretation: The scoring model should be transparent about how much weight is assigned to each source of trust. A financial reporting dashboard may weight semantic certification and lineage heavily, while an operational monitoring dashboard may weight freshness and alert response more heavily.
A third lens connects BI to action. Decision support is weak if evidence does not connect to accountable review, escalation, or follow-up.
A_d = E_d \times R_d \times P_d
\]
Interpretation: Actionability \(A_d\) for decision \(d\) depends on evidence quality \(E_d\), response readiness \(R_d\), and pathway clarity \(P_d\). If any of these are near zero, the dashboard may display information without supporting action.
This mathematical lens gives governance teams, BI teams, and domain leaders a shared way to review dashboards and reports. The most important question is not “how many people viewed the dashboard?” but “does this interface provide trusted evidence, in the right form, to the right users, at the right time, with clear pathways for interpretation and action?”
Python Workflow: BI Decision-Support Scorecard
The following Python workflow shows how a BI environment can score dashboards and metrics as decision-support assets. It combines certification status, lifecycle status, alert response time, action traceability, metric quality, and uncertainty visibility. In production, these inputs might come from a semantic layer, BI platform metadata, alerting system, catalog, lineage platform, and decision-review records.
#!/usr/bin/env python3
"""
Python Workflow: BI Decision-Support Scorecard

This compact workflow evaluates dashboards and metrics as decision-support
assets rather than as visualization objects alone.
"""

from __future__ import annotations

from dataclasses import dataclass


@dataclass
class Dashboard:
    dashboard_id: str
    name: str
    certification_status: str
    lifecycle_status: str
    average_ack_hours: float
    traceability_rate: float
    has_decision_function: bool


@dataclass
class Metric:
    metric_id: str
    name: str
    quality_score: float
    semantic_status: str
    uncertainty_visible: bool
    decision_critical: bool


def status_score(status: str) -> float:
    scores = {
        "certified": 1.0,
        "reviewed": 0.7,
        "uncertified": 0.2,
    }
    return scores.get(status, 0.0)


def lifecycle_score(status: str) -> float:
    scores = {
        "active": 1.0,
        "beta": 0.7,
        "deprecated": 0.2,
        "retired": 0.0,
    }
    return scores.get(status, 0.5)


def response_score(average_ack_hours: float) -> float:
    """
    Convert alert acknowledgement time into a 0-1 score.
    Acknowledgement beyond 24 hours receives little decision-support value.
    """
    return max(0.0, min(1.0, 1.0 - average_ack_hours / 24.0))


def dashboard_decision_support_score(dashboard: Dashboard) -> float:
    return round(
        0.30 * status_score(dashboard.certification_status)
        + 0.20 * lifecycle_score(dashboard.lifecycle_status)
        + 0.20 * response_score(dashboard.average_ack_hours)
        + 0.20 * dashboard.traceability_rate
        + 0.10 * (1.0 if dashboard.has_decision_function else 0.0),
        3,
    )


def metric_trust_score(metric: Metric) -> float:
    return round(
        0.45 * metric.quality_score
        + 0.25 * status_score(metric.semantic_status)
        + 0.15 * (1.0 if metric.uncertainty_visible else 0.0)
        + 0.15 * (1.0 if metric.decision_critical else 0.7),
        3,
    )


def main() -> None:
    dashboards = [
        Dashboard(
            dashboard_id="d001",
            name="Executive Revenue Scorecard",
            certification_status="certified",
            lifecycle_status="active",
            average_ack_hours=3.0,
            traceability_rate=1.0,
            has_decision_function=True,
        ),
        Dashboard(
            dashboard_id="d006",
            name="Legacy KPI Dashboard",
            certification_status="uncertified",
            lifecycle_status="deprecated",
            average_ack_hours=24.0,
            traceability_rate=0.0,
            has_decision_function=True,
        ),
    ]

    metrics = [
        Metric(
            metric_id="m001",
            name="net_revenue",
            quality_score=0.98,
            semantic_status="certified",
            uncertainty_visible=True,
            decision_critical=True,
        ),
        Metric(
            metric_id="m008",
            name="legacy_kpi_extract",
            quality_score=0.61,
            semantic_status="uncertified",
            uncertainty_visible=False,
            decision_critical=False,
        ),
    ]

    print("Dashboard decision-support scores")
    for dashboard in dashboards:
        print(
            dashboard.dashboard_id,
            dashboard.name,
            dashboard_decision_support_score(dashboard),
        )

    print("\nMetric trust scores")
    for metric in metrics:
        print(metric.metric_id, metric.name, metric_trust_score(metric))


if __name__ == "__main__":
    main()
This workflow makes the review logic inspectable. A BI scorecard should not be hidden behind the same dashboards it evaluates. The criteria should be visible enough for analytics teams, governance teams, decision owners, and domain leaders to debate whether the weights reflect the organization’s actual decision risk.
R Workflow: BI Usage, Alert, and Decision Review Summary
The following R workflow summarizes dashboard certification, alert response, metric quality, and decision traceability. It supports a practical governance review: which dashboards are certified, which alerts were acknowledged quickly, which decisions were traceable to evidence, and which BI assets require review?
#!/usr/bin/env Rscript

# R Workflow: BI Usage, Alert, and Decision Review Summary
#
# This workflow summarizes dashboard certification, alert response,
# metric quality, and decision traceability using base R.

dashboards <- data.frame(
  dashboard_id = c("d001", "d002", "d003", "d006"),
  dashboard_name = c(
    "Executive Revenue Scorecard",
    "Fulfillment Operations Monitor",
    "Risk Incident Review",
    "Legacy KPI Dashboard"
  ),
  domain = c("finance", "operations", "risk", "legacy"),
  certification_status = c("certified", "certified", "reviewed", "uncertified"),
  lifecycle_status = c("active", "active", "active", "deprecated"),
  stringsAsFactors = FALSE
)

alerts <- data.frame(
  dashboard_id = c("d001", "d002", "d002", "d003"),
  time_to_acknowledge_hours = c(3, 1, 2, 8),
  resolution_status = c("resolved", "resolved", "resolved", "in_review"),
  stringsAsFactors = FALSE
)

reviews <- data.frame(
  dashboard_id = c("d001", "d002", "d003", "d006"),
  decision_taken = c(
    "pricing-review-approved",
    "expedite-delayed-shipments",
    "incident-pattern-investigation",
    "no-action-low-confidence"
  ),
  evidence_quality = c("high", "high", "medium", "low"),
  action_traceable = c(TRUE, TRUE, TRUE, FALSE),
  stringsAsFactors = FALSE
)

metrics <- data.frame(
  metric_id = c("m001", "m003", "m004", "m008"),
  domain = c("finance", "operations", "risk", "legacy"),
  semantic_status = c("certified", "certified", "reviewed", "uncertified"),
  quality_score = c(0.98, 0.94, 0.91, 0.61),
  stringsAsFactors = FALSE
)

dashboard_lifecycle <- aggregate(
  dashboard_id ~ domain + certification_status + lifecycle_status,
  data = dashboards,
  FUN = length
)

names(dashboard_lifecycle) <- c(
  "domain",
  "certification_status",
  "lifecycle_status",
  "dashboard_count"
)

alert_summary <- aggregate(
  time_to_acknowledge_hours ~ dashboard_id,
  data = alerts,
  FUN = mean
)

names(alert_summary) <- c(
  "dashboard_id",
  "average_acknowledgement_hours"
)

review_summary <- aggregate(
  action_traceable ~ dashboard_id,
  data = reviews,
  FUN = mean
)

names(review_summary) <- c(
  "dashboard_id",
  "traceability_rate"
)

metric_summary <- aggregate(
  quality_score ~ domain + semantic_status,
  data = metrics,
  FUN = mean
)

names(metric_summary) <- c(
  "domain",
  "semantic_status",
  "average_quality_score"
)

dir.create("outputs", showWarnings = FALSE, recursive = TRUE)

write.csv(
  dashboard_lifecycle,
  "outputs/dashboard_lifecycle_summary_r.csv",
  row.names = FALSE
)

write.csv(
  alert_summary,
  "outputs/alert_response_summary_r.csv",
  row.names = FALSE
)

write.csv(
  review_summary,
  "outputs/decision_traceability_summary_r.csv",
  row.names = FALSE
)

write.csv(
  metric_summary,
  "outputs/metric_quality_summary_r.csv",
  row.names = FALSE
)

cat("Wrote BI usage, alert, and decision review outputs.\n")
This workflow distinguishes activity from decision quality. A dashboard may be frequently used but uncertified. An alert may fire but lack a clear response owner. A decision may cite data but leave no traceable action record. High-trust BI requires all three: trusted metrics, usable interfaces, and decision routines that connect evidence to action.
Self-service and governed analytics
One of the central tensions in business intelligence is the balance between self-service flexibility and enterprise governance. Self-service analytics can widen access, reduce bottlenecks, and allow domain experts to explore questions without waiting for centralized teams. Yet uncontrolled self-service can also generate definitional fragmentation, duplicate metrics, inconsistent filters, unreviewed models, and contradictory dashboards. Mature BI programs do not choose between freedom and control. They design layered access and governed self-service.
Governed self-service typically means that trusted datasets, semantic models, metric definitions, and certified dashboards are centrally maintained or institutionally coordinated, while users retain the ability to slice, explore, and extend within defined boundaries. The aim is not to suppress analytical initiative but to protect institutional coherence. A business user should be able to ask new questions without reinventing revenue, customer, incident, inventory, risk, or service-level logic from scratch.
Good governance also assigns stewardship responsibilities. Decision support fails when no one owns the metric, the refresh process, the data quality rules, the exception handling workflow, or the dashboard lifecycle. Stewardship makes BI operationally sustainable by ensuring that outputs are not just created, but maintained, reviewed, improved, and retired when they no longer serve a trustworthy purpose.
Decision support under uncertainty
The strongest justification for decision support systems emerges not in routine cases, but under uncertainty, complexity, and time pressure. In stable environments, even weak reporting systems may appear adequate. In volatile conditions—supply disruptions, financial stress, operational incidents, regulatory change, public-health shocks, climate-related hazards, cybersecurity events, or rapidly shifting demand—leaders need systems that support rapid orientation without amplifying noise or false confidence.
Under these conditions, business intelligence should support threshold monitoring, exception detection, scenario comparison, and the coordination of distributed teams around shared evidence. Yet it should also recognize the limits of quantification. Not every important variable is observable in real time. Not every strategic question can be reduced to a dashboard. Some situations involve ambiguity rather than measurable uncertainty. In such cases, BI should inform deliberation, not pretend to eliminate judgment.
This distinction is crucial. Decision support is most effective when it complements rather than displaces managerial reasoning. It can structure options, surface patterns, and reveal trade-offs, but it cannot determine values, institutional priorities, or acceptable risk on its own. Organizations that forget this often drift toward metric absolutism, where what is easily measured dominates what is strategically important. Better BI design resists this tendency by linking measurement to purpose and embedding analytical outputs within accountable decision processes.
Common failures in business intelligence systems
Many BI initiatives fail not because the software is weak, but because the surrounding system is underdesigned. Several failure modes recur.
One is metric ambiguity: the same indicator means different things in different departments. Another is data latency mismatch: users assume real-time responsiveness where only batch refresh exists. A third is dashboard overload: too many charts, too little hierarchy, and no clear decision path. A fourth is governance drift: metrics proliferate without ownership, lineage, certification, or review. A fifth is false precision: users are shown exact numbers without context about quality, uncertainty, missingness, sample size, or methodological limits. A sixth is tool-centric implementation: organizations invest heavily in platforms while neglecting stewardship, training, analytical literacy, and change management.
There is also the problem of performative analytics. Sometimes dashboards are built less to improve decisions than to signal modernity, control, or executive sophistication. These systems may be heavily used in presentations but weakly integrated into real operational choices. Genuine decision support is visible not in the elegance of the interface alone, but in whether it changes meetings, escalations, planning cycles, resource allocation, risk review, and institutional learning.
Design principles for high-trust BI
High-trust business intelligence environments share several characteristics. They are semantically coherent, meaning that definitions are standardized and discoverable. They are traceable, meaning users can inspect lineage, logic, and stewardship. They are role-aware, meaning interfaces align with actual decision contexts rather than generic reporting habits. They are quality-conscious, meaning freshness, completeness, and reliability are monitored rather than assumed. They are governed, meaning certified content is distinguished from ad hoc exploration. They are uncertainty-aware, meaning dashboards communicate signal, variance, quality, and limits clearly. And they are institutionally embedded, meaning outputs connect to meetings, thresholds, workflows, and decisions.
These principles matter more than any single software stack. Contemporary platforms can support dashboards, semantic models, reporting, embedded analytics, and AI-assisted querying at enterprise scale, but platform capability alone does not create decision quality. Decision quality comes from the disciplined integration of architecture, governance, interface design, analytical literacy, and organizational use.
| Control | Purpose | Failure it prevents |
|---|---|---|
| Certified metrics | Stabilize business definitions across reporting surfaces | Metric ambiguity and dashboard contradiction |
| Dashboard ownership | Assign responsibility for maintenance, review, and retirement | Orphaned reports and governance drift |
| Freshness indicators | Make refresh timing visible to users | Decisions based on stale data mistaken for current signals |
| Quality flags | Expose completeness, validity, missingness, or reliability concerns | False precision and overconfident interpretation |
| Lineage visibility | Connect dashboard metrics to data sources and transformation logic | Untraceable results and weak auditability |
| Thresholds and alerts | Translate signals into review, escalation, or action pathways | Dashboards that inform but do not support decisions |
| Role-aware design | Align interface complexity with user responsibility | Dashboard overload and poor cognitive fit |
| Decision review logs | Record whether evidence influenced action and follow-up | Performative analytics disconnected from real decisions |
Business intelligence and organizational learning
At its best, business intelligence does more than support isolated decisions. It contributes to organizational learning. Historical reporting allows comparison across periods. Diagnostic workflows reveal recurring bottlenecks. Scenario models expose structural vulnerabilities. Stewardship processes improve data literacy. Feedback from users refines the analytical environment itself. In this sense, BI is part of a larger learning system through which organizations observe themselves, test interpretations, and adapt behavior.
This learning function is especially important in complex institutions where decision-makers are distributed across units, regions, time horizons, and responsibilities. Shared dashboards and certified metrics can create common situational awareness, but only if they are trusted. Trust, in turn, depends on transparency, consistency, and demonstrated relevance. BI programs that treat users as passive consumers often underperform. Programs that cultivate analytical literacy, explanation, stewardship, and feedback tend to generate more durable adoption and better decision outcomes.
The strongest BI environments therefore create loops. Data becomes evidence. Evidence informs discussion. Discussion shapes decisions. Decisions produce outcomes. Outcomes feed back into future analysis. That loop is where business intelligence becomes more than reporting. It becomes institutional memory.
GitHub Repository
This article can be paired with a companion code workflow that models business intelligence as decision infrastructure. The example includes a BI metric catalog, dashboard inventory, decision-threshold table, alert-event log, decision-review dataset, SQL schemas, scorecard scripts, typed contracts, governance checklists, lifecycle documentation, and multi-language examples across Python, R, Julia, SQL, Go, Rust, C, C++, TypeScript, and Terraform placeholders.
Complete Code RepositoryThe companion repository provides a vendor-neutral business intelligence and decision-support scaffold with dashboard scorecards, metric trust scoring, alert-response summaries, decision traceability checks, SQL governance queries, typed contracts, documentation, and CI smoke-test patterns.
Conclusion
Business intelligence systems and decision support should be judged by a higher standard than visualization convenience. Their purpose is not simply to make data available, but to make organizational judgment more coherent, transparent, timely, and effective. That requires much more than dashboards. It requires reliable data architecture, governed semantics, quality observability, role-sensitive design, uncertainty-aware interpretation, decision thresholds, stewardship, and institutional routines that connect evidence to action.
Seen in this light, business intelligence is not a cosmetic reporting layer but a foundational capability of modern organizations. It is the infrastructure through which data becomes intelligible, intelligibility becomes judgment, and judgment becomes action. Where this infrastructure is weak, decisions become fragmented, reactive, and difficult to defend. Where it is strong, organizations gain not omniscience, but something far more realistic and valuable: a disciplined capacity to see, interpret, decide, act, and learn.
Related articles
- Interactive Dashboards and Data Storytelling
- Information Design and Analytical Reporting
- Analytics Engineering and Semantic Layers
- Data Quality Metrics and Observability
- Data Governance and Stewardship
- Database Systems and Data Architecture
Further reading
- Davenport, T.H. (2013) Analytics at Work: Smarter Decisions, Better Results. Boston: Harvard Business Review Press.
- Few, S. (2013) Information Dashboard Design: Displaying Data for At-a-Glance Monitoring. 2nd edn. Burlingame, CA: Analytics Press.
- Kimball, R. and Ross, M. (2013) The Data Warehouse Toolkit: The Definitive Guide to Dimensional Modeling. 3rd edn. Indianapolis: Wiley.
- March, S.T. and Hevner, A.R. (2007) ‘Integrated decision support systems: A data warehousing perspective’, in Burstein, F. and Holsapple, C.W. (eds.) Handbook on Decision Support Systems 1. Berlin: Springer, pp. 103–132.
- Power, D.J. (2002) Decision Support Systems: Concepts and Resources for Managers. Westport, CT: Quorum Books.
- Sharda, R., Delen, D. and Turban, E. (2018) Business Intelligence, Analytics, and Data Science: A Managerial Perspective. 4th edn. Harlow: Pearson.
References
- Ain, N.U., Vaia, G., DeLone, W.H. and Waheed, M. (2019) ‘Two decades of research on business intelligence system adoption, utilization and success – A systematic literature review’, Decision Support Systems, 125, 113113.
- Arnott, D. and Pervan, G. (2008) ‘Eight key issues for the decision support systems discipline’, Decision Support Systems, 44(3), pp. 657–672.
- Guan, L., Wang, X., Liang, T.-P. and others (2025) ‘40 years of Decision Support Systems: A bibliometric analysis’, Decision Support Systems.
- IBM (2026) What is Business Intelligence (BI)? Available at: https://www.ibm.com/think/topics/business-intelligence
- IBM (2026) IBM Cognos Analytics features. Available at: https://www.ibm.com/products/cognos-analytics/features
- Microsoft (2025) What is Power BI? Overview of components and benefits. Available at: https://learn.microsoft.com/en-us/power-bi/fundamentals/power-bi-overview
- Microsoft (2026) Power BI guidance documentation. Available at: https://learn.microsoft.com/en-us/power-bi/guidance/
- National Institute of Standards and Technology (2024) Research Data Framework (RDaF) Version 2.0. Available at: https://nvlpubs.nist.gov/nistpubs/SpecialPublications/1500-18/NIST.SP.1500-18r2.pdf
- Phillips-Wren, G., Iyer, L.S., Kulkarni, U. and Ariyachandra, T. (2021) ‘Reconciling business intelligence, analytics and decision support systems: More data, stronger theory’, Decision Support Systems, 140, 113560.
- Power, D.J., Heavin, C., McDermott, J. and Daly, M. (2018) ‘Defining business analytics: An empirical approach’, Journal of Business Analytics, 1(1), pp. 40–53.