
Last Updated May 7, 2026
The idea of a safe operating space is one of the central conceptual achievements of the planetary boundaries framework. It provides a way of thinking about sustainability that is neither vague nor falsely precise. Rather than treating environmental change as a set of isolated impacts to be managed after the fact, the framework asks a prior question: within what biophysical conditions can human societies continue to develop and flourish without destabilizing the Earth system?
The answer is not expressed as a promise of perfect safety. It is expressed as a zone of prudent restraint, grounded in the recognition that complex Earth-system processes can shift abruptly, interact across domains, and become difficult to reverse once critical thresholds are crossed. Safe operating space therefore names a disciplined zone of risk reduction: a way of preserving the conditions under which human development, ecological resilience, public health, infrastructure, food systems, water security, and long-term social stability remain possible.
Main Library
Publications
Article Map
Planetary Boundaries
Related Topic
Risk & Resilience
Related Topic
Systems Thinking

The logic behind safe operating space emerged from the convergence of Earth-system science, resilience theory, complex systems thinking, and precautionary governance. If the Earth system is regulated by interacting processes such as climate, biosphere integrity, freshwater dynamics, nutrient cycles, land systems, ocean chemistry, atmospheric composition, and ecological feedbacks, then human societies cannot assume that those processes will absorb unlimited pressure without consequence. A safe operating space refers to the range within which humanity is more likely to avoid triggering destabilizing changes in the systems that support habitability.
This concept is precautionary, but it is not speculative. It is built on the scientific observation that large complex systems often contain thresholds, feedbacks, lag effects, path dependence, and nonlinear dynamics. In such systems, gradual pressure can produce abrupt transformation. A lake may absorb nutrient pollution for years before shifting into a eutrophic state. A forest may lose resilience before visible dieback accelerates. An ice sheet may respond slowly before crossing a threshold that commits the system to long-term loss. Climate, water, land, and ecological systems do not always behave like simple machines that respond smoothly and reversibly to external pressure.
This article examines the meaning of safe operating space and the threshold logic that underpins it. It explains why the planetary boundaries framework does not depend on simple catastrophe narratives, why thresholds matter even under uncertainty, why boundaries are better understood as risk zones rather than hard walls, how nonlinear dynamics and feedbacks shape Earth-system risk, and why this form of reasoning has become so important for sustainability science, governance, engineering, finance, infrastructure planning, and long-term strategic thought.
What Safe Operating Space Means
A safe operating space is not a claim that the Earth can be made entirely safe, nor that all uncertainty can be eliminated. It is a scientific and strategic way of defining the range within which human societies are more likely to avoid destabilizing the Earth system. In the original 2009 formulation, Rockström and colleagues proposed that humanity should remain within planetary boundaries because crossing certain biophysical thresholds could generate unacceptable environmental change. The point was not to identify a perfectly stable equilibrium. It was to mark out a zone within which the risks of systemic disruption remained comparatively lower and the prospects for continued social development remained stronger.
This idea matters because it shifts sustainability thinking away from reactive damage control and toward anticipatory restraint. Instead of waiting until environmental systems fail visibly, the framework asks where pressure should be limited before destabilization becomes more likely. Safe operating space therefore functions as a forward-looking concept. It treats Earth-system stability as a condition that must be protected in advance rather than rebuilt after it has already been weakened.
In this sense, safe operating space is not simply a technical term within Earth-system science. It is a conceptual bridge between scientific knowledge and long-horizon governance. It translates complex system behavior into a form of strategic judgment: if the Earth system contains critical processes that support habitability, then responsible development must remain compatible with their continued resilience.
The phrase also matters because it avoids two extremes. It avoids vague sustainability language that never specifies limits, but it also avoids the illusion that exact certainty is required before action becomes legitimate. Safe operating space is a disciplined zone of risk reduction. It says that societies should remain far enough from dangerous thresholds to preserve resilience, adaptive capacity, and the possibility of durable development.
Safe operating space also reframes the meaning of environmental protection. The issue is not only whether forests, rivers, oceans, soils, species, or atmospheric systems deserve protection in isolation, though they do. The deeper point is that these systems help maintain the planetary conditions under which human societies function. Climate stability, biosphere integrity, freshwater availability, nutrient cycling, ocean chemistry, land-system function, and atmospheric regulation are not external amenities. They are operating conditions of civilization.
For the planetary boundaries framework, then, safe operating space is both a scientific warning and a governance principle. It asks institutions to preserve enough distance from danger that uncertainty, interaction, and delayed feedback do not become reasons for catastrophe.
Why Thresholds Matter
The concept of thresholds is essential to the framework. A threshold is not simply a point at which some indicator becomes undesirable. It refers to a level of pressure or change beyond which a system may shift into a qualitatively different state. In ecological and Earth-system contexts, such shifts are often nonlinear. Change may accumulate gradually for years and then produce abrupt transformation once a critical point is reached.
This is why threshold logic differs from ordinary incremental reasoning. If systems responded smoothly and reversibly to pressure, then environmental governance could proceed through continuous adjustment alone. But where thresholds exist, delay becomes more dangerous. The costs of acting late can be much larger than the costs of acting early, because after a threshold is crossed a system may reorganize in ways that are difficult, costly, or impossible to reverse. Threshold thinking therefore changes the moral and strategic structure of environmental decision-making. It makes precaution rational rather than alarmist.
Thresholds also matter because many Earth-system processes contain lag effects. The full consequence of today’s emissions, land conversion, chemical release, nutrient loading, groundwater depletion, or biodiversity loss may not be visible immediately. A system may appear stable while resilience is declining beneath the surface. By the time visible crisis emerges, the underlying capacity for recovery may already be weakened. This temporal lag is one reason safe operating space must be defined before collapse or transformation becomes obvious.
This threshold logic also explains why the planetary boundaries framework has been influential beyond environmental science. It offers a way to think about situations in which cumulative pressure, delayed feedback, and uncertain proximity to tipping points make conventional cost-benefit reasoning incomplete. For a broader companion discussion, see Uncertainty, Precaution, and Scientific Debate in Boundary Setting.
Thresholds also matter because they expose the danger of short political time horizons. A government may benefit from postponing action. A firm may benefit from externalizing costs. A financial system may discount distant harms. But Earth-system processes do not wait for electoral cycles, quarterly earnings, or policy convenience. The existence of thresholds means that decisions made under short-term incentives can lock in long-term damage.
Safe operating space therefore requires a different kind of institutional imagination. It asks societies to govern not only what is already damaged, but what is at risk of becoming irreversibly damaged if pressure continues.
Earth-System Processes Are Not Linear
The safe operating space concept depends on a basic insight from Earth-system science: planetary processes do not always change in gradual, proportional, and reversible ways. Ice sheets can pass tipping points. Forest systems can lose resilience and shift toward dieback. Nutrient loading can drive lakes and coastal zones into degraded states. Hydrological systems can change in ways that undermine both ecosystems and agriculture. Biosphere decline can weaken the functional integrity of systems that regulate climate, water, soils, and nutrient cycles.
The significance of nonlinearity is not that every process will suddenly collapse, but that the risk of abrupt and persistent change is real enough to matter for governance. This is why the planetary boundaries framework is concerned not merely with average trends, but with the structure of system behavior. A world governed by nonlinear dynamics cannot be managed prudently through assumptions of endless buffering capacity.
Nonlinearity also means that average indicators can be misleading. A climate variable, river-flow pattern, biodiversity index, nutrient load, or soil-moisture measure may appear to move gradually while risk increases more sharply in the background. A small additional pressure can sometimes produce a disproportionately large system response if resilience has already been eroded. The relevant question is therefore not only how much a variable has changed, but how close the system may be to a change in state, function, or feedback structure.
This is one reason the framework resonates with resilience science. It assumes that the relevant question is not only how much change a system can absorb, but how close it may be to transformation. For adjacent treatment, see Planetary Boundaries and Earth System Resilience.
Nonlinearity also complicates ordinary policy evaluation. A marginal increase in emissions, nutrient loading, land conversion, or chemical exposure may appear manageable if judged in isolation. But the cumulative effect of many marginal pressures can erode buffers until a system becomes vulnerable to sudden transition. This means that governance must pay attention not only to individual decisions, but to aggregate pressure across time, sectors, regions, and supply chains.
In a nonlinear world, the past is not always a reliable guide to the future. Historical stability can hide declining resilience. That is why safe operating space is a forward-looking concept: it asks what must be preserved before visible instability makes the need for preservation undeniable.
Boundaries Are Risk Zones, Not Hard Walls
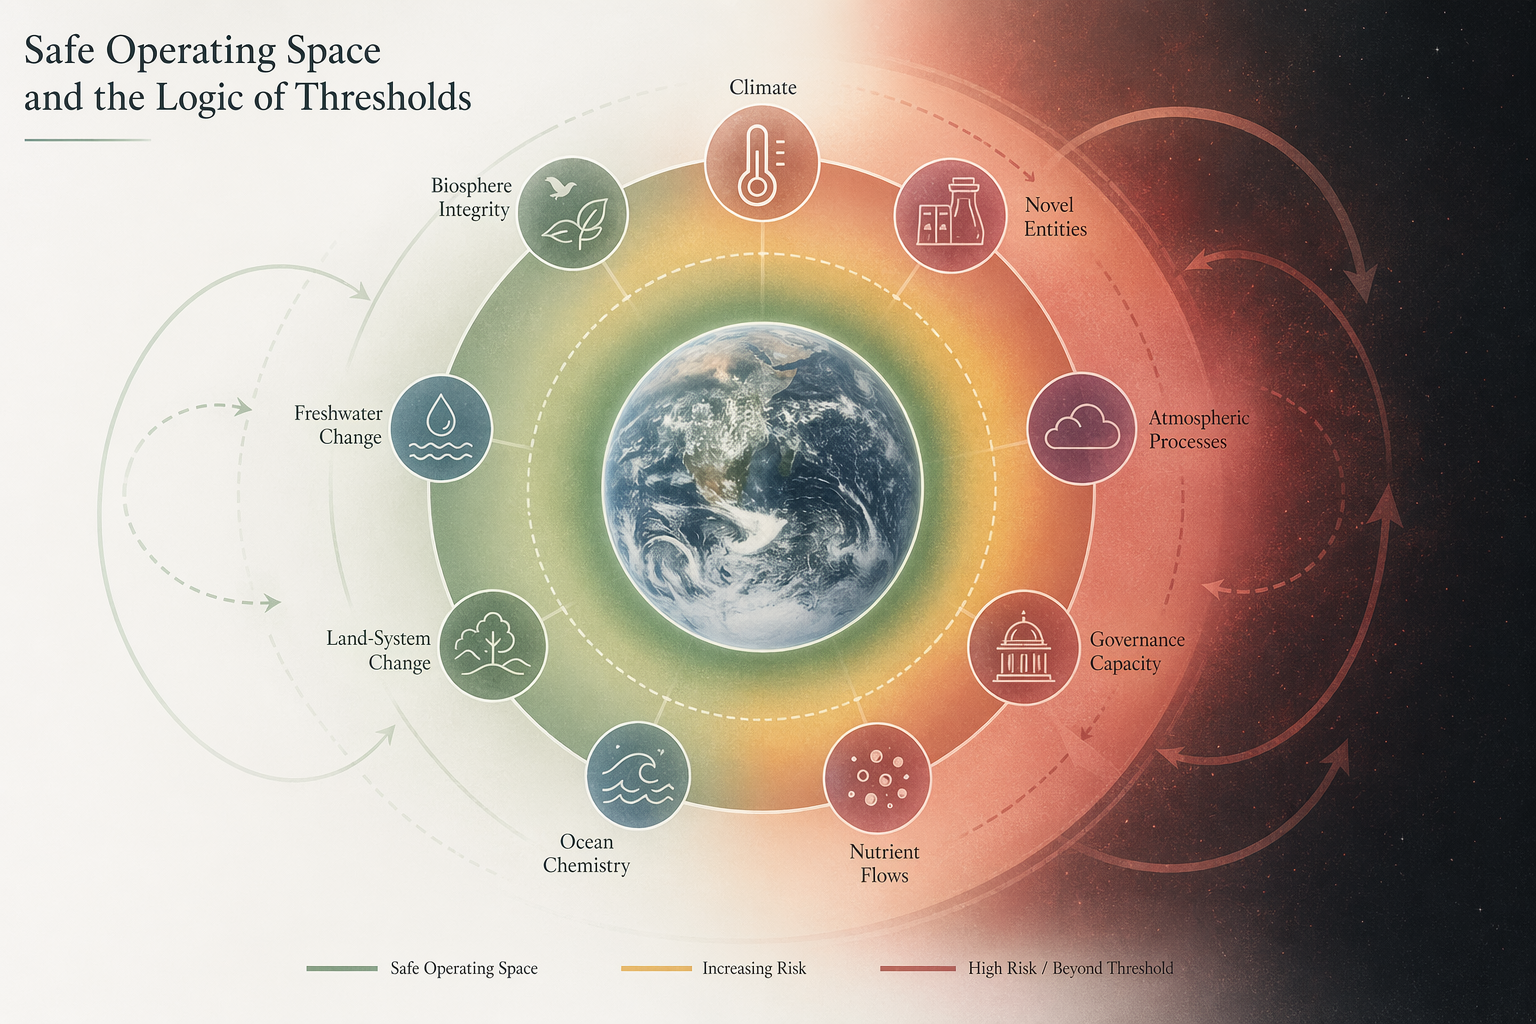
One of the most important clarifications in the literature is that planetary boundaries are not best understood as rigid lines in nature. The framework does not claim that a single exact number always separates safety from disaster. Rather, boundaries are scientifically informed zones intended to reduce the probability of crossing into dangerous states. The 2015 update clarified this logic by distinguishing a safe zone, a zone of increasing risk, and a zone of high risk.
This distinction is crucial. It prevents the framework from being misread as either mechanically deterministic or scientifically naïve. A boundary does not function like a switch that instantly turns catastrophe on. It functions more like a prudent limit within a probabilistic landscape of escalating danger. That is why the framework remains useful even when thresholds are difficult to define with absolute precision. Its value lies in organizing judgment under uncertainty, not in pretending that uncertainty has disappeared.
The risk-zone interpretation also improves communication. A system may move from safer conditions to increasing risk before entering a high-risk zone. This gradient matters for governance because it creates a practical structure for prioritization. A boundary transgression is not a reason for fatalism. It is a warning that risk is rising and that corrective action is needed before the system moves deeper into dangerous territory.
Seen this way, the framework is best understood as a structured risk architecture. It does not eliminate contestation over evidence, metrics, or interpretation. It provides a disciplined basis for arguing that some degrees of pressure are more compatible with long-term Earth-system stability than others.
Risk-zone thinking also avoids a common policy failure: waiting until a boundary has clearly been crossed before taking action. If the point of a boundary is precaution, then action should begin as pressure approaches the edge of safer conditions, especially where uncertainty is large or reversibility is low. The boundary is not the moment when concern begins. It is a formal marker in a wider gradient of rising concern.
| Zone | Meaning | Governance implication |
|---|---|---|
| Safe zone | Pressure remains within a lower-risk operating range. | Maintain monitoring, preserve buffers, prevent erosion of resilience. |
| Increasing-risk zone | Pressure is approaching or moving beyond safer conditions. | Strengthen precaution, reduce pressure, improve monitoring, act before high-risk conditions deepen. |
| High-risk zone | Pressure has moved into a region where destabilizing change becomes more likely. | Prioritize urgent response, restoration, mitigation, governance reform, and justice-centered adaptation. |
The Role of Uncertainty
Uncertainty is not incidental to the framework. It is built into it. The 2009 papers openly recognized substantial uncertainty both in the behavior of complex Earth systems and in the quantification of thresholds themselves. But that recognition did not undermine the framework. It justified its precautionary structure. If the Earth system contains thresholds that may be difficult to identify in advance, prudence requires leaving a margin for error.
This is a key point in the logic of safe operating space. Uncertainty does not always counsel delay. In threshold systems, uncertainty can strengthen the case for restraint, because waiting for perfect knowledge may mean waiting until harmful change is already underway. The framework therefore treats incomplete knowledge as a condition for responsible anticipation rather than an excuse for passivity.
Uncertainty also varies across boundaries. Some processes are better quantified than others. Climate change, ocean acidification, stratospheric ozone depletion, and biogeochemical flows have relatively strong measurement traditions. Novel entities, biosphere functional integrity, aerosol loading, and some forms of regional hydrological disruption are harder to represent with one global control variable. The safe operating space concept remains useful because it allows different levels of evidence to be interpreted within a shared risk framework.
This is also why the framework has remained intellectually credible. It does not rest on the fiction of total control. It rests on the more defensible proposition that in systems characterized by deep interdependence, lag effects, and nonlinearity, prudent governance must act before certainty is complete. See also How Planetary Boundaries Are Measured.
Uncertainty should also be interpreted ethically. When uncertainty surrounds potentially irreversible harm, and when the burdens of that harm fall unequally on vulnerable communities and future generations, the moral meaning of uncertainty changes. It is not simply a technical limitation. It is a reason to avoid imposing risks that affected people did not choose and may not have the power to escape.
In this sense, safe operating space is an argument for humility. It says that human societies should not push planetary systems to the edge merely because the exact edge cannot be drawn with perfect confidence.
Thresholds, Feedbacks, and Cascading Change
Thresholds matter even more because Earth-system processes interact. A boundary is rarely crossed in isolation. Climate change can intensify freshwater stress, reshape ecosystems, and amplify biodiversity loss. Land-system change affects carbon storage, hydrology, and regional climate. Nutrient overload can degrade freshwater and marine systems. Novel entities may weaken ecological resilience already compromised by other pressures. In such circumstances, one threshold may increase the probability of others being crossed.
This is where feedbacks and cascading change enter the framework’s logic. Feedbacks are processes through which change reinforces or dampens itself. Cascading change occurs when disruption in one system spills into others. Together they make the idea of safe operating space more compelling. The framework is not only about avoiding isolated breaches. It is about limiting the conditions under which interacting Earth-system pressures can combine into wider destabilization.
Climate feedbacks provide one clear example. Warming can reduce ice cover, weakening albedo and increasing heat absorption. Forest stress can reduce carbon uptake and moisture recycling. Permafrost thaw can release greenhouse gases. Ocean warming can alter circulation and oxygen dynamics. These feedbacks do not operate separately from land, water, biodiversity, and atmospheric chemistry. They are part of a connected Earth system.
This relational logic is central to the knowledge series as a whole. It explains why climate, biosphere integrity, freshwater, land, and nutrient cycles cannot be treated as independent policy silos. For the direct companion essay, see Tipping Points, Feedback Loops, and Cascading Ecological Change.
Cascading change also matters for social systems. A climate shock can affect food prices, migration, infrastructure, public health, fiscal capacity, and political trust. A drought can affect agriculture, hydropower, river ecosystems, groundwater, urban water supply, and conflict risk. A pollution burden can affect health, labor capacity, educational outcomes, property values, and institutional legitimacy. Earth-system thresholds therefore become social thresholds as well.
This is why safe operating space cannot be reduced to a technical environmental concept. It is a way of protecting the ecological conditions that make social stability and human dignity possible.
Safe Operating Space and Risk Architecture
Safe operating space can be understood as a risk architecture for Earth-system governance. It organizes environmental change into three linked questions. First, which Earth-system processes regulate planetary stability? Second, what indicators can help measure human pressure on those processes? Third, how far can those indicators move before the risk of destabilization becomes unacceptable? These questions do not eliminate scientific judgment, but they make judgment more explicit.
This architecture is especially useful because it separates hazard, exposure, vulnerability, and resilience. A boundary indicator may describe pressure on the Earth system, but actual risk also depends on how systems interact, how exposed societies and ecosystems are, how much adaptive capacity exists, and whether governance institutions can respond in time. The planetary boundaries framework is therefore not only about measuring environmental variables. It is about structuring a decision problem under uncertainty.
From an engineering perspective, safe operating space resembles a safety-margin problem. Engineers rarely design systems to operate continuously at the edge of failure. Bridges, aircraft, electrical grids, medical devices, and industrial systems require margins because uncertainty, stress, degradation, and unexpected interactions are unavoidable. The same logic applies to Earth-system governance, except the system is vastly more complex, the stakes are planetary, and the consequences of failure can span generations.
For this reason, safe operating space should be interpreted as a disciplined form of risk management. It does not claim to predict every outcome. It says that when systems contain thresholds and feedbacks, rational governance requires monitoring, buffers, redundancy, scenario testing, and rapid response before high-risk zones are reached.
Risk architecture also means that governance must distinguish among different kinds of information. A boundary value is not the same as a trend. A trend is not the same as a threshold. A threshold is not the same as exposure. Exposure is not the same as vulnerability. Vulnerability is not the same as justice. A mature safe-operating-space framework keeps these distinctions visible rather than hiding them inside a single score.
The value of the framework lies in that discipline. It helps institutions ask not only what is happening, but how close systems are to danger, how confident the evidence is, who is exposed, which capacities are weak, and what response is required before harm becomes locked in.
Why the Framework Is Precautionary
The planetary boundaries framework is explicitly precautionary because it begins from the possibility of unacceptable change before exact outcomes are known. It does not wait for irreversible shifts to become obvious. It treats the protection of Earth-system stability as a precondition for human development rather than a secondary environmental preference. This is why the language of safe operating space is so consequential. It links biophysical science to a norm of strategic restraint.
Precaution here should not be confused with pessimism. The framework does not say that human societies must cease development or retreat from modern life. It says that development must remain compatible with the conditions that make durable social flourishing possible. That is a stronger and more realistic claim than either ecological fatalism or techno-optimist complacency.
Properly understood, the precautionary character of the framework is what gives it institutional relevance. It offers a justification for acting before risk becomes catastrophic and before reversal becomes prohibitively costly. In that sense, it belongs alongside precautionary reasoning in public health, engineering safety, financial regulation, disaster planning, food safety, and infrastructure governance.
The framework’s precautionary logic also has ethical significance. The burden of proof should not always fall on those warning about systemic risk, especially when the harms are potentially irreversible and unevenly distributed. Where planetary systems support all societies, and where future generations cannot consent to present risk, precaution becomes a principle of responsibility.
Precaution also protects possibility. Once systems are pushed into high-risk zones, societies may lose options. Restoration becomes harder. Adaptation becomes more expensive. Governance becomes more reactive. Vulnerable communities experience greater harm. By contrast, acting earlier preserves room for learning, adjustment, and justice-centered transition.
Safe operating space is therefore not an argument for fear. It is an argument for keeping enough room to choose better futures.
Justice and Safe Operating Space
Safe operating space cannot be interpreted only as a global technical zone. It must also be interpreted through justice. The pressures that push humanity toward planetary boundaries are not produced equally. High-consuming societies, fossil-fuel-intensive economies, extractive industries, industrial agriculture, wealthy households, and historically powerful states have contributed disproportionately to many Earth-system pressures. At the same time, low-income communities, Indigenous peoples, small island states, subsistence farmers, coastal populations, informal settlements, and future generations often face the greatest exposure to the consequences.
This means that safe operating space must be paired with social foundations. A world inside ecological limits but marked by deprivation, exclusion, and unequal exposure would not be an adequate model of sustainability. Likewise, a world that expands development by destabilizing climate, water, land, biodiversity, oceans, and chemical safety would undermine the conditions of future wellbeing. The central challenge is to secure human dignity within ecological ceilings.
A justice-centered interpretation also distinguishes between survival needs and destructive excess. Expanding clean energy access for communities without reliable electricity is not the same as maintaining luxury emissions in already wealthy economies. Building basic water and sanitation infrastructure is not the same as intensifying wasteful consumption. Protecting development space for the deprived is compatible with reducing planetary pressure if high-pressure systems are transformed.
Safe operating space therefore has a distributive dimension. It asks not only how much pressure the Earth system can absorb, but who is using ecological space, who benefits from that use, who is harmed by overshoot, and who has the authority to define acceptable risk. Without those questions, the concept can become technocratic. With them, it becomes a framework for accountable planetary responsibility.
This is why the safe-operating-space concept connects naturally to Planetary Boundaries, Justice, and Global Inequality and Planetary Boundaries and Doughnut Economics. Ecological ceilings and social foundations must be governed together.
Implications for Governance and Strategy
Safe operating space has major implications for governance because it implies that environmental policy cannot be limited to repairing damage after it occurs. Institutions must instead develop the capacity to monitor pressure, recognize early warnings, and maintain buffers against crossing thresholds. This calls for long time horizons, better indicators, cross-sector coordination, and a willingness to govern cumulative risk rather than only visible crisis.
It also has implications for economic and strategic reasoning. If planetary stability is a precondition for infrastructure, food systems, water security, public health, economic continuity, and long-term development, then safe operating space is not a niche environmental concept. It is a framework for thinking about the material conditions of civilization itself. Business strategy, public finance, infrastructure planning, and international governance all become more realistic when they acknowledge that the Earth system is not an unlimited sink for disturbance.
Safe operating space also challenges the tendency to treat environmental risks as externalities. A threshold-based framework shows that some externalities are not marginal. They can accumulate into systemic risk. Once the stability of climate, ecosystems, water cycles, ocean chemistry, or nutrient flows is degraded, the costs are not confined to one sector. They propagate through food systems, health systems, insurance markets, public finance, migration patterns, ecological resilience, and geopolitical stability.
This is why the concept now travels across multiple fields. It informs debates about risk disclosure, resilience planning, sustainability reporting, adaptation, ecological restoration, transition finance, and the governance of compound threats. See, in particular, Earth System Governance in an Age of Limits, Business Strategy Within Planetary Boundaries, and Finance, Disclosure, and Systemic Environmental Risk.
Governance for safe operating space must also become more adaptive. Since exact thresholds are uncertain and conditions change, institutions must be able to revise policies, learn from monitoring, incorporate local knowledge, respond to weak signals, and adjust before crisis deepens. This requires public trust, scientific independence, transparent data, legal accountability, and democratic legitimacy.
The strategic implication is clear: societies should not optimize for short-term output while eroding the planetary buffers that make long-term prosperity possible. Strategy under threshold risk must be resilience-aware, justice-aware, and precautionary.
Engineering and Monitoring Implications
The safe operating space concept is especially useful for engineers, data scientists, planners, and analysts because it can be translated into monitoring architectures. A boundary is not useful only as an abstract concept. It becomes operational when indicators, thresholds, uncertainty bands, trend rates, early-warning signals, data provenance, and decision rules are connected into a reproducible system.
An engineering approach to safe operating space should distinguish at least five layers. The first layer is measurement: what is being observed, by whom, at what frequency, using which method, and with what uncertainty? The second layer is normalization: how are indicators scaled relative to a boundary, baseline, or reference condition? The third layer is risk classification: when does a system move from safe to increasing risk to high risk? The fourth layer is feedback analysis: how does one boundary interact with others? The fifth layer is governance response: who acts, with what authority, and on what time horizon?
This makes safe operating space a natural fit for reproducible analytics. Python and R can support scenario testing, dashboarding, sensitivity analysis, uncertainty propagation, and monitoring workflows. SQL can support audit trails, source provenance, and boundary indicator storage. Rust and Go can support reliable scoring engines and APIs. C and C++ can support embedded monitoring and high-performance simulations. TinyML can support edge-side anomaly detection, while PYNQ-style workflows can support accelerated preprocessing of environmental telemetry.
The engineering challenge is not to pretend that all Earth-system risk can be reduced to a dashboard. It is to build systems that make uncertainty visible, assumptions auditable, indicators comparable, and governance response more timely. Safe operating space is therefore not only a scientific metaphor. It can become a design principle for environmental intelligence systems.
A mature monitoring architecture should also include review workflows. Boundary indicators should be versioned. Control variables should have documented provenance. Uncertainty should be visible rather than hidden. Scenario assumptions should be inspectable. Equity and exposure data should be incorporated where relevant. Decision rules should be clear enough to audit. Without these design choices, safe-operating-space analytics can become decorative. With them, it can become a foundation for accountable environmental governance.
Why This Matters for Planetary Boundaries
Safe operating space matters because it explains the core logic of the planetary boundaries framework. The boundaries are not simply a list of environmental concerns. They are an attempt to identify the Earth-system conditions within which humanity can continue to develop without raising the risk of destabilizing planetary processes. Without the safe-operating-space concept, planetary boundaries can look like a diagram. With it, they become a theory of precautionary development under uncertainty.
The concept also matters because it clarifies why boundaries are not hard walls. A planetary boundary is placed in relation to risk, uncertainty, and threshold behavior. Crossing it does not mean instant collapse, but it does mean that society has moved into a more dangerous region of Earth-system change. The point is to maintain distance from danger, not to test exactly how much pressure the system can tolerate before it fails.
Safe operating space also gives planetary-boundary governance its temporal structure. It asks institutions to act before crisis is unmistakable, before restoration becomes more difficult, and before vulnerable communities bear avoidable harm. This is why the concept belongs with resilience, precaution, justice, and long-term public responsibility.
Finally, safe operating space matters because it keeps the goal clear. The point is not environmental restraint for its own sake. The point is to preserve the biophysical conditions of human dignity, social continuity, ecological resilience, and future possibility. It is a framework for flourishing within limits.
To understand safe operating space is therefore to understand the moral and scientific center of planetary-boundary thinking: development can be legitimate, ambitious, and humane only if it remains compatible with the Earth-system foundations that make development possible.
Mathematical Lens: Boundary Distance, Uncertainty, and Threshold Risk
Safe operating space can be represented through boundary distance, uncertainty margins, pressure trends, and feedback amplification. Let \(X_t\) represent the observed value of an Earth-system control variable at time \(t\), and let \(B\) represent the boundary value. A simple boundary pressure ratio can be written as:
P_t = \frac{X_t}{B}
\]
Interpretation: The pressure ratio compares observed Earth-system pressure with a boundary reference value.
If \(P_t < 1\), the system remains inside the boundary reference. If \(P_t > 1\), the boundary has been transgressed. However, the planetary boundaries framework is not only about crossing a single line. It is about risk under uncertainty. Let \(\sigma_B\) represent uncertainty around the boundary estimate. A precautionary buffer can be defined as:
M_t = \frac{B – X_t}{\sigma_B}
\]
Interpretation: The precautionary margin shows how many uncertainty units remain before the system reaches the boundary.
A smaller margin indicates rising concern even before formal transgression. A risk-zone score can be represented with a logistic function:
R_t = \frac{1}{1 + e^{-k(P_t – 1)}}
\]
Interpretation: The risk score rises as pressure approaches or exceeds the boundary. The parameter \(k\) controls how sharply risk rises near the boundary.
This formulation does not imply that real Earth-system risk follows a perfect logistic curve. It simply provides a transparent way to model increasing risk around a threshold. Because planetary boundaries interact, a cross-boundary amplification term can be added:
A_i = \sum_{j \neq i} w_{ij}R_j
\]
Interpretation: Cross-boundary amplification represents how risk in one boundary domain can intensify risk in another.
A combined systemic risk score can then be written as:
S_i = R_i(1 + A_i)(1 – G_i)
\]
Interpretation: Systemic risk rises when threshold risk and cross-boundary amplification increase, and falls when governance, monitoring, or adaptive capacity is stronger.
| Term | Meaning | Interpretive role |
|---|---|---|
| \(X_t\) | Observed control variable | Represents measured or estimated pressure on an Earth-system process. |
| \(B\) | Boundary value | Represents the proposed boundary reference for that process. |
| \(P_t\) | Pressure ratio | Shows whether the process is below, near, or beyond the boundary reference. |
| \(\sigma_B\) | Uncertainty band | Represents measurement, threshold, proxy, or model uncertainty. |
| \(M_t\) | Precautionary margin | Shows how much buffer remains relative to uncertainty. |
| \(R_t\) | Risk-zone score | Represents rising risk as pressure approaches or exceeds the boundary. |
| \(w_{ij}\) | Interaction weight | Represents how risk in boundary \(j\) can amplify risk in boundary \(i\). |
| \(A_i\) | Cross-boundary amplification | Aggregates interaction effects from other boundary processes. |
| \(G_i\) | Governance capacity | Represents monitoring, response, adaptation, and reversibility capacity. |
| \(S_i\) | Systemic risk score | Represents combined threshold risk after amplification and governance capacity are considered. |
This simplified formulation captures the framework’s central logic: risk rises when pressure approaches or exceeds boundaries, uncertainty margins shrink, other boundaries amplify stress, and governance capacity is weak. It is not a substitute for Earth-system science. It is a transparent way to turn threshold reasoning into reproducible diagnostics.
Advanced Python Workflow: Safe Operating Space Risk Diagnostics
The following Python workflow models safe operating space as a boundary-distance, uncertainty, risk-zone, and cross-boundary amplification problem. It separates observed pressure, boundary value, uncertainty margin, trend direction, interaction strength, monitoring capacity, governance capacity, reversibility capacity, and response urgency. The values are illustrative, but the structure can be adapted for planetary-boundary dashboards, sustainability reporting, environmental monitoring, scenario analysis, infrastructure risk systems, and auditable decision support.
"""
Safe operating space and threshold-risk diagnostics.

This workflow models planetary-boundary risk using:
- observed control-variable pressure
- boundary values
- uncertainty margins
- boundary pressure ratios
- threshold-risk scores
- risk-zone classification
- trend direction
- cross-boundary amplification
- monitoring capacity
- governance capacity
- reversibility capacity
- response urgency
- scenario comparison

The values are illustrative. Replace them with documented control variables,
boundary estimates, uncertainty ranges, monitoring records, source provenance,
and transparent assumptions before applied use.
"""

from __future__ import annotations

from dataclasses import dataclass
from pathlib import Path
from typing import Literal

import numpy as np
import pandas as pd


RiskZone = Literal[
    "safe_zone",
    "increasing_risk_zone",
    "high_risk_zone",
]


@dataclass(frozen=True)
class BoundaryProfile:
    """Planetary-boundary profile for threshold-risk analysis."""

    boundary: str
    observed_value: float
    boundary_value: float
    uncertainty_band: float
    annual_pressure_trend: float
    monitoring_capacity: float
    governance_capacity: float
    reversibility_capacity: float
    interaction_weight: float


def build_boundary_profiles() -> pd.DataFrame:
    """
    Create illustrative planetary-boundary profiles.

    Values are normalized for demonstration. They are not official estimates.
    """
    profiles = [
        BoundaryProfile("climate_change", 1.28, 1.00, 0.10, 0.020, 0.82, 0.56, 0.42, 0.92),
        BoundaryProfile("biosphere_integrity", 1.75, 1.00, 0.18, 0.030, 0.60, 0.44, 0.30, 0.96),
        BoundaryProfile("land_system_change", 1.22, 1.00, 0.14, 0.018, 0.72, 0.52, 0.44, 0.78),
        BoundaryProfile("freshwater_change", 1.36, 1.00, 0.16, 0.022, 0.66, 0.46, 0.38, 0.82),
        BoundaryProfile("biogeochemical_flows", 1.62, 1.00, 0.20, 0.026, 0.70, 0.42, 0.36, 0.84),
        BoundaryProfile("ocean_acidification", 1.08, 1.00, 0.12, 0.016, 0.76, 0.50, 0.34, 0.66),
        BoundaryProfile("novel_entities", 1.80, 1.00, 0.28, 0.032, 0.48, 0.34, 0.22, 0.74),
        BoundaryProfile("atmospheric_aerosols", 0.74, 1.00, 0.22, 0.006, 0.54, 0.40, 0.46, 0.58),
        BoundaryProfile("stratospheric_ozone", 0.42, 1.00, 0.12, -0.004, 0.88, 0.82, 0.76, 0.36),
    ]

    return pd.DataFrame([profile.__dict__ for profile in profiles])


def logistic_risk(pressure_ratio: pd.Series, steepness: float = 8.0) -> pd.Series:
    """
    Convert a boundary pressure ratio into a smooth risk score.

    The logistic curve is a transparent modeling choice for risk-zone analysis.
    It is not a claim that Earth-system risk follows this exact mathematical form.
    """
    return 1 / (1 + np.exp(-steepness * (pressure_ratio - 1)))


def classify_risk_zone(pressure_ratio: float) -> RiskZone:
    """Classify boundary status using simple risk-zone thresholds."""
    if pressure_ratio < 0.80:
        return "safe_zone"
    if pressure_ratio < 1.00:
        return "increasing_risk_zone"
    return "high_risk_zone"


def score_safe_operating_space(data: pd.DataFrame) -> pd.DataFrame:
    """Calculate safe operating space diagnostics."""
    scored = data.copy()

    for column in ["boundary_value", "uncertainty_band"]:
        if (scored[column] <= 0).any():
            raise ValueError(f"{column} must contain only positive values.")

    scored["boundary_pressure_ratio"] = (
        scored["observed_value"] / scored["boundary_value"]
    )

    scored["uncertainty_margin"] = (
        scored["boundary_value"] - scored["observed_value"]
    ) / scored["uncertainty_band"]

    scored["threshold_risk_score"] = logistic_risk(
        scored["boundary_pressure_ratio"],
        steepness=8.0,
    )

    scored["risk_zone"] = scored["boundary_pressure_ratio"].apply(classify_risk_zone)

    scored["trend_pressure"] = np.maximum(0, scored["annual_pressure_trend"])

    scored["monitoring_gap"] = 1 - scored["monitoring_capacity"]
    scored["governance_gap"] = 1 - scored["governance_capacity"]
    scored["reversibility_gap"] = 1 - scored["reversibility_capacity"]

    mean_other_risk = scored["threshold_risk_score"].mean()

    scored["cross_boundary_amplification"] = (
        scored["interaction_weight"] * mean_other_risk
    )

    scored["systemic_threshold_risk"] = (
        scored["threshold_risk_score"]
        * (1 + scored["cross_boundary_amplification"])
        * (
            1
            + 0.25 * scored["monitoring_gap"]
            + 0.35 * scored["governance_gap"]
            + 0.25 * scored["reversibility_gap"]
            + 0.15 * scored["trend_pressure"]
        )
    )

    scored["response_urgency"] = np.select(
        [
            scored["boundary_pressure_ratio"] >= 1.50,
            scored["boundary_pressure_ratio"] >= 1.00,
            scored["boundary_pressure_ratio"] >= 0.80,
            scored["annual_pressure_trend"] > 0.01,
        ],
        [
            "immediate_systemic_response",
            "boundary_transgression_response",
            "precautionary_buffer_response",
            "trend_reversal_response",
        ],
        default="maintain_monitoring_and_resilience",
    )

    return scored.sort_values(
        "systemic_threshold_risk",
        ascending=False,
    ).reset_index(drop=True)


def run_scenarios(data: pd.DataFrame) -> pd.DataFrame:
    """
    Test how systemic threshold risk changes under governance scenarios.
    """
    scenarios = {
        "baseline": {
            "pressure_multiplier": 1.00,
            "trend_multiplier": 1.00,
            "monitoring_gain": 0.00,
            "governance_gain": 0.00,
            "reversibility_gain": 0.00,
        },
        "improved_monitoring": {
            "pressure_multiplier": 0.98,
            "trend_multiplier": 0.90,
            "monitoring_gain": 0.16,
            "governance_gain": 0.08,
            "reversibility_gain": 0.04,
        },
        "precautionary_buffer_restoration": {
            "pressure_multiplier": 0.88,
            "trend_multiplier": 0.70,
            "monitoring_gain": 0.12,
            "governance_gain": 0.14,
            "reversibility_gain": 0.12,
        },
        "cross_boundary_risk_reduction": {
            "pressure_multiplier": 0.82,
            "trend_multiplier": 0.55,
            "monitoring_gain": 0.16,
            "governance_gain": 0.20,
            "reversibility_gain": 0.16,
        },
        "integrated_safe_operating_space_strategy": {
            "pressure_multiplier": 0.72,
            "trend_multiplier": 0.35,
            "monitoring_gain": 0.22,
            "governance_gain": 0.28,
            "reversibility_gain": 0.22,
        },
    }

    frames = []

    for scenario_name, params in scenarios.items():
        scenario = data.copy()

        scenario["observed_value"] = (
            scenario["observed_value"] * params["pressure_multiplier"]
        )

        scenario["annual_pressure_trend"] = (
            scenario["annual_pressure_trend"] * params["trend_multiplier"]
        )

        scenario["monitoring_capacity"] = np.minimum(
            1.0,
            scenario["monitoring_capacity"] + params["monitoring_gain"],
        )
        scenario["governance_capacity"] = np.minimum(
            1.0,
            scenario["governance_capacity"] + params["governance_gain"],
        )
        scenario["reversibility_capacity"] = np.minimum(
            1.0,
            scenario["reversibility_capacity"] + params["reversibility_gain"],
        )

        scored = score_safe_operating_space(scenario)
        scored["scenario"] = scenario_name
        scored["rank"] = scored["systemic_threshold_risk"].rank(
            ascending=False,
            method="dense",
        )
        frames.append(scored)

    return pd.concat(frames, ignore_index=True)


def main() -> None:
    """Run safe operating space diagnostics."""
    output_dir = Path(
        "articles/safe-operating-space-and-the-logic-of-thresholds/outputs"
    )
    output_dir.mkdir(parents=True, exist_ok=True)

    data = build_boundary_profiles()
    scored = score_safe_operating_space(data)
    scenarios = run_scenarios(data)

    scored.to_csv(output_dir / "safe_operating_space_scores.csv", index=False)
    scenarios.to_csv(output_dir / "safe_operating_space_scenarios.csv", index=False)

    display_columns = [
        "boundary",
        "boundary_pressure_ratio",
        "uncertainty_margin",
        "threshold_risk_score",
        "cross_boundary_amplification",
        "systemic_threshold_risk",
        "risk_zone",
        "response_urgency",
    ]

    print("\nSafe operating space diagnostics:")
    print(scored[display_columns].round(3).to_string(index=False))

    print("\nScenario comparison:")
    print(
        scenarios[
            [
                "scenario",
                "boundary",
                "boundary_pressure_ratio",
                "uncertainty_margin",
                "threshold_risk_score",
                "cross_boundary_amplification",
                "systemic_threshold_risk",
                "risk_zone",
                "response_urgency",
                "rank",
            ]
        ].round(3).to_string(index=False)
    )


if __name__ == "__main__":
    main()
This workflow is useful because it turns threshold reasoning into a transparent analytical structure. It separates boundary pressure, uncertainty margin, risk-zone classification, trend direction, cross-boundary amplification, monitoring capacity, governance capacity, and reversibility capacity. That distinction matters because safe operating space is not a single number. It is a structured way of judging how close different Earth-system processes are to high-risk zones and how much institutional capacity exists to respond.
A mature implementation should include source provenance, control-variable definitions, uncertainty intervals, historical baselines, review notes, stakeholder interpretation, and explicit documentation of all weights. The purpose is not to automate planetary judgment. It is to make judgment more transparent, reproducible, and accountable.
Advanced R Workflow: Threshold Dashboarding
The following R workflow prepares dashboard-ready outputs for safe operating space analysis. It is designed for researchers, engineers, sustainability analysts, governance teams, environmental monitoring groups, risk analysts, and strategy teams who need to compare boundary pressure, uncertainty margins, risk zones, amplification, and response urgency across planetary-boundary processes.
# Safe operating space and threshold-risk dashboard
#
# This workflow scores planetary-boundary risk across:
# - observed pressure
# - boundary values
# - uncertainty margins
# - boundary pressure ratios
# - threshold-risk scores
# - risk-zone classification
# - cross-boundary amplification
# - monitoring capacity
# - governance capacity
# - reversibility capacity
#
# Values are illustrative and should be replaced with documented control
# variables, boundary estimates, uncertainty ranges, monitoring records,
# source provenance, and transparent assumptions before applied use.

library(readr)
library(dplyr)
library(tidyr)

boundary_profiles <- tibble::tibble(
  boundary = c(
    "climate_change",
    "biosphere_integrity",
    "land_system_change",
    "freshwater_change",
    "biogeochemical_flows",
    "ocean_acidification",
    "novel_entities",
    "atmospheric_aerosols",
    "stratospheric_ozone"
  ),
  observed_value = c(1.28, 1.75, 1.22, 1.36, 1.62, 1.08, 1.80, 0.74, 0.42),
  boundary_value = c(1, 1, 1, 1, 1, 1, 1, 1, 1),
  uncertainty_band = c(0.10, 0.18, 0.14, 0.16, 0.20, 0.12, 0.28, 0.22, 0.12),
  annual_pressure_trend = c(0.020, 0.030, 0.018, 0.022, 0.026, 0.016, 0.032, 0.006, -0.004),
  monitoring_capacity = c(0.82, 0.60, 0.72, 0.66, 0.70, 0.76, 0.48, 0.54, 0.88),
  governance_capacity = c(0.56, 0.44, 0.52, 0.46, 0.42, 0.50, 0.34, 0.40, 0.82),
  reversibility_capacity = c(0.42, 0.30, 0.44, 0.38, 0.36, 0.34, 0.22, 0.46, 0.76),
  interaction_weight = c(0.92, 0.96, 0.78, 0.82, 0.84, 0.66, 0.74, 0.58, 0.36)
)

logistic_risk <- function(pressure_ratio, steepness = 8) {
  1 / (1 + exp(-steepness * (pressure_ratio - 1)))
}

scored <- boundary_profiles %>%
  mutate(
    boundary_pressure_ratio = observed_value / boundary_value,

    uncertainty_margin = (boundary_value - observed_value) / uncertainty_band,

    threshold_risk_score = logistic_risk(boundary_pressure_ratio, steepness = 8),

    risk_zone = case_when(
      boundary_pressure_ratio < 0.80 ~ "safe_zone",
      boundary_pressure_ratio < 1.00 ~ "increasing_risk_zone",
      TRUE ~ "high_risk_zone"
    ),

    trend_pressure = pmax(0, annual_pressure_trend),

    monitoring_gap = 1 - monitoring_capacity,
    governance_gap = 1 - governance_capacity,
    reversibility_gap = 1 - reversibility_capacity,

    cross_boundary_amplification =
      interaction_weight * mean(threshold_risk_score),

    systemic_threshold_risk =
      threshold_risk_score *
      (1 + cross_boundary_amplification) *
      (
        1 +
        0.25 * monitoring_gap +
        0.35 * governance_gap +
        0.25 * reversibility_gap +
        0.15 * trend_pressure
      ),

    response_urgency = case_when(
      boundary_pressure_ratio >= 1.50 ~ "immediate_systemic_response",
      boundary_pressure_ratio >= 1.00 ~ "boundary_transgression_response",
      boundary_pressure_ratio >= 0.80 ~ "precautionary_buffer_response",
      annual_pressure_trend > 0.01 ~ "trend_reversal_response",
      TRUE ~ "maintain_monitoring_and_resilience"
    )
  ) %>%
  arrange(desc(systemic_threshold_risk))

dashboard_long <- scored %>%
  select(
    boundary,
    boundary_pressure_ratio,
    uncertainty_margin,
    threshold_risk_score,
    cross_boundary_amplification,
    systemic_threshold_risk
  ) %>%
  pivot_longer(
    cols = -boundary,
    names_to = "metric",
    values_to = "value"
  )

scenario_grid <- tibble::tibble(
  scenario = c(
    "baseline",
    "improved_monitoring",
    "precautionary_buffer_restoration",
    "cross_boundary_risk_reduction",
    "integrated_safe_operating_space_strategy"
  ),
  pressure_multiplier = c(1.00, 0.98, 0.88, 0.82, 0.72),
  trend_multiplier = c(1.00, 0.90, 0.70, 0.55, 0.35),
  monitoring_gain = c(0.00, 0.16, 0.12, 0.16, 0.22),
  governance_gain = c(0.00, 0.08, 0.14, 0.20, 0.28),
  reversibility_gain = c(0.00, 0.04, 0.12, 0.16, 0.22)
)

scenario_scores <- boundary_profiles %>%
  crossing(scenario_grid) %>%
  mutate(
    observed_value = observed_value * pressure_multiplier,
    annual_pressure_trend = annual_pressure_trend * trend_multiplier,

    monitoring_capacity = pmin(1, monitoring_capacity + monitoring_gain),
    governance_capacity = pmin(1, governance_capacity + governance_gain),
    reversibility_capacity = pmin(1, reversibility_capacity + reversibility_gain),

    boundary_pressure_ratio = observed_value / boundary_value,
    uncertainty_margin = (boundary_value - observed_value) / uncertainty_band,
    threshold_risk_score = logistic_risk(boundary_pressure_ratio, steepness = 8),

    risk_zone = case_when(
      boundary_pressure_ratio < 0.80 ~ "safe_zone",
      boundary_pressure_ratio < 1.00 ~ "increasing_risk_zone",
      TRUE ~ "high_risk_zone"
    ),

    trend_pressure = pmax(0, annual_pressure_trend),
    monitoring_gap = 1 - monitoring_capacity,
    governance_gap = 1 - governance_capacity,
    reversibility_gap = 1 - reversibility_capacity,

    cross_boundary_amplification =
      interaction_weight * mean(threshold_risk_score),

    systemic_threshold_risk =
      threshold_risk_score *
      (1 + cross_boundary_amplification) *
      (
        1 +
        0.25 * monitoring_gap +
        0.35 * governance_gap +
        0.25 * reversibility_gap +
        0.15 * trend_pressure
      ),

    response_urgency = case_when(
      boundary_pressure_ratio >= 1.50 ~ "immediate_systemic_response",
      boundary_pressure_ratio >= 1.00 ~ "boundary_transgression_response",
      boundary_pressure_ratio >= 0.80 ~ "precautionary_buffer_response",
      annual_pressure_trend > 0.01 ~ "trend_reversal_response",
      TRUE ~ "maintain_monitoring_and_resilience"
    )
  ) %>%
  group_by(scenario) %>%
  mutate(rank = dense_rank(desc(systemic_threshold_risk))) %>%
  ungroup()

risk_summary <- scored %>%
  group_by(risk_zone) %>%
  summarise(
    boundaries = n(),
    mean_boundary_pressure_ratio = mean(boundary_pressure_ratio),
    mean_threshold_risk_score = mean(threshold_risk_score),
    mean_systemic_threshold_risk = mean(systemic_threshold_risk),
    .groups = "drop"
  )

output_dir <- "articles/safe-operating-space-and-the-logic-of-thresholds/outputs"

dir.create(
  output_dir,
  recursive = TRUE,
  showWarnings = FALSE
)

write_csv(
  scored,
  file.path(output_dir, "r_safe_operating_space_scores.csv")
)

write_csv(
  dashboard_long,
  file.path(output_dir, "r_dashboard_long.csv")
)

write_csv(
  scenario_scores,
  file.path(output_dir, "r_policy_scenarios.csv")
)

write_csv(
  risk_summary,
  file.path(output_dir, "r_risk_summary.csv")
)

print(scored)
print(risk_summary)
This R workflow is designed for transparent interpretation rather than false precision. It shows how a safe operating space can be modeled as a combination of boundary distance, uncertainty margin, increasing risk, high-risk transgression, interaction effects, and governance capacity. It also makes the precautionary logic explicit: a boundary does not need to be crossed before concern becomes rational. Shrinking buffers, worsening trends, weak monitoring, and low reversibility can justify action before a system enters the high-risk zone.
Because the workflow outputs both wide and long data structures, it can support dashboards, reports, visualizations, scenario comparisons, and audit workflows. It can also be extended with spatial disaggregation, equity exposure, policy triggers, data-source metadata, and uncertainty intervals.
Advanced Go Workflow: Lightweight Threshold-Risk Scoring Service
The following Go workflow translates the same threshold-risk logic into a compact scoring service. Go is useful for command-line tools, APIs, monitoring systems, and operational risk engines. This example reads boundary records from a CSV file and reports pressure ratio, uncertainty margin, threshold risk, cross-boundary amplification, systemic threshold risk, risk zone, and response urgency.
package main

import (
	"encoding/csv"
	"errors"
	"fmt"
	"math"
	"os"
	"strconv"
)

type BoundaryRecord struct {
	Boundary              string
	ObservedValue          float64
	BoundaryValue          float64
	UncertaintyBand        float64
	AnnualPressureTrend    float64
	MonitoringCapacity     float64
	GovernanceCapacity     float64
	ReversibilityCapacity  float64
	InteractionWeight      float64
	MeanOtherThresholdRisk float64
}

func parseFloat(value string) (float64, error) {
	parsed, err := strconv.ParseFloat(value, 64)
	if err != nil {
		return 0, fmt.Errorf("invalid numeric value %q: %w", value, err)
	}
	return parsed, nil
}

func parseRecord(row []string) (BoundaryRecord, error) {
	if len(row) < 9 {
		return BoundaryRecord{}, errors.New("expected at least 9 columns")
	}

	values := make([]float64, 8)
	for i := 1; i < 9; i++ {
		parsed, err := parseFloat(row[i])
		if err != nil {
			return BoundaryRecord{}, err
		}
		values[i-1] = parsed
	}

	return BoundaryRecord{
		Boundary:             row[0],
		ObservedValue:        values[0],
		BoundaryValue:        values[1],
		UncertaintyBand:      values[2],
		AnnualPressureTrend:  values[3],
		MonitoringCapacity:   values[4],
		GovernanceCapacity:   values[5],
		ReversibilityCapacity: values[6],
		InteractionWeight:    values[7],
	}, nil
}

func pressureRatio(record BoundaryRecord) float64 {
	if record.BoundaryValue <= 0 {
		return math.NaN()
	}
	return record.ObservedValue / record.BoundaryValue
}

func uncertaintyMargin(record BoundaryRecord) float64 {
	if record.UncertaintyBand <= 0 {
		return math.NaN()
	}
	return (record.BoundaryValue - record.ObservedValue) / record.UncertaintyBand
}

func thresholdRisk(record BoundaryRecord) float64 {
	steepness := 8.0
	ratio := pressureRatio(record)
	return 1 / (1 + math.Exp(-steepness*(ratio-1)))
}

func riskZone(record BoundaryRecord) string {
	ratio := pressureRatio(record)

	switch {
	case ratio < 0.80:
		return "safe_zone"
	case ratio < 1.00:
		return "increasing_risk_zone"
	default:
		return "high_risk_zone"
	}
}

func crossBoundaryAmplification(record BoundaryRecord) float64 {
	return record.InteractionWeight * record.MeanOtherThresholdRisk
}

func systemicThresholdRisk(record BoundaryRecord) float64 {
	monitoringGap := 1 - record.MonitoringCapacity
	governanceGap := 1 - record.GovernanceCapacity
	reversibilityGap := 1 - record.ReversibilityCapacity
	trendPressure := math.Max(0, record.AnnualPressureTrend)

	return thresholdRisk(record) *
		(1 + crossBoundaryAmplification(record)) *
		(
			1 +
				0.25*monitoringGap +
				0.35*governanceGap +
				0.25*reversibilityGap +
				0.15*trendPressure)
}

func responseUrgency(record BoundaryRecord) string {
	ratio := pressureRatio(record)

	switch {
	case ratio >= 1.50:
		return "immediate_systemic_response"
	case ratio >= 1.00:
		return "boundary_transgression_response"
	case ratio >= 0.80:
		return "precautionary_buffer_response"
	case record.AnnualPressureTrend > 0.01:
		return "trend_reversal_response"
	default:
		return "maintain_monitoring_and_resilience"
	}
}

func meanThresholdRisk(records []BoundaryRecord) float64 {
	if len(records) == 0 {
		return 0
	}

	total := 0.0
	for _, record := range records {
		total += thresholdRisk(record)
	}

	return total / float64(len(records))
}

func main() {
	if len(os.Args) < 2 {
		fmt.Println("usage: threshold-score boundary_profiles.csv")
		os.Exit(1)
	}

	file, err := os.Open(os.Args[1])
	if err != nil {
		fmt.Println("error opening file:", err)
		os.Exit(1)
	}
	defer file.Close()

	reader := csv.NewReader(file)
	rows, err := reader.ReadAll()
	if err != nil {
		fmt.Println("error reading CSV:", err)
		os.Exit(1)
	}

	records := make([]BoundaryRecord, 0)

	for i, row := range rows {
		if i == 0 {
			continue
		}

		record, err := parseRecord(row)
		if err != nil {
			fmt.Println("parse error:", err)
			continue
		}

		records = append(records, record)
	}

	meanRisk := meanThresholdRisk(records)

	for _, record := range records {
		record.MeanOtherThresholdRisk = meanRisk

		fmt.Printf(
			"boundary=%s pressure=%.3f margin=%.3f threshold=%.3f amplification=%.3f systemic_risk=%.3f zone=%s urgency=%s\n",
			record.Boundary,
			pressureRatio(record),
			uncertaintyMargin(record),
			thresholdRisk(record),
			crossBoundaryAmplification(record),
			systemicThresholdRisk(record),
			riskZone(record),
			responseUrgency(record),
		)
	}
}
The Go workflow shows how safe-operating-space diagnostics can move from article-level analysis into operational systems. A lightweight service could support environmental monitoring dashboards, internal risk registers, sensor pipelines, boundary-alert systems, or policy-support APIs. The key requirement is that assumptions remain visible. Pressure ratios, uncertainty margins, interaction weights, governance capacity, and urgency rules should be documented rather than hidden inside an opaque sustainability score.
A production version should add stronger input validation, structured logging, schema validation, versioned boundary definitions, audit trails, and support for uncertainty intervals. Safe-operating-space scoring should support better judgment, not replace judgment.
Engineering Extensions in the GitHub Repository
The accompanying GitHub repository extends the article workflow beyond Python, R, and Go into a broader engineering scaffold. The article body keeps Python and R visible because they are accessible tools for analytics, dashboard preparation, scenario testing, and reproducible reporting. Go provides a compact service layer. The repository, however, is structured for readers who want to translate safe-operating-space logic into more technical systems: auditable databases, threshold scoring engines, APIs, embedded monitoring, scenario simulation, edge anomaly detection, and accelerator-aware environmental data workflows.
The SQL scaffold is intended for boundary definitions, observed control variables, uncertainty bands, pressure ratios, risk zones, trend indicators, cross-boundary interactions, monitoring capacity, governance capacity, reversibility capacity, scenario runs, source provenance, and audit trails. Rust can support reliable threshold-risk scoring where type safety and reproducibility matter. Go can support lightweight diagnostic APIs. C and C++ can support embedded threshold alerts and high-performance scenario simulation. TinyML can support low-power anomaly detection at the edge, while PYNQ-oriented scaffolding can support accelerated preprocessing of environmental telemetry or dashboard inputs.
This engineering layer matters because safe operating space is fundamentally a measurement, uncertainty, and decision-support problem as well as a scientific concept. A serious technical architecture should make boundary assumptions visible, uncertainty explicit, data provenance auditable, and response logic reproducible.
A mature repository implementation should also include documentation for indicator choice, boundary definitions, uncertainty handling, missing data, scenario provenance, interaction weights, equity considerations, and review workflows. Without this layer, safe-operating-space analytics can become a dashboard aesthetic. With it, the technical system becomes a form of accountable environmental intelligence.
GitHub Repository
Complete Code Repository
The full code distribution for this article, including safe-operating-space diagnostics, threshold-risk modeling, uncertainty-margin analysis, cross-boundary amplification scoring, SQL materials, optional service tooling, and edge-side engineering scaffolds, is available on GitHub.
Common Misunderstandings
A common misunderstanding is that the safe operating space concept promises a simple and universal formula for sustainability. It does not. The framework is a heuristic architecture of risk, not a perfectly closed model of the future.
Another misunderstanding is that thresholds imply sudden total collapse. In many cases, the concern is not instant catastrophe but prolonged degradation, loss of resilience, and narrowing capacity for recovery. Thresholds matter because systems can reorganize into less desirable states, not because every threshold produces immediate apocalypse.
A third misunderstanding is that the framework is anti-development. In fact, its core concern is the opposite. It seeks to preserve the conditions under which societies can continue to develop without undermining their own ecological foundations. Safe operating space is therefore best understood as a way of linking sustainability to long-term viability, not as a call to abandon human aspiration.
A fourth misunderstanding is that uncertainty invalidates the framework. In reality, uncertainty is one of the reasons the concept exists. In threshold systems, imprecision about the exact location of danger is an argument for caution, not an argument for complacency. The framework does not claim perfect knowledge. It argues for prudent margins under imperfect knowledge.
A fifth misunderstanding is that safe operating space can be reduced to one global dashboard. Dashboards can help, but the concept is richer than visualization. It requires scientific judgment, ethical reasoning, governance capacity, data provenance, institutional accountability, and recognition of unequal exposure. A metric can support the concept, but it cannot replace the judgment the concept requires.
A final misunderstanding is that precaution means fear or paralysis. In the safe-operating-space framework, precaution is a form of practical responsibility. It is the decision to preserve room for adaptation, restoration, justice, and future choice before high-risk zones become harder to escape.
Related Articles
- What Are Planetary Boundaries?
- The Origins of the Planetary Boundaries Framework
- Climate Change as a Planetary Boundary
- Biosphere Integrity and the Stability of Life Systems
- Land-System Change and Ecological Transformation
- Freshwater Change and Earth System Risk
- Biogeochemical Flows: Nitrogen, Phosphorus, and Planetary Destabilization
- Ocean Acidification and the Chemistry of Planetary Change
- Stratospheric Ozone Depletion and Global Environmental Governance
- Atmospheric Aerosol Loading and Regional Planetary Risk
- Novel Entities and the Problem of Synthetic Overload
- Planetary Boundaries and Earth System Resilience
- Tipping Points, Feedback Loops, and Cascading Ecological Change
- How Planetary Boundaries Are Measured
- Uncertainty, Precaution, and Scientific Debate in Boundary Setting
- Sustainable Development Goals Within Planetary Boundaries
- Planetary Boundaries, Justice, and Global Inequality
- Earth System Governance in an Age of Limits
- Business Strategy Within Planetary Boundaries
- Finance, Disclosure, and Systemic Environmental Risk
- Critiques of the Planetary Boundaries Framework
- Planetary Boundaries and Doughnut Economics
- The Future of Planetary Stewardship
Further Reading
- Planetary Boundaries
- Risk & Resilience
- Systems Thinking
- Sustainable Development
- Environmental Science
- Earth Science
- Stewardship & Ethics
References
- Folke, C., Carpenter, S.R., Walker, B., Scheffer, M., Chapin, T. and Rockström, J. (2010) ‘Resilience thinking: Integrating resilience, adaptability and transformability’, Ecology and Society, 15(4), 20. Available at: https://www.ecologyandsociety.org/vol15/iss4/art20/.
- Lade, S.J. et al. (2020) ‘Human impacts on planetary boundaries amplified by Earth system interactions’, Nature Sustainability, 3, pp. 119–128. Available at: https://www.nature.com/articles/s41893-019-0454-4.
- Lenton, T.M. et al. (2008) ‘Tipping elements in the Earth’s climate system’, Proceedings of the National Academy of Sciences, 105(6), pp. 1786–1793. Available at: https://www.pnas.org/doi/10.1073/pnas.0705414105.
- Lenton, T.M., Rockström, J., Gaffney, O., Rahmstorf, S., Richardson, K., Steffen, W. and Schellnhuber, H.J. (2019) ‘Climate tipping points — too risky to bet against’, Nature, 575, pp. 592–595. Available at: https://www.nature.com/articles/d41586-019-03595-0.
- Kitzmann, N. et al. (2025) Planetary Health Check 2025: A Scientific Assessment of the State of the Planet. Potsdam: Potsdam Institute for Climate Impact Research. Available at: https://www.planetaryhealthcheck.org/.
- Richardson, K., Steffen, W., Lucht, W., Bendtsen, J., Cornell, S.E., Donges, J.F., Drüke, M., Fetzer, I., Bala, G., von Bloh, W., Feulner, G., Fiedler, S., Gerten, D., Gleeson, T., Hofmann, M., Huiskamp, W., Jakobsson, C., Jürgensen, J.H., Kummu, M., Mohan, C., Nogués-Bravo, D., Petri, S., Porkka, M., Rahmstorf, S., Schaphoff, S., Schulte-Uebbing, L., Staal, A., Sun, Z., Sakschewski, B. and Wang-Erlandsson, L. (2023) ‘Earth beyond six of nine planetary boundaries’, Science Advances, 9(37), eadh2458. Available at: https://www.science.org/doi/10.1126/sciadv.adh2458.
- Rockström, J., Steffen, W., Noone, K., Persson, Å., Chapin, F.S. III, Lambin, E.F., Lenton, T.M., Scheffer, M., Folke, C., Schellnhuber, H.J., Nykvist, B., de Wit, C.A., Hughes, T., van der Leeuw, S., Rodhe, H., Sörlin, S., Snyder, P.K., Costanza, R., Svedin, U., Falkenmark, M., Karlberg, L., Corell, R.W., Fabry, V.J., Hansen, J., Walker, B., Liverman, D., Richardson, K., Crutzen, P. and Foley, J.A. (2009a) ‘A safe operating space for humanity’, Nature, 461, pp. 472–475. Available at: https://www.nature.com/articles/461472a.
- Rockström, J., Steffen, W., Noone, K., Persson, Å., Chapin, F.S. III, Lambin, E.F., Lenton, T.M., Scheffer, M., Folke, C., Schellnhuber, H.J., Nykvist, B., de Wit, C.A., Hughes, T., van der Leeuw, S., Rodhe, H., Sörlin, S., Snyder, P.K., Costanza, R., Svedin, U., Falkenmark, M., Karlberg, L., Corell, R.W., Fabry, V.J., Hansen, J., Walker, B., Liverman, D., Richardson, K., Crutzen, P. and Foley, J.A. (2009b) ‘Planetary boundaries: Exploring the safe operating space for humanity’, Ecology and Society, 14(2), 32. Available at: https://www.ecologyandsociety.org/vol14/iss2/art32/.
- Rockström, J. et al. (2024) ‘Planetary boundaries guide humanity’s future on Earth’, Nature Reviews Earth & Environment, 5, pp. 773–788. Available at: https://www.nature.com/articles/s43017-024-00597-z.
- Steffen, W., Richardson, K., Rockström, J., Cornell, S.E., Fetzer, I., Bennett, E.M., Biggs, R., Carpenter, S.R., de Vries, W., de Wit, C.A., Folke, C., Gerten, D., Heinke, J., Mace, G.M., Persson, L.M., Ramanathan, V., Reyers, B. and Sörlin, S. (2015) ‘Planetary boundaries: Guiding human development on a changing planet’, Science, 347(6223), 1259855. Available at: https://www.science.org/doi/10.1126/science.1259855.
- Stockholm Resilience Centre (n.d.) Planetary boundaries. Available at: https://www.stockholmresilience.org/research/planetary-boundaries.html.