
Last Updated May 7, 2026
The planetary boundaries framework depends on measurement because it is not only a conceptual model of Earth-system risk. It is also an attempt to quantify how far human pressure has moved key Earth-system processes away from the conditions associated with long-term stability, resilience, and habitability. That task is difficult. The Earth system is complex, heterogeneous, dynamic, and interconnected. It cannot be captured through one universal metric. Instead, the framework relies on a set of control variables: scientifically chosen measurements that represent how much pressure is being placed on each boundary process and how close that process may be to zones of increasing or high risk.
Measurement gives the planetary boundaries framework practical force. Without measurement, the framework would remain a powerful metaphor for limits. With measurement, it becomes a diagnostic architecture: a way to compare observed Earth-system pressure with proposed boundary values, interpret uncertainty, identify risk zones, track change over time, and guide scientific, institutional, engineering, and governance response. Measurement does not remove uncertainty. It makes uncertainty visible enough to govern more responsibly.
Main Library
Publications
Article Map
Planetary Boundaries
Related Article
Safe Operating Space
Related Topic
Risk & Resilience
Related Topic
Environmental Science

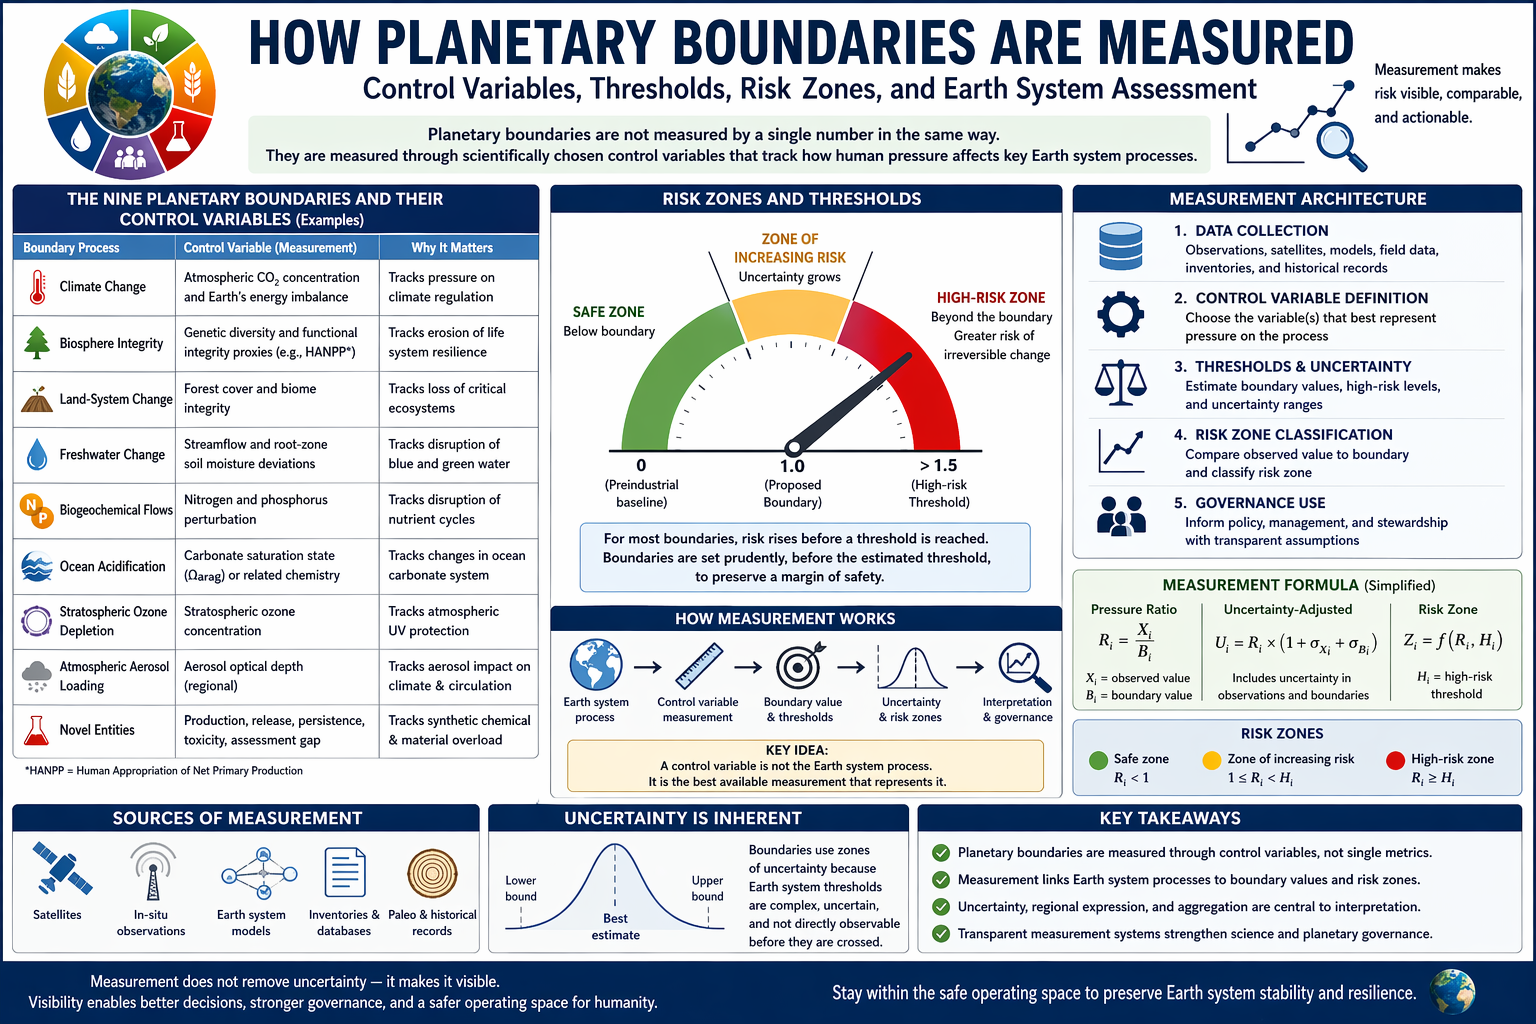
Planetary boundaries are not measured in the same way that a thermometer measures temperature or a scale measures weight. They are measured through a scientific architecture that links Earth-system processes, control variables, thresholds, uncertainty ranges, risk zones, and evolving evidence. Some boundaries are tracked through relatively familiar quantities such as atmospheric carbon dioxide concentration and Earth’s energy imbalance. Others require more composite or indirect measurements, such as streamflow and root-zone soil moisture for freshwater change, or proxies for functional biosphere integrity. Still others remain difficult to quantify with a single global metric, as in the case of atmospheric aerosol loading or novel entities.
Measuring planetary boundaries is therefore not a matter of finding one number for each problem. It is a matter of deciding what kind of measurement most meaningfully represents planetary risk. The framework becomes useful because it makes that decision explicit. It asks which variables best represent climate stability, biosphere integrity, freshwater change, land-system change, biogeochemical flows, ocean chemistry, ozone depletion, aerosol loading, and novel-entity pressure. It also asks how those variables should be interpreted when uncertainty is high, regional expression matters, and governance decisions cannot wait for perfect precision.
This article explains how planetary boundaries are measured by examining the logic of control variables, the difference between a boundary process and its measurement, the role of thresholds and zones of uncertainty, the challenge of aggregating regional and global dynamics, the reasons some boundaries are easier to quantify than others, and the implications of measurement choices for scientific interpretation and governance.
Why Measurement Matters
Measurement matters because the planetary boundaries framework seeks to do more than describe environmental deterioration in general terms. It seeks to identify where human pressure is pushing critical Earth-system processes relative to scientifically assessed ranges of safety and risk. Without measurement, the framework would remain a powerful conceptual model but not a usable diagnostic one. Measurement allows researchers to ask whether a boundary is still within a safe operating space, moving into increasing risk, or already transgressed. It also makes comparison possible across time, across boundary processes, and across revised versions of the framework.
This does not mean the framework turns the Earth system into a simple dashboard of exact numbers. The point is not mechanical precision. The point is disciplined approximation under conditions of complexity. Measurement in the planetary boundaries framework is best understood as an effort to make Earth-system risk legible without pretending that all uncertainty has disappeared. The measured values are meaningful because they are tied to resilience, thresholds, and Earth-system functioning, not because they offer perfect prediction.
Measurement also matters because it changes the public status of environmental risk. A vague concern is easy to dismiss, postpone, or reframe as a matter of opinion. A measured boundary, by contrast, can be debated, revised, monitored, compared, and incorporated into scientific assessment, policy design, corporate strategy, finance, infrastructure planning, and public accountability. Measurement gives boundary thinking practical force.
At the same time, measurement can mislead if it is treated too simplistically. A control variable is not the whole process. A boundary value is not a magic cliff edge. A single global number may hide regional variation. A quantified boundary may still contain uncertainty. A measurement system can reveal risk, but it can also create false confidence if users forget the assumptions behind it. The strongest use of planetary-boundary measurement is therefore precise and humble at the same time.
Measurement also shapes institutional priorities. What is measured becomes visible. What is visible becomes governable. What is governable can be regulated, financed, monitored, litigated, disclosed, or repaired. This gives measurement ethical and political significance. The choice of control variables is not only a technical choice; it helps determine which risks enter public decision-making and which risks remain hidden.
What a Control Variable Is
A control variable is the primary measurement used to track the state of a planetary-boundary process. It is the quantity that scientists judge to be most useful for representing human pressure on that process and for assessing where the process stands relative to the proposed boundary. Stockholm Resilience Centre’s quantitative-evolution table presents the framework in precisely these terms, listing the Earth-system process, the control variable, the threshold avoided or influenced by the slow variable, and the location of the proposed boundary and zone of uncertainty.
The choice of a control variable is crucial because it shapes how the boundary is interpreted. A good control variable is not simply easy to measure. It must be scientifically meaningful. It should capture the key dynamics of the process closely enough that changes in the variable tell us something important about the stability and resilience of the Earth-system process in question. In some cases that is relatively straightforward, as with atmospheric carbon dioxide concentration and energy imbalance for climate change. In other cases, the process is too complex to be represented by one clean global measure, which is why some boundaries use multiple control variables or remain more weakly quantified.
Control variables are therefore not interchangeable indicators. They are measurement choices embedded in Earth-system theory. Atmospheric carbon dioxide is not merely an emissions statistic; it is a state variable connected to radiative forcing, ocean chemistry, carbon sinks, ice-sheet stability, and climate feedbacks. Root-zone soil moisture is not merely a local agricultural indicator; it represents green-water change that affects vegetation, evapotranspiration, climate feedbacks, food systems, and terrestrial resilience. Human appropriation of net primary production is not merely an ecological accounting tool; it can serve as a proxy for how much biological productivity is being redirected away from ecosystem functioning.
The control-variable concept is especially useful for engineers, analysts, and data teams because it clarifies the data-modeling problem. A boundary-monitoring system does not begin by collecting every possible environmental variable. It begins by asking which variables have the strongest scientific relationship to the process being governed, which variables are observable at the relevant scale, and which variables can support risk interpretation over time.
A control variable also needs documentation. A serious measurement system should specify the variable definition, unit, data source, spatial scale, temporal frequency, baseline period, uncertainty range, boundary value, high-risk value, version history, and review status. Without these details, a boundary score may appear authoritative while hiding the interpretive work behind it.
In this sense, control variables are not merely data points. They are the bridge between Earth-system science and operational governance.
Boundary Processes and Measurement Are Not the Same
One of the most important distinctions in the framework is the difference between the boundary process itself and the variable used to measure it. Climate change, for example, is the process. Atmospheric carbon dioxide concentration and Earth’s surface energy imbalance are control variables used to represent that process. Biosphere integrity is the process. Genetic diversity loss and functional indicators related to human appropriation of net primary production are among the variables used to capture it. Freshwater change is the process. Streamflow and root-zone soil moisture deviations from preindustrial conditions are measurements used to track it.
This distinction matters because no variable perfectly contains the complexity of the process it represents. Measurement is always a scientific simplification. The integrity of the framework depends on making that simplification explicit and defensible. A boundary is therefore not identical to its metric. It is a judgment about an Earth-system process informed by the best available variable or set of variables. That is why the framework evolves. As knowledge improves, the measurement strategy can change even when the underlying process being tracked remains the same.
This point is central to avoiding shallow criticism. It is easy to say that a control variable is incomplete. It usually is. The more serious question is whether it is the best available representation of the process, whether its limitations are transparent, and whether it is strong enough to support precautionary interpretation. In complex systems, measurement is rarely perfect. The goal is not perfection. The goal is scientifically defensible representation.
The distinction also matters for governance. If policymakers confuse the process with the metric, they may optimize the number while neglecting the underlying system. A country, firm, or institution might reduce one measured pressure while shifting risk to an unmeasured pathway. Measurement should therefore remain connected to process understanding. The metric is a window into Earth-system risk, not the risk itself.
This is especially important when planetary-boundary language moves into corporate reporting, finance, or policy dashboards. A dashboard can show whether a control variable has improved, but it cannot by itself prove that the underlying Earth-system process has recovered. Measurement must remain tied to ecological function, feedbacks, spatial distribution, justice, and long-term resilience.
A strong measurement architecture therefore keeps three layers distinct: the Earth-system process, the control variable, and the governance interpretation. Confusing these layers weakens both science and policy.
How Thresholds and Risk Zones Are Estimated
The framework does not usually present a single sharp cut-off between safety and catastrophe. Instead, it uses boundary values together with zones of uncertainty and increasing risk. In the 2015 formulation, several boundaries were explicitly framed as having a safe zone, a zone of increasing risk, and an outer zone of high risk. This structure reflects the fact that Earth-system thresholds are often uncertain, probabilistic, or only partially observable in advance. The boundary is therefore placed conservatively, before the estimated threshold, to preserve a margin of safety.
This makes the framework precautionary by design. Scientists do not wait until an irreversible threshold is observed directly. They choose a boundary that reduces the risk of reaching it. Measurement thus becomes inseparable from judgment about resilience and uncertainty. The framework does not claim perfect foresight. It claims that enough is known about Earth-system behavior to justify scientifically grounded guardrails before destabilization becomes obvious.
Threshold estimation uses multiple kinds of evidence. Some evidence comes from long-term observations. Some comes from paleoclimate and paleoecological records. Some comes from mechanistic understanding of Earth-system processes. Some comes from models. Some comes from regional studies that reveal how local or continental-scale disruptions can aggregate into planetary significance. No single evidence stream is sufficient for all boundaries. That is why different boundaries carry different degrees of confidence and different measurement architectures.
Risk zones are especially important because they prevent a misleading yes-or-no interpretation. The safest interpretation is not “nothing matters until the boundary is crossed.” Risk often rises before a threshold is reached, and uncertainty may widen the range within which rising risk should be taken seriously. In this sense, a boundary is less like a wall and more like a scientifically informed warning line before a zone of increasing danger.
A mature measurement system should therefore store not only a boundary value but also the reasoning behind it: the evidence used, the uncertainty band, the high-risk threshold, the baseline, the revision date, and the confidence level. This is how a measurement architecture becomes auditable rather than merely visual.
| Measurement concept | Meaning | Why it matters |
|---|---|---|
| Control variable | The indicator used to represent pressure on an Earth-system process. | Determines what is actually being tracked. |
| Boundary value | The proposed limit or reference value associated with safer operating space. | Defines the threshold used for risk interpretation. |
| Zone of uncertainty | The range in which scientific uncertainty and rising risk are especially important. | Prevents false precision and supports precaution. |
| High-risk value | A level beyond which destabilizing change becomes more likely or more severe. | Supports urgency classification and response prioritization. |
| Monitoring capacity | The ability to observe, update, and validate the measurement over time. | Determines whether governance can detect worsening conditions early enough. |
Why Some Boundaries Are Easier to Measure Than Others
Some boundaries are easier to measure because the underlying process is globally integrated, well studied, and associated with relatively clear control variables. Climate change is the clearest example: atmospheric carbon dioxide concentration and radiative forcing or energy imbalance are globally meaningful, repeatedly observed, and directly relevant to Earth-system functioning. Stratospheric ozone depletion is also comparatively measurable because ozone concentration and ozone-depleting substances can be monitored at planetary scale through well-established atmospheric science.
Other boundaries are more difficult because the process is heterogeneous, regionally variable, or governed by multiple interacting pathways. Atmospheric aerosol loading is a classic case: aerosols vary strongly by type, altitude, region, and atmospheric behavior, making a single global boundary hard to define. Novel entities are difficult for a different reason: the challenge lies not in one pollutant but in the proliferating scale and diversity of synthetic substances whose cumulative effects outpace assessment capacity. In such cases, measurement becomes more composite, more provisional, or more explicitly constrained by the current state of knowledge.
Biosphere integrity is difficult because biodiversity and ecosystem functioning are not one-dimensional. Species loss, genetic diversity, functional diversity, habitat fragmentation, trophic structure, ecological redundancy, productivity, and ecosystem resilience all matter. Freshwater change is difficult because water is not only a global volume problem. It involves seasonal flows, groundwater, soil moisture, basin-level withdrawals, ecological flow requirements, precipitation patterns, and land-atmosphere feedbacks. Land-system change is difficult because not all land conversion has the same ecological meaning. Losing tropical forest, boreal forest, wetlands, grasslands, or dryland vegetation can have different consequences for carbon, hydrology, biodiversity, and regional climate.
The harder-to-measure boundaries are not less important. In some cases, they may be more dangerous precisely because measurement and governance lag behind the scale of the problem. Novel entities illustrate this clearly. The difficulty of measuring synthetic chemical and material overload does not mean the risk is small. It means the speed of innovation and release has outpaced society’s ability to assess cumulative effects.
Measurement difficulty should therefore be interpreted as a warning signal, not a reassurance. A risk that is hard to measure may require stronger precaution, better monitoring, more conservative release rules, and more robust governance precisely because the system cannot yet be observed with confidence.
How the Nine Boundaries Are Measured
The framework uses different control variables for different processes. For climate change, the 2015 framework lists atmospheric carbon dioxide concentration and Earth’s surface energy imbalance. For biosphere integrity, the framework uses one variable for genetic diversity and another for functional integrity, with later updates emphasizing measures such as human appropriation of net primary production as a control variable for functional biosphere integrity. Land-system change has been measured in relation to forest cover and biome integrity rather than simply total land conversion. Freshwater change is measured using deviations in streamflow and root-zone soil moisture from preindustrial patterns, capturing both blue water and green water.
Biogeochemical flows are tracked through variables tied to human perturbation of nitrogen and phosphorus cycles. Ocean acidification is measured through carbonate chemistry, especially carbonate saturation states that matter to marine calcifiers. Stratospheric ozone depletion is measured through ozone concentration in the stratosphere. Atmospheric aerosol loading remains harder to represent, and the 2015 framework treated it as a regionally expressed process without one universally accepted global control variable. Novel entities likewise resist one simple global measurement and are instead approached through evidence about production, release, persistence, mobility, toxicity, and the mismatch between innovation and assessment capacity.
| Boundary process | Measurement logic | Why measurement is difficult |
|---|---|---|
| Climate change | Atmospheric CO₂ concentration and Earth’s energy imbalance represent pressure on climate regulation. | Feedbacks, tipping dynamics, carbon-cycle uncertainty, and regional impacts complicate interpretation. |
| Biosphere integrity | Genetic diversity and functional integrity indicators represent erosion of life-system resilience. | Biodiversity is multidimensional, spatially uneven, and difficult to summarize globally. |
| Land-system change | Forest cover, biome integrity, and land-cover transformation represent pressure on climate, hydrology, and ecosystems. | Different land conversions have different impacts depending on biome, region, and ecological function. |
| Freshwater change | Streamflow and root-zone soil moisture deviations represent blue-water and green-water disruption. | Hydrological risk is highly regional but can aggregate into Earth-system significance. |
| Biogeochemical flows | Nitrogen and phosphorus perturbations represent human disruption of nutrient cycles. | Impacts depend on agricultural systems, watersheds, soils, rivers, lakes, and coasts. |
| Ocean acidification | Carbonate chemistry and saturation states represent risks to marine calcifiers and ocean systems. | Regional variability and biological sensitivity complicate risk interpretation. |
| Stratospheric ozone depletion | Stratospheric ozone concentration represents atmospheric protection from ultraviolet radiation. | It is comparatively measurable, but recovery depends on long atmospheric time lags. |
| Atmospheric aerosol loading | Regional aerosol optical depth and related measures represent aerosol effects on climate and circulation. | Aerosols differ by type, region, altitude, lifetime, and climate effect. |
| Novel entities | Production, release, persistence, toxicity, mobility, and assessment capacity represent synthetic overload. | The diversity and speed of chemical and material release outpace global assessment systems. |
This table should not be read as a final measurement catalogue. It is a simplified explanation of measurement logic. The exact control variables, boundary values, and risk zones have evolved across the 2009, 2015, 2023, and 2025 formulations, and further refinement is likely. The central point is that each boundary requires a measurement strategy suited to the Earth-system process being tracked.
The table also shows why the planetary boundaries framework is not a single-index model. The nine boundary processes differ in physical structure, spatial expression, observational maturity, reversibility, uncertainty, and governance tractability. A credible measurement system must preserve those differences rather than flattening them into a false equivalence.
Data Sources, Models, and Observation Systems
Planetary-boundary measurement draws on many kinds of data and scientific infrastructure. Atmospheric measurements, satellite observations, land-cover datasets, hydrological models, biogeochemical accounts, biodiversity indicators, chemical inventories, ocean chemistry observations, historical reconstructions, and Earth-system models all contribute. Some measurements are direct observations. Others are modeled estimates. Some are global. Others begin regionally and are aggregated or interpreted in relation to planetary function.
This mixed architecture is necessary because no single observation system can measure the Earth system adequately. Climate change can be monitored through atmospheric observations, ocean heat, radiative imbalance, ice dynamics, and model projections. Freshwater change requires streamflow records, soil moisture estimates, land-surface models, and baseline comparison. Biosphere integrity requires species data, habitat information, productivity estimates, land-use data, and functional interpretation. Novel entities require production data, release estimates, persistence and toxicity information, and assessment-capacity indicators.
Models are especially important because some risks cannot be observed directly before they become dangerous. A threshold may be inferred from process understanding, simulation, paleorecords, or regional evidence. This does not make the measurement arbitrary. It means the measurement system integrates observation and theory. The strongest boundary measurements are those that make this integration transparent: what is directly observed, what is modeled, what is inferred, what uncertainty remains, and how the boundary value is justified.
For engineers and data teams, this points toward a layered architecture. Raw data, processed indicators, control-variable definitions, thresholds, uncertainty estimates, baseline periods, model versions, and provenance records should be kept distinct. A planetary-boundary dashboard that simply displays a final score without showing its measurement pipeline risks becoming a black box. Measurement quality depends not only on the final number, but on the traceability of the system that produced it.
A robust architecture should therefore include versioned schemas, metadata standards, reproducible transformation scripts, documented boundary definitions, uncertainty fields, review workflows, and audit trails. In a planetary-boundary context, data engineering is not merely technical support. It is part of the scientific credibility and public legitimacy of the measurement system.
Measurement, Uncertainty, and Revision
Measurement in the planetary boundaries framework is not static. It evolves as science improves. One of the clearest examples is freshwater: the original emphasis on consumptive freshwater use was later revised into the broader boundary of freshwater change, with blue-water and green-water dynamics both incorporated. Biosphere integrity also changed from a narrower focus on biodiversity loss toward a two-dimensional approach that distinguishes genetic diversity from functional integrity. The 2023 update expanded the quantification of all nine boundaries together more systematically than earlier work, while the 2024 review and 2025 scenario work continued refining how control variables are interpreted and projected.
This revisability is a strength rather than a weakness. The framework is not a fixed creed. It is a living measurement architecture. Its legitimacy depends partly on being able to adapt when better variables, better models, or better Earth-system understanding becomes available. A boundary that cannot be remeasured or refined would not be scientifically serious. The framework’s evolution shows that the purpose of measurement is not to freeze the science, but to improve the fidelity with which Earth-system risk is tracked.
Uncertainty enters measurement at multiple levels. There may be uncertainty in the data itself. There may be uncertainty in baseline selection. There may be uncertainty in how a regional signal should be aggregated. There may be uncertainty in the threshold estimate. There may be uncertainty in how control variables interact across boundaries. There may also be uncertainty in the social and governance translation of a global boundary into national, regional, sectoral, or corporate decision rules.
A responsible measurement system should therefore expose uncertainty rather than bury it. This means documenting confidence ranges, assumptions, sensitivity tests, model versions, and alternative interpretations. In planetary-boundary measurement, uncertainty is not a reason to abandon measurement. It is a reason to make measurement more transparent, more adaptive, and more precautionary.
Revision also protects the framework from becoming merely symbolic. If freshwater, biosphere integrity, novel entities, aerosol loading, and other boundaries require better variables over time, then the measurement system must be able to change without losing continuity. That requires version control, historical comparison, clear documentation of methodological changes, and honest communication about what changed and why.
Scientific maturity is not the absence of revision. Scientific maturity is the ability to revise transparently.
Regional Expression and Global Aggregation
Another major challenge in measurement is the relationship between regional dynamics and planetary interpretation. Not every boundary is best understood through a single global average. Aerosol loading is a strong example, since the effects are intensely regional but still large enough to influence monsoons, cryosphere change, and planetary risk. Freshwater change also depends on distributed hydrological disruptions that must be aggregated carefully to say something meaningful about Earth-system stability. Even biosphere integrity and land-system change require combining local or regional ecological changes into metrics with planetary relevance.
This means planetary measurement is never just about scale-up. It is about deciding whether and how regional phenomena can be interpreted as part of Earth-system change. The framework becomes strongest when it recognizes that some processes are globally mixed, some are globally cumulative, and some are regionally expressed yet globally consequential. Measurement has to reflect those structural differences rather than flatten them.
Climate change is globally mixed in a way that makes atmospheric concentration especially meaningful. Nutrient pollution is regionally expressed but globally pervasive through agricultural transformation and aquatic ecosystem disruption. Freshwater change is distributed across watersheds and land surfaces, but aggregate hydrological change can affect vegetation, climate feedbacks, and resilience. Aerosol loading is regionally concentrated but can alter regional climate systems with planetary significance. Novel entities are dispersed through production systems, trade, waste streams, bodies, ecosystems, and long-lived materials.
Aggregation is therefore a scientific and governance problem. A global average may understate local ecological crisis. A local crisis may not automatically indicate planetary destabilization. A meaningful measurement system must identify when regional changes accumulate, interact, or cascade into Earth-system risk. That requires spatial data, regional interpretation, and careful scaling logic.
This also means that planetary-boundary measurement must avoid both global abstraction and local fragmentation. If measurement stays only global, it can hide where harm is concentrated. If it stays only local, it can miss cumulative planetary significance. The task is to connect scales without erasing the meaning of either.
Why Measurement Shapes Governance
How planetary boundaries are measured has direct consequences for governance because measurement determines what becomes visible, actionable, and comparable. A process that can be represented through clear control variables is easier to monitor, communicate, and incorporate into policy. The ozone boundary benefited from this. Climate change has likewise gained political traction partly because atmospheric measurements are intelligible, repeatable, and globally comparable. More difficult-to-measure boundaries, such as aerosol loading or novel entities, are often harder to govern precisely because the measurement architecture is more complex or incomplete.
This does not mean the hard-to-measure boundaries are less important. It means measurement itself is part of the politics of planetary governance. The easier a process is to represent through trusted variables, the easier it is to frame as a governance problem. The planetary boundaries framework therefore does more than assess the Earth system. It helps construct the measurable reality within which planetary governance becomes thinkable.
Measurement also affects responsibility. If emissions are measured well, climate accountability becomes more feasible. If land conversion is spatially traceable, supply-chain governance becomes stronger. If nutrient flows can be linked to agricultural systems and watersheds, policy can target sources more effectively. If novel entities remain poorly inventoried and weakly assessed, regulation struggles to keep pace. Measurement does not solve governance, but it shapes what governance can see.
This is why boundary measurement should be treated as public infrastructure. It needs transparency, independence, scientific credibility, open documentation, version control, and interpretation that is careful enough to avoid both false certainty and false skepticism. The measurement system is part of the planetary governance system.
Measurement also creates accountability only when paired with power. Data without enforcement can become ritual. Dashboards without responsibility can become performance. Disclosure without change can normalize harm. Planetary-boundary measurement should therefore support action: regulation, restoration, investment, transition planning, liability, public accountability, and protection for communities facing disproportionate exposure.
The purpose of measurement is not simply to know where the boundary is. It is to help societies act before the boundary is crossed, and to respond more urgently where transgression has already occurred.
Justice and Measurement
Planetary-boundary measurement is often presented as a technical exercise, but it also has a justice dimension. What gets measured, how it is measured, where data is collected, whose exposure is visible, and whose responsibility is traceable all shape the politics of sustainability. A global control variable may reveal planetary pressure while hiding unequal responsibility and unequal harm. A national average may hide sacrifice zones. A corporate disclosure may show emissions intensity while obscuring land rights, water impacts, labor conditions, or toxic burdens in distant supply chains.
This does not mean planetary-boundary measurement should be abandoned. It means measurement should be layered. Global control variables should be connected to regional exposure, historical responsibility, sectoral pressure, community vulnerability, and distributional burden. If the framework measures ecological ceilings without measuring social foundations and unequal exposure, it risks becoming incomplete. If it includes justice-relevant data, it becomes a stronger tool for accountable governance.
Justice also matters because measurement capacity itself is uneven. Wealthy countries and institutions often have stronger monitoring systems, satellite access, research capacity, inventories, and reporting infrastructure. Lower-income countries and marginalized communities may face severe exposure while lacking the resources to document harm in globally recognized formats. A just measurement system should therefore support capacity-building, open data, community monitoring, Indigenous knowledge, and transparent methods rather than concentrating epistemic authority in already powerful institutions.
Measurement should not become a new form of exclusion. It should make hidden harm harder to ignore. It should help connect planetary pressure to the people, places, and systems most affected by it.
In this sense, measurement is not only a scientific act. It is also a public act: a decision about what the world is allowed to see.
Why This Matters for Planetary Boundaries
Measurement matters for planetary boundaries because the framework depends on the translation of Earth-system processes into interpretable control variables. Without this translation, the framework could identify broad dangers but could not assess boundary status, track worsening pressure, compare revisions, support dashboards, or guide action. Measurement is what allows planetary-boundary science to become a practical diagnostic system.
It also matters because measurement reveals the framework’s humility. Planetary boundaries are not simple numbers handed down outside history. They are scientific judgments built from observations, models, uncertainty, thresholds, baselines, proxies, and evolving evidence. Understanding measurement helps prevent both false certainty and lazy skepticism. The framework is neither perfectly precise nor arbitrary. It is an evolving effort to represent complex Earth-system risk as responsibly as possible.
Measurement also matters because it shapes governance. Strong measurement can make risk visible, responsibility traceable, and response more timely. Weak measurement can hide accumulating danger, especially for novel entities, aerosols, biodiversity, and regionally distributed water risks. A planetary-boundary framework that takes measurement seriously must therefore take data infrastructure, uncertainty, provenance, justice, and institutional response seriously as well.
To understand how planetary boundaries are measured is to understand why the framework is both scientific and interpretive. It measures not only environmental harm, but pressure on the processes that regulate the stability and resilience of the Earth system. The better those processes can be represented, the more clearly societies can see where risk is rising and where safe operating space is narrowing.
Measurement will not remove politics from planetary stewardship. But it can make the stakes clearer, the assumptions more explicit, and the risks harder to ignore.
Mathematical Lens: Control Variables, Boundaries, and Risk Ratios
Planetary-boundary measurement can be represented as a relationship among observed control-variable values, boundary values, uncertainty, and risk-zone classification. Let \(X_i\) represent the observed value of control variable \(i\), and let \(B_i\) represent the proposed boundary value for that control variable. A simple pressure ratio can be written as:
R_i = \frac{X_i}{B_i}
\]
Interpretation: The pressure ratio compares the observed control-variable value with the proposed boundary value.
If \(R_i < 1\), the observed value remains below the proposed boundary. If \(R_i \geq 1\), the boundary has been reached or exceeded. This expression is simple, but it already illustrates the logic of boundary measurement: an observed control variable is interpreted relative to a boundary value, not in isolation.
Because boundary values and observations both carry uncertainty, a stronger formulation includes uncertainty explicitly. Let \(\sigma_{X_i}\) represent uncertainty in the observed control variable and \(\sigma_{B_i}\) represent uncertainty in the boundary estimate. An uncertainty-adjusted pressure score can be expressed as:
U_i = R_i \times (1 + \sigma_{X_i} + \sigma_{B_i})
\]
Interpretation: The uncertainty-adjusted score makes observation uncertainty and boundary uncertainty visible in the measurement architecture.
This does not produce a definitive risk value. It makes clear that uncertainty should be visible in the measurement architecture. A process with a moderate pressure ratio but high uncertainty may require closer monitoring and precaution than the raw ratio alone suggests.
Risk-zone classification can be written as a function:
Z_i =
\begin{cases}
\text{safe zone}, & R_i < 1 \\
\text{zone of increasing risk}, & 1 \leq R_i < H_i \\
\text{high-risk zone}, & R_i \geq H_i
\end{cases}
\]
Interpretation: Risk-zone classification separates safer conditions, increasing risk, and high-risk transgression using a boundary-specific high-risk threshold \(H_i\).
A governance-adjusted diagnostic can include monitoring capacity \(C_i\), scaled from 0 to 1:
G_i = U_i \times (1 – C_i)
\]
Interpretation: Governance-adjusted measurement risk rises when uncertainty-adjusted pressure is high and monitoring capacity is weak.
| Term | Meaning | Interpretive role |
|---|---|---|
| \(X_i\) | Observed control-variable value | Represents measured or modeled pressure on boundary process \(i\). |
| \(B_i\) | Boundary value | Represents the proposed boundary reference for the control variable. |
| \(R_i\) | Pressure ratio | Shows how close the observed value is to the boundary. |
| \(\sigma_{X_i}\) | Observation uncertainty | Represents uncertainty in the measured or modeled value. |
| \(\sigma_{B_i}\) | Boundary uncertainty | Represents uncertainty in the proposed boundary value. |
| \(U_i\) | Uncertainty-adjusted pressure | Combines pressure ratio with uncertainty exposure. |
| \(H_i\) | High-risk threshold | Represents a boundary-specific value associated with more severe risk. |
| \(Z_i\) | Risk zone | Classifies the boundary as safe, increasing risk, or high risk. |
| \(C_i\) | Monitoring capacity | Represents the strength of observation, validation, and reporting systems. |
| \(G_i\) | Governance-adjusted measurement risk | Shows how weak monitoring can intensify practical risk. |
This mathematical framing is not a substitute for Earth-system science. It is a transparent way to express the logic of planetary-boundary measurement: control variables are interpreted relative to boundary values, uncertainty matters, risk zones matter, and monitoring capacity affects whether societies can respond in time.
Advanced Python Workflow: Control-Variable and Risk-Zone Scoring
The following Python workflow models planetary-boundary measurement as a data pipeline. It separates the boundary process, control variable, observed value, boundary value, high-risk value, observation uncertainty, boundary uncertainty, monitoring capacity, risk ratio, risk-zone classification, measurement priority, and uncertainty sensitivity. The values are illustrative, but the structure can be adapted for real boundary datasets, scenario analysis, dashboards, or reproducible reporting.
"""
Planetary-boundary measurement workflow.

This workflow models how planetary boundaries are measured through:
- boundary processes
- control variables
- observed values
- proposed boundary values
- high-risk values
- observation uncertainty
- boundary uncertainty
- monitoring capacity
- pressure ratios
- risk-zone classification
- uncertainty sensitivity

The values are illustrative. Replace them with documented control
variables, observed values, uncertainty estimates, boundary values,
source provenance, and review notes before applied use.
"""

from __future__ import annotations

from dataclasses import dataclass
from pathlib import Path
from typing import Literal

import numpy as np
import pandas as pd


RiskZone = Literal["safe_zone", "zone_of_increasing_risk", "high_risk_zone"]


@dataclass(frozen=True)
class BoundaryMeasurement:
    """Measurement specification for one planetary-boundary control variable."""

    boundary_process: str
    control_variable: str
    observed_value: float
    boundary_value: float
    high_risk_value: float
    observation_uncertainty: float
    boundary_uncertainty: float
    monitoring_capacity: float
    unit: str
    evidence_note: str


def build_sample_measurements() -> pd.DataFrame:
    """
    Create illustrative boundary-measurement data.

    The values are scaled indexes for demonstration except where a unit is noted.
    They are not official boundary values.
    """
    measurements = [
        BoundaryMeasurement(
            boundary_process="climate_change",
            control_variable="atmospheric_co2_and_energy_imbalance_proxy",
            observed_value=1.42,
            boundary_value=1.00,
            high_risk_value=1.50,
            observation_uncertainty=0.05,
            boundary_uncertainty=0.10,
            monitoring_capacity=0.85,
            unit="scaled index",
            evidence_note="high observational maturity but feedback uncertainty remains",
        ),
        BoundaryMeasurement(
            boundary_process="biosphere_integrity",
            control_variable="functional_integrity_proxy",
            observed_value=1.70,
            boundary_value=1.00,
            high_risk_value=1.50,
            observation_uncertainty=0.15,
            boundary_uncertainty=0.22,
            monitoring_capacity=0.55,
            unit="scaled index",
            evidence_note="multidimensional ecological process requiring proxies",
        ),
        BoundaryMeasurement(
            boundary_process="freshwater_change",
            control_variable="streamflow_and_root_zone_soil_moisture_proxy",
            observed_value=1.28,
            boundary_value=1.00,
            high_risk_value=1.50,
            observation_uncertainty=0.12,
            boundary_uncertainty=0.18,
            monitoring_capacity=0.62,
            unit="scaled index",
            evidence_note="regional hydrological deviations aggregated to planetary relevance",
        ),
        BoundaryMeasurement(
            boundary_process="land_system_change",
            control_variable="forest_cover_and_biome_integrity_proxy",
            observed_value=1.24,
            boundary_value=1.00,
            high_risk_value=1.50,
            observation_uncertainty=0.10,
            boundary_uncertainty=0.16,
            monitoring_capacity=0.66,
            unit="scaled index",
            evidence_note="land conversion differs by biome and ecological function",
        ),
        BoundaryMeasurement(
            boundary_process="biogeochemical_flows",
            control_variable="nitrogen_and_phosphorus_perturbation_proxy",
            observed_value=1.85,
            boundary_value=1.00,
            high_risk_value=1.50,
            observation_uncertainty=0.10,
            boundary_uncertainty=0.14,
            monitoring_capacity=0.58,
            unit="scaled index",
            evidence_note="nutrient disruption linked to agriculture, watersheds, and coasts",
        ),
        BoundaryMeasurement(
            boundary_process="ocean_acidification",
            control_variable="carbonate_saturation_proxy",
            observed_value=1.08,
            boundary_value=1.00,
            high_risk_value=1.50,
            observation_uncertainty=0.08,
            boundary_uncertainty=0.12,
            monitoring_capacity=0.70,
            unit="scaled index",
            evidence_note="ocean chemistry is measurable but biological response varies",
        ),
        BoundaryMeasurement(
            boundary_process="novel_entities",
            control_variable="production_release_and_assessment_gap_proxy",
            observed_value=1.65,
            boundary_value=1.00,
            high_risk_value=1.50,
            observation_uncertainty=0.25,
            boundary_uncertainty=0.30,
            monitoring_capacity=0.38,
            unit="scaled index",
            evidence_note="rapid chemical and material proliferation outpaces assessment",
        ),
        BoundaryMeasurement(
            boundary_process="atmospheric_aerosol_loading",
            control_variable="regional_aerosol_optical_depth_proxy",
            observed_value=0.95,
            boundary_value=1.00,
            high_risk_value=1.50,
            observation_uncertainty=0.22,
            boundary_uncertainty=0.28,
            monitoring_capacity=0.48,
            unit="scaled index",
            evidence_note="strong regional variation complicates global boundary setting",
        ),
        BoundaryMeasurement(
            boundary_process="stratospheric_ozone_depletion",
            control_variable="stratospheric_ozone_concentration_proxy",
            observed_value=0.72,
            boundary_value=1.00,
            high_risk_value=1.50,
            observation_uncertainty=0.05,
            boundary_uncertainty=0.08,
            monitoring_capacity=0.82,
            unit="scaled index",
            evidence_note="comparatively mature measurement system with long recovery lag",
        ),
    ]

    return pd.DataFrame([measurement.__dict__ for measurement in measurements])


def classify_risk_zone(ratio: float, high_risk_ratio: float) -> RiskZone:
    """Classify a control variable into a risk zone."""
    if ratio < 1.0:
        return "safe_zone"
    if ratio < high_risk_ratio: return "zone_of_increasing_risk" return "high_risk_zone" def score_measurements(data: pd.DataFrame) -> pd.DataFrame:
    """Calculate pressure ratios, uncertainty-adjusted scores, and risk zones."""
    scored = data.copy()

    for column in ["boundary_value", "high_risk_value"]:
        if (scored[column] <= 0).any(): raise ValueError(f"{column} must contain only positive values.") scored["pressure_ratio"] = scored["observed_value"] / scored["boundary_value"] scored["high_risk_ratio"] = scored["high_risk_value"] / scored["boundary_value"] scored["combined_uncertainty"] = ( scored["observation_uncertainty"] + scored["boundary_uncertainty"] ) scored["uncertainty_adjusted_pressure"] = ( scored["pressure_ratio"] * (1 + scored["combined_uncertainty"]) ) scored["monitoring_gap"] = 1 - scored["monitoring_capacity"] scored["measurement_risk_score"] = ( scored["uncertainty_adjusted_pressure"] * (1 + scored["monitoring_gap"]) ) scored["risk_zone"] = scored.apply( lambda row: classify_risk_zone( ratio=float(row["pressure_ratio"]), high_risk_ratio=float(row["high_risk_ratio"]), ), axis=1, ) scored["measurement_priority"] = np.select( [ scored["risk_zone"] == "high_risk_zone", scored["combined_uncertainty"] >= 0.45,
            scored["monitoring_gap"] >= 0.50,
            scored["risk_zone"] == "zone_of_increasing_risk",
        ],
        [
            "high_pressure_priority",
            "uncertainty_priority",
            "monitoring_priority",
            "risk_zone_tracking_priority",
        ],
        default="standard_tracking",
    )

    return scored.sort_values("measurement_risk_score", ascending=False)


def summarize_by_zone(scored: pd.DataFrame) -> pd.DataFrame:
    """Summarize measurement status by risk zone."""
    return (
        scored.groupby("risk_zone")
        .agg(
            boundaries=("boundary_process", "count"),
            mean_pressure_ratio=("pressure_ratio", "mean"),
            mean_combined_uncertainty=("combined_uncertainty", "mean"),
            mean_monitoring_capacity=("monitoring_capacity", "mean"),
            mean_measurement_risk_score=("measurement_risk_score", "mean"),
        )
        .reset_index()
        .sort_values("mean_measurement_risk_score", ascending=False)
    )


def run_uncertainty_sensitivity(scored: pd.DataFrame) -> pd.DataFrame:
    """Test how measurement-risk scores change under uncertainty scenarios."""
    scenarios = {
        "baseline": 1.00,
        "lower_uncertainty": 0.75,
        "higher_uncertainty": 1.25,
        "strong_uncertainty": 1.50,
    }

    frames = []

    for scenario_name, multiplier in scenarios.items():
        scenario = scored.copy()
        scenario["scenario"] = scenario_name
        scenario["scenario_combined_uncertainty"] = (
            scenario["combined_uncertainty"] * multiplier
        )
        scenario["scenario_uncertainty_adjusted_pressure"] = (
            scenario["pressure_ratio"] * (1 + scenario["scenario_combined_uncertainty"])
        )
        scenario["scenario_measurement_risk_score"] = (
            scenario["scenario_uncertainty_adjusted_pressure"]
            * (1 + scenario["monitoring_gap"])
        )
        scenario["scenario_rank"] = scenario["scenario_measurement_risk_score"].rank(
            ascending=False,
            method="dense",
        )
        frames.append(scenario)

    return pd.concat(frames, ignore_index=True)


def main() -> None:
    """Run the planetary-boundary measurement workflow."""
    output_dir = Path("articles/how-planetary-boundaries-are-measured/outputs")
    output_dir.mkdir(parents=True, exist_ok=True)

    data = build_sample_measurements()
    scored = score_measurements(data)
    zone_summary = summarize_by_zone(scored)
    sensitivity = run_uncertainty_sensitivity(scored)

    scored.to_csv(output_dir / "boundary_measurement_scores.csv", index=False)
    zone_summary.to_csv(output_dir / "risk_zone_summary.csv", index=False)
    sensitivity.to_csv(output_dir / "measurement_uncertainty_sensitivity.csv", index=False)

    display_columns = [
        "boundary_process",
        "control_variable",
        "pressure_ratio",
        "combined_uncertainty",
        "monitoring_capacity",
        "measurement_risk_score",
        "risk_zone",
        "measurement_priority",
    ]

    print("\nBoundary measurement scores:")
    print(scored[display_columns].round(3).to_string(index=False))

    print("\nRisk zone summary:")
    print(zone_summary.round(3).to_string(index=False))


if __name__ == "__main__":
    main()
This workflow makes the measurement architecture visible. It does not simply ask whether a boundary is transgressed. It asks how the control variable is defined, how far the observed value is from the boundary, how much uncertainty surrounds the observation and boundary value, whether monitoring capacity is strong enough, and whether the process falls into a safe zone, zone of increasing risk, or high-risk zone.
That separation is useful because the governance response differs depending on whether the main problem is pressure, uncertainty, monitoring weakness, or some combination of all three. A high-pressure boundary demands urgent reduction. A high-uncertainty boundary demands better measurement and precaution. A weak-monitoring boundary demands investment in observation systems before risk can be governed responsibly.
Advanced R Workflow: Boundary-Measurement Dashboarding
The following R workflow prepares dashboard-ready outputs for planetary-boundary measurement. It is designed for analysts, engineers, researchers, and governance teams that need to compare boundary processes, control variables, risk zones, uncertainty, and monitoring capacity in a transparent format.
# Planetary-boundary measurement dashboard
#
# This workflow models how boundary processes are measured through
# control variables, observed values, boundary values, uncertainty,
# monitoring capacity, and risk-zone classification.
#
# The values are illustrative and should be replaced with documented
# boundary measurements, source provenance, and review notes before applied use.

library(readr)
library(dplyr)
library(tidyr)

boundary_measurements <- tibble::tibble(
  boundary_process = c(
    "climate_change",
    "biosphere_integrity",
    "freshwater_change",
    "land_system_change",
    "biogeochemical_flows",
    "ocean_acidification",
    "novel_entities",
    "atmospheric_aerosol_loading",
    "stratospheric_ozone_depletion"
  ),
  control_variable = c(
    "atmospheric_co2_and_energy_imbalance_proxy",
    "functional_integrity_proxy",
    "streamflow_and_root_zone_soil_moisture_proxy",
    "forest_cover_and_biome_integrity_proxy",
    "nitrogen_and_phosphorus_perturbation_proxy",
    "carbonate_saturation_proxy",
    "production_release_and_assessment_gap_proxy",
    "regional_aerosol_optical_depth_proxy",
    "stratospheric_ozone_concentration_proxy"
  ),
  observed_value = c(1.42, 1.70, 1.28, 1.24, 1.85, 1.08, 1.65, 0.95, 0.72),
  boundary_value = c(1, 1, 1, 1, 1, 1, 1, 1, 1),
  high_risk_value = c(1.5, 1.5, 1.5, 1.5, 1.5, 1.5, 1.5, 1.5, 1.5),
  observation_uncertainty = c(0.05, 0.15, 0.12, 0.10, 0.10, 0.08, 0.25, 0.22, 0.05),
  boundary_uncertainty = c(0.10, 0.22, 0.18, 0.16, 0.14, 0.12, 0.30, 0.28, 0.08),
  monitoring_capacity = c(0.85, 0.55, 0.62, 0.66, 0.58, 0.70, 0.38, 0.48, 0.82)
)

scored <- boundary_measurements %>%
  mutate(
    pressure_ratio = observed_value / boundary_value,
    high_risk_ratio = high_risk_value / boundary_value,
    combined_uncertainty = observation_uncertainty + boundary_uncertainty,
    uncertainty_adjusted_pressure = pressure_ratio * (1 + combined_uncertainty),
    monitoring_gap = 1 - monitoring_capacity,
    measurement_risk_score = uncertainty_adjusted_pressure * (1 + monitoring_gap),
    risk_zone = case_when(
      pressure_ratio < 1 ~ "safe_zone",
      pressure_ratio < high_risk_ratio ~ "zone_of_increasing_risk", TRUE ~ "high_risk_zone" ), measurement_priority = case_when( risk_zone == "high_risk_zone" ~ "high_pressure_priority", combined_uncertainty >= 0.45 ~ "uncertainty_priority",
      monitoring_gap >= 0.50 ~ "monitoring_priority",
      risk_zone == "zone_of_increasing_risk" ~ "risk_zone_tracking_priority",
      TRUE ~ "standard_tracking"
    )
  ) %>%
  arrange(desc(measurement_risk_score))

dashboard_long <- scored %>%
  select(
    boundary_process,
    pressure_ratio,
    combined_uncertainty,
    monitoring_capacity,
    measurement_risk_score
  ) %>%
  pivot_longer(
    cols = -boundary_process,
    names_to = "metric",
    values_to = "value"
  )

risk_zone_summary <- scored %>%
  group_by(risk_zone) %>%
  summarise(
    boundaries = n(),
    mean_pressure_ratio = mean(pressure_ratio),
    mean_combined_uncertainty = mean(combined_uncertainty),
    mean_monitoring_capacity = mean(monitoring_capacity),
    mean_measurement_risk_score = mean(measurement_risk_score),
    .groups = "drop"
  ) %>%
  arrange(desc(mean_measurement_risk_score))

uncertainty_scenarios <- tibble::tibble(
  scenario = c(
    "baseline",
    "lower_uncertainty",
    "higher_uncertainty",
    "strong_uncertainty"
  ),
  uncertainty_multiplier = c(1.00, 0.75, 1.25, 1.50)
)

sensitivity <- scored %>%
  crossing(uncertainty_scenarios) %>%
  mutate(
    scenario_combined_uncertainty = combined_uncertainty * uncertainty_multiplier,
    scenario_uncertainty_adjusted_pressure =
      pressure_ratio * (1 + scenario_combined_uncertainty),
    scenario_measurement_risk_score =
      scenario_uncertainty_adjusted_pressure * (1 + monitoring_gap)
  ) %>%
  group_by(scenario) %>%
  mutate(rank = dense_rank(desc(scenario_measurement_risk_score))) %>%
  ungroup()

output_dir <- "articles/how-planetary-boundaries-are-measured/outputs"

dir.create(
  output_dir,
  recursive = TRUE,
  showWarnings = FALSE
)

write_csv(
  scored,
  file.path(output_dir, "r_boundary_measurement_scores.csv")
)

write_csv(
  dashboard_long,
  file.path(output_dir, "r_dashboard_long.csv")
)

write_csv(
  risk_zone_summary,
  file.path(output_dir, "r_risk_zone_summary.csv")
)

write_csv(
  sensitivity,
  file.path(output_dir, "r_measurement_sensitivity.csv")
)

print(scored)
print(risk_zone_summary)
This R workflow is designed for transparent interpretation. It distinguishes observed pressure, uncertainty, monitoring capacity, and risk-zone classification rather than collapsing them into one unexplained score. It also produces long-format dashboard data that can be used in reporting tools, analytics notebooks, or reproducible research pipelines.
The sensitivity section is especially important because uncertainty should not be hidden. Analysts can compare how measurement-risk rankings change under lower, higher, or stronger uncertainty assumptions. That makes the dashboard more honest and more useful for governance, because it reveals which conclusions are robust and which depend heavily on uncertainty choices.
Advanced Go Workflow: Lightweight Boundary-Measurement Scoring Service
The following Go workflow translates the same measurement logic into a compact scoring service. Go is useful for command-line tools, APIs, monitoring services, and operational risk engines. This example reads boundary-measurement records from a CSV file and reports pressure ratio, combined uncertainty, monitoring gap, measurement-risk score, risk zone, and measurement priority.
package main

import (
	"encoding/csv"
	"errors"
	"fmt"
	"os"
	"strconv"
)

type BoundaryMeasurement struct {
	BoundaryProcess       string
	ControlVariable       string
	ObservedValue         float64
	BoundaryValue         float64
	HighRiskValue         float64
	ObservationUncertainty float64
	BoundaryUncertainty   float64
	MonitoringCapacity    float64
}

func parseFloat(value string) (float64, error) {
	parsed, err := strconv.ParseFloat(value, 64)
	if err != nil {
		return 0, fmt.Errorf("invalid numeric value %q: %w", value, err)
	}
	return parsed, nil
}

func parseMeasurement(row []string) (BoundaryMeasurement, error) {
	if len(row) < 8 {
		return BoundaryMeasurement{}, errors.New("expected at least 8 columns")
	}

	values := make([]float64, 6)
	for i := 2; i < 8; i++ {
		parsed, err := parseFloat(row[i])
		if err != nil {
			return BoundaryMeasurement{}, err
		}
		values[i-2] = parsed
	}

	return BoundaryMeasurement{
		BoundaryProcess:       row[0],
		ControlVariable:       row[1],
		ObservedValue:         values[0],
		BoundaryValue:         values[1],
		HighRiskValue:         values[2],
		ObservationUncertainty: values[3],
		BoundaryUncertainty:   values[4],
		MonitoringCapacity:    values[5],
	}, nil
}

func pressureRatio(m BoundaryMeasurement) float64 {
	if m.BoundaryValue <= 0 {
		return 0
	}
	return m.ObservedValue / m.BoundaryValue
}

func highRiskRatio(m BoundaryMeasurement) float64 {
	if m.BoundaryValue <= 0 {
		return 0
	}
	return m.HighRiskValue / m.BoundaryValue
}

func combinedUncertainty(m BoundaryMeasurement) float64 {
	return m.ObservationUncertainty + m.BoundaryUncertainty
}

func monitoringGap(m BoundaryMeasurement) float64 {
	return 1 - m.MonitoringCapacity
}

func uncertaintyAdjustedPressure(m BoundaryMeasurement) float64 {
	return pressureRatio(m) * (1 + combinedUncertainty(m))
}

func measurementRiskScore(m BoundaryMeasurement) float64 {
	return uncertaintyAdjustedPressure(m) * (1 + monitoringGap(m))
}

func riskZone(m BoundaryMeasurement) string {
	ratio := pressureRatio(m)

	switch {
	case ratio < 1.0:
		return "safe_zone"
	case ratio < highRiskRatio(m): return "zone_of_increasing_risk" default: return "high_risk_zone" } } func measurementPriority(m BoundaryMeasurement) string { switch { case riskZone(m) == "high_risk_zone": return "high_pressure_priority" case combinedUncertainty(m) >= 0.45:
		return "uncertainty_priority"
	case monitoringGap(m) >= 0.50:
		return "monitoring_priority"
	case riskZone(m) == "zone_of_increasing_risk":
		return "risk_zone_tracking_priority"
	default:
		return "standard_tracking"
	}
}

func main() {
	if len(os.Args) < 2 {
		fmt.Println("usage: boundary-measurement-score measurements.csv")
		os.Exit(1)
	}

	file, err := os.Open(os.Args[1])
	if err != nil {
		fmt.Println("error opening file:", err)
		os.Exit(1)
	}
	defer file.Close()

	reader := csv.NewReader(file)
	rows, err := reader.ReadAll()
	if err != nil {
		fmt.Println("error reading CSV:", err)
		os.Exit(1)
	}

	for i, row := range rows {
		if i == 0 {
			continue
		}

		measurement, err := parseMeasurement(row)
		if err != nil {
			fmt.Println("parse error:", err)
			continue
		}

		fmt.Printf(
			"boundary=%s control_variable=%s pressure=%.3f uncertainty=%.3f monitoring_gap=%.3f risk_score=%.3f zone=%s priority=%s\n",
			measurement.BoundaryProcess,
			measurement.ControlVariable,
			pressureRatio(measurement),
			combinedUncertainty(measurement),
			monitoringGap(measurement),
			measurementRiskScore(measurement),
			riskZone(measurement),
			measurementPriority(measurement),
		)
	}
}
The Go workflow shows how boundary-measurement logic can move from article-level explanation into operational systems. A lightweight scoring service could support internal dashboards, API endpoints, data pipelines, monitoring systems, or audit tools. It keeps the main assumptions visible: observed value, boundary value, high-risk value, uncertainty, monitoring capacity, and risk-zone classification.
A production implementation should add schema validation, missing-data handling, unit checking, versioned boundary definitions, structured logging, test coverage, source metadata, and uncertainty intervals. Boundary measurement becomes credible when the full pipeline can be inspected, not only the final score.
Engineering Extensions in the GitHub Repository
The accompanying GitHub repository extends the article workflow beyond Python, R, and Go into a broader engineering scaffold. The article body keeps Python and R visible because they are accessible tools for measurement analytics, boundary scoring, dashboard preparation, and reproducible reporting. Go provides a compact service layer. The repository, however, is structured for readers who want to translate planetary-boundary measurement into more technical systems: auditable databases, scoring engines, APIs, embedded monitoring, scenario simulation, edge anomaly detection, and accelerator-aware environmental data pipelines.
The SQL scaffold is intended for boundary processes, control-variable definitions, observed values, boundary values, high-risk values, uncertainty estimates, monitoring capacity, risk zones, source provenance, scoring runs, and audit trails. Rust can support reliable scoring engines or command-line tools where type safety and reproducibility matter. Go can support lightweight diagnostic APIs. C and C++ can support embedded threshold monitoring, local signal processing, or scenario simulation. TinyML can support low-power anomaly detection at the edge, while PYNQ-oriented scaffolding can support accelerated preprocessing of environmental monitoring streams.
This engineering layer matters because planetary-boundary measurement is only as credible as the infrastructure behind it. If control variables are not documented, if thresholds are not versioned, if uncertainty is not stored, if data provenance is unclear, or if outputs cannot be reproduced, the framework can appear more precise than it really is. A serious measurement architecture should make assumptions inspectable and results reproducible.
A mature implementation should also include documentation for indicator choice, unit conventions, baseline periods, control-variable definitions, uncertainty handling, model versions, spatial aggregation methods, and governance interpretation. Without that layer, measurement can become a decorative score. With it, measurement becomes accountable knowledge infrastructure.
GitHub Repository
Complete Code Repository
The full code distribution for this article, including Python, R, and Go workflows plus extended engineering scaffolding for SQL, Rust, C, C++, TinyML, and PYNQ-oriented planetary-boundary measurement diagnostics, is available on GitHub.
Common Misunderstandings
A common misunderstanding is that each planetary boundary is measured by one neat number in the same way. In fact, the framework mixes single variables, paired variables, composite interpretations, regional measurements, and more weakly quantified processes depending on the science available.
Another misunderstanding is that the measured value is the boundary itself. The boundary is a resilience-based judgment about an Earth-system process; the measured variable is the best available representation of that process. A metric can support interpretation, but it is not the whole system.
A third misunderstanding is that uncertainty makes the measurements meaningless. In the framework, uncertainty is part of why boundaries are set conservatively and why zones of increasing risk matter. Uncertainty does not eliminate the value of measurement. It changes how measurements should be interpreted.
A fourth misunderstanding is that boundaries are arbitrary because they have changed over time. Revision is not arbitrariness. It is how a scientific measurement architecture improves. Freshwater change, biosphere integrity, novel entities, and aerosol loading have all required refinement because the underlying processes are complex and the evidence base has evolved.
A fifth misunderstanding is that hard-to-measure boundaries are less important. They may be difficult precisely because the pressures involved are diffuse, cumulative, fast-moving, or poorly governed. Novel entities and aerosol loading show why measurement difficulty can itself be a warning sign. If society cannot measure a risk well, it should not assume that the risk is small.
A final misunderstanding is that measurement alone creates governance. Measurement can reveal risk, but it cannot by itself reduce pressure, enforce accountability, repair ecosystems, or protect vulnerable communities. Measurement becomes meaningful when connected to action.
Related Articles
- What Are Planetary Boundaries?
- The Origins of the Planetary Boundaries Framework
- Safe Operating Space and the Logic of Thresholds
- Climate Change as a Planetary Boundary
- Biosphere Integrity and the Stability of Life Systems
- Land-System Change and Ecological Transformation
- Freshwater Change and Earth System Risk
- Biogeochemical Flows: Nitrogen, Phosphorus, and Planetary Destabilization
- Ocean Acidification and the Chemistry of Planetary Change
- Stratospheric Ozone Depletion and Global Environmental Governance
- Atmospheric Aerosol Loading and Regional Planetary Risk
- Novel Entities and the Problem of Synthetic Overload
- Planetary Boundaries and Earth System Resilience
- Tipping Points, Feedback Loops, and Cascading Ecological Change
- Uncertainty, Precaution, and Scientific Debate in Boundary Setting
- Planetary Boundaries, Justice, and Global Inequality
- Earth System Governance in an Age of Limits
- The Future of Planetary Stewardship
Further Reading
- Planetary Boundaries
- Risk & Resilience
- Systems Thinking
- Data Systems & Analytics
- Environmental Monitoring Systems
- Environmental Science
- Earth Science
References
- Kitzmann, N. et al. (2025) Planetary Health Check 2025: A Scientific Assessment of the State of the Planet. Potsdam: Potsdam Institute for Climate Impact Research. Available at: https://www.planetaryhealthcheck.org/.
- Richardson, K., Steffen, W., Lucht, W., Bendtsen, J., Cornell, S.E., Donges, J.F., Drüke, M., Fetzer, I., Bala, G., von Bloh, W., Feulner, G., Fiedler, S., Gerten, D., Gleeson, T., Hofmann, M., Huiskamp, W., Jakobsson, C., Jürgensen, J.H., Kummu, M., Mohan, C., Nogués-Bravo, D., Petri, S., Porkka, M., Rahmstorf, S., Schaphoff, S., Schulte-Uebbing, L., Staal, A., Sun, Z., Sakschewski, B. and Wang-Erlandsson, L. (2023) ‘Earth beyond six of nine planetary boundaries’, Science Advances, 9(37), eadh2458. Available at: https://www.science.org/doi/10.1126/sciadv.adh2458.
- Rockström, J., Steffen, W., Noone, K., Persson, Å., Chapin, F.S. III, Lambin, E.F., Lenton, T.M., Scheffer, M., Folke, C., Schellnhuber, H.J., Nykvist, B., de Wit, C.A., Hughes, T., van der Leeuw, S., Rodhe, H., Sörlin, S., Snyder, P.K., Costanza, R., Svedin, U., Falkenmark, M., Karlberg, L., Corell, R.W., Fabry, V.J., Hansen, J., Walker, B., Liverman, D., Richardson, K., Crutzen, P. and Foley, J.A. (2009a) ‘A safe operating space for humanity’, Nature, 461, pp. 472–475. Available at: https://www.nature.com/articles/461472a.
- Rockström, J., Steffen, W., Noone, K., Persson, Å., Chapin, F.S. III, Lambin, E.F., Lenton, T.M., Scheffer, M., Folke, C., Schellnhuber, H.J., Nykvist, B., de Wit, C.A., Hughes, T., van der Leeuw, S., Rodhe, H., Sörlin, S., Snyder, P.K., Costanza, R., Svedin, U., Falkenmark, M., Karlberg, L., Corell, R.W., Fabry, V.J., Hansen, J., Walker, B., Liverman, D., Richardson, K., Crutzen, P. and Foley, J.A. (2009b) ‘Planetary boundaries: Exploring the safe operating space for humanity’, Ecology and Society, 14(2), 32. Available at: https://www.ecologyandsociety.org/vol14/iss2/art32/.
- Rockström, J. et al. (2024) ‘Planetary boundaries guide humanity’s future on Earth’, Nature Reviews Earth & Environment, 5, pp. 773–788. Available at: https://www.nature.com/articles/s43017-024-00597-z.
- Steffen, W., Richardson, K., Rockström, J., Cornell, S.E., Fetzer, I., Bennett, E.M., Biggs, R., Carpenter, S.R., de Vries, W., de Wit, C.A., Folke, C., Gerten, D., Heinke, J., Mace, G.M., Persson, L.M., Ramanathan, V., Reyers, B. and Sörlin, S. (2015) ‘Planetary boundaries: Guiding human development on a changing planet’, Science, 347(6223), 1259855. Available at: https://www.science.org/doi/10.1126/science.1259855.
- Stockholm Resilience Centre (n.d.) Planetary boundaries. Available at: https://www.stockholmresilience.org/research/planetary-boundaries.html.
- Stockholm Resilience Centre (n.d.) Table of the nine planetary boundaries. Available at: https://www.stockholmresilience.org/research/planetary-boundaries/quantitative-evolution-of-boundaries.html.
- van Vuuren, D.P. et al. (2025) ‘Exploring pathways for world development within planetary boundaries’, Nature, 641, pp. 910–916. Available at: https://www.nature.com/articles/s41586-025-08928-w.
- Wang-Erlandsson, L. et al. (2024) ‘The new planetary boundary for freshwater change: key findings and their potential to guide water management and policy’. Available via Stockholm Resilience Centre at: https://www.stockholmresilience.org/publications/publications/2024-10-15-the-new-planetary-boundary-for-freshwater-change-key-findings-and-their-potential-to-guide-water-management-and-policy.html.