
Last Updated May 14, 2026
Water quality monitoring systems are coupled hydrological, chemical, biological, and institutional infrastructures through which the condition of water becomes measurable, interpretable, and governable. They combine continuous field sensing, discrete sampling, laboratory analysis, hydrological context, quality-assurance procedures, and regulatory or operational assessment frameworks in order to determine whether water is safe, impaired, changing, or at risk. In this sense, water quality monitoring is not merely the collection of samples or the reading of sensors. It is the disciplined construction of aquatic legibility: a way of making variable and often invisible water conditions visible enough to support public-health protection, ecosystem stewardship, treatment operations, watershed management, and environmental governance.
Water presents a distinctive monitoring problem because quality is never separable from movement, context, and use. Pollutants are transported through watersheds, diluted or concentrated by flow, transformed by temperature and biological activity, and experienced differently depending on whether the relevant concern is drinking-water safety, aquatic habitat, recreation, wastewater discharge, irrigation, industrial use, or long-term basin management. A single value rarely speaks for itself. The meaning of pH, dissolved oxygen, turbidity, nitrate, salinity, chlorophyll, microbial indicators, trace metals, pesticides, PFAS, or emerging contaminants depends on where the water is in the hydrological system, when the measurement was taken, how it was measured, what hydrological condition was present, and what use or risk question is being asked.
For this reason, water quality monitoring is not fundamentally a parameter-list problem. It is a systems problem of representativeness, interpretation, quality assurance, and decision purpose. Monitoring programs must decide what to measure, where to sample, how often to observe, which variables can be estimated continuously, which require laboratory confirmation, how to account for event-driven variability, and how to link chemistry to hydrology, ecology, infrastructure, and human exposure. The deeper value of a monitoring system lies not in the volume of data it collects, but in whether it can transform variable aquatic conditions into trustworthy evidence for action.
Main Library
Publications
Article Map
Environmental Monitoring
Related Topic
Watershed Monitoring
Related Topic
Data Systems
Related Topic
Risk & Resilience
Water quality monitoring is where aquatic observation becomes public evidence. It asks not only whether a parameter can be measured, but whether the measurement is representative, quality-assured, hydrologically contextualized, analytically valid, and connected to a decision framework. The central question is not simply whether water-quality data exist. It is whether the monitoring system can support credible judgment about condition, risk, change, compliance, treatment, restoration, or protection.
Engineering Problem
The engineering problem is how to design water quality monitoring systems that can transform partial, method-dependent, temporally variable observations into defensible evidence about aquatic condition, risk, impairment, exposure, and management need. Water quality is not directly visible in a complete way. It must be inferred through field parameters, laboratory analytes, biological indicators, hydrological context, sampling design, quality-assurance procedures, standards, and decision frameworks. A monitoring system therefore succeeds only when its evidence chain is strong enough for the claim being made.
This problem is difficult because water quality changes across multiple scales. Some variables, such as temperature, dissolved oxygen, pH, conductance, turbidity, and chlorophyll-related indicators, may fluctuate hourly or daily. Others, such as nutrients, sediment, microbial indicators, pesticides, metals, PFAS, or emerging contaminants, may appear through episodic pulses, chronic low-level exposure, seasonal patterns, treatment failures, storm runoff, groundwater pathways, or industrial discharges. Some risks are local and immediate; others are cumulative, delayed, diffuse, or ecological. The monitoring architecture must therefore align variable choice, sampling frequency, hydrological timing, analytical method, and decision use.
Weak water quality monitoring treats measurements as self-explanatory. Strong water quality monitoring treats measurements as evidence within a controlled interpretive system. It asks where the sample or sensor is located, what water body or system it represents, whether hydrological conditions were recorded, whether data were quality-assured, whether the parameter is a direct measure or proxy, whether the method fits the decision, whether thresholds or standards apply, whether uncertainty is documented, and whether the evidence can support the intended public, ecological, operational, or regulatory claim.
| Engineering Tension | Why It Matters | Required Evidence |
|---|---|---|
| Measurement versus assessment | A value does not by itself establish safety, impairment, compliance, or ecological condition. | Assessment framework, designated use, criteria, threshold, standard, or operational decision rule |
| Concentration versus transported load | Point concentration may not indicate total material moving through the water system. | Flow record, sample timing, load-estimation method, uncertainty statement |
| Continuous sensing versus laboratory specificity | Sensors provide temporal resolution; laboratories provide analyte specificity and confirmation. | Sensor registry, lab method, calibration record, validation and confirmation workflow |
| Routine sampling versus event capture | Storms, first flush, low-flow stress, algal episodes, and contamination pulses may be missed by fixed schedules. | Event-triggered sampling plan, autosampler configuration, hydrological event flags |
| Technical precision versus representativeness | A precise measurement can mislead if the site, timing, depth, or method does not represent the question. | Site rationale, sampling design, hydrological metadata, representativeness audit |
| Proxy signal versus direct contaminant evidence | Turbidity, conductance, chlorophyll, and optical signals can indicate patterns without proving specific causes. | Proxy-use statement, validation record, confirmatory sampling, valid-use limits |
| Monitoring capacity versus governance need | Standards and public-health goals require evidence systems that may exceed local technical capacity. | Capacity plan, QA/QC program, laboratory access, data-management workflow, public evidence package |
The practical question is therefore: can the monitoring system support the aquatic judgment being made, or does it merely produce numbers that appear authoritative without enough context, quality control, or decision linkage?
Reference Architecture
A practical water quality monitoring architecture can be understood as an aquatic evidence and assessment system. The exact implementation may include continuous sondes, single-parameter sensors, grab samples, composite samples, autosamplers, laboratory workflows, field meters, hydrological gauges, chain-of-custody records, QA/QC protocols, telemetry networks, data platforms, standards databases, dashboards, advisory systems, regulatory assessment tools, and public reporting workflows. The responsibilities remain consistent: observe, sample, preserve, transmit, validate, contextualize, assess, decide, document, and revise.
| Layer | Engineering Role | Primary Risk | Evidence Artifact |
|---|---|---|---|
| Objective and use layer | Defines the water body, use, risk question, decision context, parameter set, and assessment purpose. | Monitoring is designed around available instruments rather than the decision need. | Monitoring objective manifest, designated-use statement, parameter rationale |
| Site and hydrological layer | Links samples and sensors to location, depth, flow, watershed position, waterbody type, and use context. | Measurements are interpreted without spatial or hydrological representativeness. | Site registry, hydrological context table, watershed metadata |
| Observation and sampling layer | Collects field measurements, sensor streams, grab samples, composite samples, and biological or microbial samples. | Critical variables or exposure pathways are not observed at appropriate frequency or method. | Sensor registry, sampling plan, field protocol, sample event log |
| Laboratory and analytical layer | Provides analyte specificity, confirmatory testing, detection limits, and method-controlled results. | Analytical values are used without method, detection, preservation, or chain-of-custody context. | Lab method table, chain-of-custody record, detection-limit metadata |
| QA/QC and validation layer | Checks calibration, blanks, duplicates, drift, fouling, sample integrity, outliers, and review flags. | Bad or method-inconsistent data become public, regulatory, or operational evidence. | QA/QC policy, calibration log, blank/duplicate records, validation flags |
| Hydrological and load layer | Pairs concentration with discharge, stage, runoff events, dilution, residence time, and transport logic. | Concentration is overinterpreted without flow, load, timing, or watershed pathway context. | Flow linkage table, load-estimation method, event flag, uncertainty statement |
| Assessment and decision layer | Compares results against standards, criteria, thresholds, baselines, advisories, treatment requirements, or ecological expectations. | Measurements are presented without clear decision rules or valid-use boundaries. | Assessment matrix, threshold registry, advisory rule, regulatory-use statement |
| Governance and public evidence layer | Documents data access, caveats, accountability, capacity limits, revision history, and public communication. | Water-quality claims become difficult to inspect, contest, or revise. | Governance log, public evidence package, data-sharing record, caveat statement |
This architecture makes clear that water quality monitoring is not only analytical chemistry or field sensing. It is the management of a trust chain from aquatic condition to public judgment.
Implementation Pattern
A rigorous water quality monitoring implementation begins with the aquatic question, not with the parameter list. Drinking-water surveillance, ambient river monitoring, lake eutrophication assessment, wastewater compliance, agricultural runoff analysis, recreational beach advisories, groundwater contamination review, treatment-process control, and ecosystem restoration monitoring do not require identical designs. Each purpose implies different sites, parameters, frequency, methods, QA/QC, laboratory workflows, hydrological context, thresholds, and communication responsibilities.
| Artifact | Purpose | Suggested Format |
|---|---|---|
| Water quality monitoring objective manifest | Defines waterbody type, use, risk question, parameter set, decision use, and evidence standard. | YAML, Markdown, architecture decision record |
| Site and station registry | Stores site ID, location, waterbody type, depth, hydrological setting, watershed position, and agency owner. | CSV, SQL table, GeoJSON |
| Parameter and method registry | Documents parameters, units, methods, detection limits, sensor/lab status, and valid-use limits. | CSV, SQL table, method metadata file |
| Sensor and calibration log | Tracks field instruments, calibration events, fouling checks, drift review, maintenance, and deployment status. | CSV, observability export, field log |
| Sampling event log | Records grab, composite, autosampler, biological, and microbial sampling events with context and chain of custody. | CSV, SQL table, laboratory information export |
| Laboratory results table | Stores analytes, results, detection limits, method codes, flags, and lab QA/QC information. | CSV, SQL table, LIMS export |
| Hydrological context and load linkage | Pairs water-quality observations with flow, stage, event status, runoff context, and load-estimation fields. | CSV, SQL table, time-series join |
| Assessment threshold registry | Documents criteria, standards, advisory levels, operational thresholds, and valid-use boundaries. | CSV, YAML, SQL table |
| Public evidence and governance log | Tracks caveats, public claims, revisions, capacity limitations, standards changes, and accountability decisions. | Markdown, CSV, SQL table |
The implementation goal is to make water-quality conclusions reconstructable. A user should be able to move from a claim — safe, impaired, improving, hazardous, compliant, out of range, ecologically stressed, or requiring action — back to the site, method, sample, sensor, calibration record, hydrological condition, standard, threshold, uncertainty statement, and governance rule that produced it.
Research-Grade Framing: Water Quality Monitoring as Aquatic Knowledge Infrastructure
A research-grade account of water quality monitoring begins by treating it as aquatic knowledge infrastructure rather than as data collection. Monitoring systems determine which water-quality problems become visible, which remain under-characterized, which proxies are trusted, which laboratory methods define specificity, which thresholds transform values into judgments, and which institutions have enough capacity to act. They shape not only what is measured, but what forms of aquatic degradation become governable.
This role is epistemically demanding because water-quality knowledge is mediated. A turbidity reading may signal suspended sediment, storm runoff, construction disturbance, algal material, or sensor fouling depending on context. Specific conductance may indicate salinity, dissolved ions, wastewater influence, road salt, irrigation return flow, or geologic background. Dissolved oxygen may reflect habitat stress, temperature, photosynthesis, organic loading, or diel cycling. Chlorophyll may suggest bloom risk but not prove toxin presence. Nitrate may reflect agriculture, wastewater, groundwater, or biogeochemical transformation. A water-quality monitoring system must therefore preserve the contextual information that turns a measurement into a reasoned interpretation.
This also means water quality monitoring is never politically neutral in practice. What is monitored can become institutionally real; what is not monitored can remain unverified, unregulated, or publicly invisible. Communities with weak monitoring capacity may experience pollution without enough evidence for enforcement, treatment, restoration, or public warning. Aquatic degradation can remain hidden not because it is absent, but because the observation system is too sparse, too slow, too narrow, or too underfunded to make it legible.
| Limited Pattern | Stronger Pattern | Why the Shift Matters |
|---|---|---|
| Collect parameter values | Design an evidence system for aquatic condition, risk, use, and decision context | Prevents data volume from being mistaken for monitoring quality. |
| Use field sensors | Integrate sensors with calibration, fouling checks, laboratory confirmation, and valid-use limits | Protects temporal richness from becoming false confidence. |
| Take grab samples | Connect samples to hydrological timing, flow, event status, and exposure pathways | Prevents snapshot results from being overgeneralized. |
| Report concentrations | Estimate loads and event transport when watershed movement matters | Links water quality to transported mass and downstream consequence. |
| Apply standards mechanically | Document designated uses, criteria, duration, frequency, magnitude, and assessment logic | Clarifies how values become governance judgments. |
| Publish data without caveats | Provide public evidence packages with uncertainty, methods, capacity limits, and valid-use statements | Allows claims to be inspected, contested, and revised. |
The central research question is not “What parameters are measured?” but “What kind of aquatic knowledge does this monitoring system produce, with what uncertainty, for what decision, and with what accountability?”
Formal Model: Concentration, Load, Exposure, Assessment, and Evidence Quality
A useful formal model separates concentration, discharge, load, exposure, sampling representativeness, analytical validity, hydrological context, assessment thresholds, and governance readiness. Let \(C\) represent concentration, \(Q\) discharge, \(L\) load, \(E_x\) exposure, \(D_u\) designated use, \(S_m\) sampling representativeness, \(A_v\) analytical validity, \(H_c\) hydrological context, \(T_a\) threshold alignment, and \(G_r\) governance readiness. Water-quality evidence depends on these dimensions together, not on isolated parameter values alone.
L(t) = C(t)Q(t)
\]
Interpretation: Instantaneous load is concentration multiplied by discharge. This distinguishes point condition from transported mass.
L_{\mathrm{event}} = \int_{t_0}^{t_1} C(t)Q(t)\,dt
\]
Interpretation: Event load estimates total transported mass during a storm, pulse, treatment event, flood, or management-relevant period.
R_{\mathrm{exceedance}} = \frac{N_{\mathrm{exceedances}}}{N_{\mathrm{valid\ observations}}}
\]
Interpretation: Exceedance ratio summarizes how often valid observations exceed a threshold, criterion, or operational limit.
E_{\mathrm{exposure}} = C \times T \times F
\]
Interpretation: A simplified exposure expression depends on concentration, duration, and frequency of contact or use. Actual risk assessment requires parameter-specific toxicological, microbial, ecological, or regulatory methods.
Q_{\mathrm{water\ quality\ evidence}} =
w_1S_m +
w_2A_v +
w_3H_c +
w_4Q_c +
w_5L_r +
w_6T_a +
w_7U_c +
w_8D_i +
w_9G_r
\]
Interpretation: Water-quality evidence quality depends on sampling representativeness, analytical validity, hydrological context, QA/QC completeness, load readiness, threshold alignment, uncertainty communication, data interoperability, and governance readiness.
This formal structure protects against a common mistake in water quality monitoring: treating a measurement as if it directly answered a condition or risk question. Water-quality evidence becomes stronger when sampling design, analytical method, hydrology, QA/QC, thresholds, uncertainty, and governance are evaluated together.
What Are Water Quality Monitoring Systems?
Water quality monitoring systems are integrated systems for observing, sampling, analyzing, and interpreting the condition of water across natural and managed environments. They include in situ instruments that generate near-real-time measurements, grab and composite sampling protocols that support laboratory analysis, site metadata, hydrological observations, quality-control procedures, and interpretive frameworks that connect results to health, ecological, operational, or regulatory decisions.
Such systems may include continuous in situ monitors and multiparameter sondes; manual grab sampling and laboratory analysis; stream, lake, reservoir, estuary, groundwater, wastewater, stormwater, and drinking-water monitoring sites; telemetry and real-time data platforms; quality assurance and quality control procedures; and assessment frameworks tied to standards, criteria, advisories, treatment targets, or operational thresholds. USGS field guidance for multiparameter instruments is part of the broader National Field Manual for the Collection of Water-Quality Data, which provides official procedures for collecting water-quality data in surface water and groundwater. EPA’s water-quality criteria and standards resources show how scientific criteria, designated uses, and standards connect monitoring evidence to aquatic-life and human-health protection. WHO drinking-water quality guidance provides international norms used as a basis for regulation and standard setting, while UNEP’s GEMS/Water supports global inland water-quality data collection, analysis, and sharing.
The defining feature of these systems is interpretive purpose. Water quality is not directly visible in any complete sense. Some problems are chemical, some biological, some hydrological, some infrastructural, and many are episodic or diffuse. Monitoring systems therefore exist to transform partial observations into a reasoned account of condition. They are best understood as observational infrastructures for aquatic judgment rather than as mere collections of measurements.
| Monitoring Form | Primary Question | Typical Evidence | Main Risk |
|---|---|---|---|
| Ambient surface-water monitoring | What is the condition of rivers, lakes, reservoirs, estuaries, or watersheds? | Field parameters, nutrients, sediment, biological indicators, contaminants, flow context | Results are interpreted without watershed position, flow, or event timing. |
| Drinking-water surveillance | Is water safe within managed supply, treatment, and distribution systems? | Microbial, chemical, treatment, distribution, residual, and contaminant measurements | Public-health claims are made without method, frequency, or regulatory context. |
| Wastewater and discharge monitoring | Are effluents or returns within permitted or operational limits? | Effluent samples, flow, treatment-process data, permit parameters, lab reports | Compliance values are disconnected from receiving-water condition. |
| Recreational water monitoring | Is water safe for swimming, boating, fishing, or public contact? | Microbial indicators, algal indicators, advisories, recent rainfall, beach or access context | Episodic contamination or bloom risk is missed between sample events. |
| Ecological condition monitoring | How do water chemistry, habitat, temperature, and biological response interact? | Dissolved oxygen, temperature, nutrients, macroinvertebrates, fish, habitat, flow regime | Single-parameter thresholds obscure cumulative ecological stress. |
| Operational water-quality monitoring | How should treatment, distribution, source-water protection, or infrastructure operation respond? | Online sensors, alarms, process readings, source-water changes, confirmation samples | Real-time readings are treated as definitive without validation or response workflow. |
Water quality monitoring systems are therefore more than sampling programs. They are infrastructures for turning aquatic condition into evidence, judgment, and action.
Why Water Quality Monitoring Matters
Water quality monitoring matters because water is both an ecological medium and a human necessity. It shapes drinking-water safety, public health, aquatic habitat, food systems, industrial operations, wastewater management, irrigation, recreation, cultural use, and watershed resilience. Poor water quality can harm human populations directly through exposure, ecosystems through oxygen depletion or contamination, and institutions through treatment burdens, infrastructure stress, advisory failure, and regulatory breakdown.
It also matters because many water-quality problems are variable, cumulative, or politically invisible without systematic observation. Nutrient pulses may follow storms. Sediment loads may spike during runoff events. Low-flow periods may concentrate contaminants. Algal blooms may intensify with temperature, residence time, and nutrient conditions. Microbial contamination may appear intermittently rather than continuously. Diffuse-source pollution may accumulate gradually while remaining difficult to attribute from isolated snapshots. Monitoring creates the empirical discipline needed to distinguish temporary fluctuation from impairment, episodic contamination from chronic degradation, and apparent cleanliness from under-observation.
Water quality monitoring therefore matters not only because it measures water, but because it determines what pollution becomes visible enough to govern. In many cases, aquatic degradation is not absent until measured; it is simply unverified, dispersed, or institutionally illegible. Monitoring turns uncertain aquatic conditions into evidence that can support protection, enforcement, treatment, restoration, warning, or public accountability.
| Need | Monitoring Contribution | Risk Without Monitoring |
|---|---|---|
| Public-health protection | Detects microbial, chemical, treatment, and exposure-related risks. | Unsafe water conditions remain unverified or detected too late. |
| Aquatic-life protection | Tracks oxygen, temperature, nutrients, toxic contaminants, sediment, and habitat-related stress. | Ecological degradation remains hidden until biological decline is severe. |
| Pollution control | Identifies sources, pathways, loads, exceedances, and trends. | Diffuse or episodic pollution avoids attribution and accountability. |
| Treatment and operations | Supports source-water awareness, process control, distribution management, and confirmation testing. | Operators respond reactively to water-quality changes. |
| Watershed management | Connects water-quality signals to hydrology, land use, tributaries, and downstream consequence. | Management focuses on isolated sites rather than basin processes. |
| Public transparency | Creates inspectable evidence for advisories, standards, restoration, and enforcement. | Public claims become hard to verify or contest. |
| Environmental justice | Reveals whether vulnerable or historically under-monitored communities have adequate evidence protection. | Unequal monitoring capacity can shelter unequal exposure. |
Water quality monitoring matters because uncertainty often protects degradation when evidence systems are weak. Strong monitoring does not solve every water problem, but without it many problems remain invisible, unactionable, or politically deniable.
Water Quality Monitoring as Aquatic Knowledge Infrastructure
A rigorous account of water quality monitoring requires treating it as aquatic knowledge infrastructure. Monitoring systems do not simply collect data. They organize how water condition becomes knowable, what counts as credible evidence of impairment or safety, which variables are measured continuously, which are sampled intermittently, how uncertainty is managed, and how results are translated into judgments about use, risk, and change over time.
This knowledge role is unusually demanding because water quality is often mediated through proxies and context. Turbidity may act as a surrogate for suspended sediment or event-driven runoff, but does not directly describe every constituent of concern. Specific conductance may indicate dissolved ions or salinity pressure, but not by itself identify specific contaminants. Chlorophyll may suggest biological productivity or bloom risk, but not fully resolve toxin presence. Dissolved oxygen may indicate habitat stress, treatment performance, organic demand, photosynthetic activity, or thermal stress depending on setting. Water-quality knowledge is therefore inferential. Measurements become meaningful through interpretation, correlation, standards, hydrology, and method discipline.
Seen this way, monitoring systems are not passive recording devices. They are infrastructures that convert incomplete, variable, and heterogeneous aquatic signals into actionable forms of understanding. Their strength lies not only in technical precision, but in how well they preserve representativeness, contextual meaning, quality assurance, and decision relevance.
| Monitoring Choice | What Becomes More Visible | What May Remain Less Visible |
|---|---|---|
| Continuous field sensing | Rapid variation, diel cycles, event responses, operational changes, anomalies. | Analyte specificity, trace contaminants, microbial confirmation, lab-grade detection. |
| Grab sampling | Laboratory-specific analytes, method-controlled results, confirmatory evidence. | Short-lived pulses, high-frequency dynamics, storm-driven changes. |
| Routine sampling schedule | Long-term condition and trend comparability. | First-flush events, episodic discharges, blooms, and storm loads. |
| Standards-based assessment | Use-based judgments about safety, impairment, or compliance. | Cumulative ecological stress, unregulated contaminants, local context. |
| Sensor proxy monitoring | Surrogate signals for transport, salinity, bloom risk, oxygen stress, or disturbance. | Causal certainty unless validated with direct measurement. |
| Public dashboards | Accessible current condition and trend information. | Method caveats, QA/QC status, representativeness limits, exposure nuance. |
Water quality monitoring is powerful because it makes invisible aquatic conditions more legible. It is risky when partial measurement is mistaken for complete understanding.
Core Parameters and Measurement Targets
Water quality monitoring systems typically combine field parameters, nutrient indicators, biological or microbial indicators, and site-specific contaminants. Common field-monitored variables include temperature, pH, specific conductance, dissolved oxygen, and turbidity, often measured through multiparameter field instruments. Additional measurements may include nitrate, phosphorus species, chlorophyll, cyanobacteria-related indicators, organic matter proxies, microbial indicators, metals, pesticides, hydrocarbons, industrial chemicals, PFAS, pharmaceuticals, and other emerging pollutants where health, ecological, or compliance concerns require them.
| Parameter Group | Typical Variables | Monitoring Use | Interpretive Caveat |
|---|---|---|---|
| Physical field parameters | Temperature, turbidity, suspended solids, color, transparency | Thermal stress, sediment transport, storm response, habitat condition | Values depend strongly on flow, season, depth, and event timing. |
| Chemical field parameters | pH, conductivity, salinity, dissolved oxygen, oxidation-reduction potential | Acid-base condition, ionic strength, oxygen stress, salinity pressure, treatment context | Signals may be proxies and require context or confirmatory analysis. |
| Nutrients | Nitrate, nitrite, ammonia, total nitrogen, orthophosphate, total phosphorus | Eutrophication risk, agricultural runoff, wastewater influence, groundwater contribution | Concentration without flow can misstate load and downstream impact. |
| Biological productivity indicators | Chlorophyll, algal pigments, cyanobacteria indicators, organic matter proxies | Bloom risk, trophic condition, ecosystem response, reservoir or lake management | Bloom toxicity often requires more specific confirmation. |
| Microbial indicators | E. coli, enterococci, total coliforms, pathogen-specific tests where needed | Recreational water safety, drinking-water surveillance, wastewater influence | Microbial risks can vary rapidly after rainfall and contamination events. |
| Trace contaminants | Metals, pesticides, PFAS, solvents, industrial chemicals, pharmaceuticals | Human-health, ecological, source-attribution, compliance, and exposure assessment | Often requires laboratory specificity, detection limits, and careful sampling design. |
| Ecological response indicators | Macroinvertebrates, fish assemblages, habitat scores, biological indices | Cumulative ecosystem condition and stress response | Biological response integrates multiple drivers and may lag behind chemistry. |
No single variable is sufficient to characterize “water quality” as a unified condition. Parameters acquire meaning relationally. Temperature affects oxygen dynamics and biological activity. Conductance interacts with salinity and dissolved-ion loads. Turbidity reflects suspended material and hydrological disturbance. Nutrients drive productivity and eutrophication risk. Microbial indicators matter differently depending on intended use and exposure pathway. Water quality monitoring is therefore a logic of parameter interaction, not merely a catalog of analytes.
Key Analytical Distinctions
Water quality is not the same as water quantity. Flow, stage, and hydrological regime are often essential to interpreting quality, but measuring water level or discharge is not the same as measuring chemical, biological, microbial, or contaminant condition. The two must be coupled, not conflated.
Ambient water monitoring is not the same as drinking-water surveillance. Ambient monitoring often concerns rivers, lakes, groundwater bodies, estuaries, or watersheds as environmental systems. Drinking-water surveillance concerns managed supply systems and public-health protection under treatment and distribution conditions. Their variables and interpretive frameworks overlap, but their decision contexts differ.
Compliance monitoring is not the same as ecological assessment. A site may meet a specific numeric threshold while still exhibiting broader ecological stress. Conversely, ecological condition may be shaped by cumulative or interacting pressures not captured by single-contaminant compliance logic.
Treatment-process monitoring is not the same as watershed monitoring. Monitoring inside treatment or distribution systems serves operational control and safety assurance, whereas watershed monitoring often seeks to understand environmental condition, sources, pathways, transport, and long-term basin dynamics.
Continuous sensing is not the same as laboratory analysis. Field sensors provide temporal richness for selected variables, while laboratory methods provide specificity, lower detection limits, microbial confirmation, and access to constituents not measured reliably in situ. Robust systems depend on their integration.
Measurement is not the same as assessment. A concentration or field value does not by itself establish whether water is safe, impaired, compliant, or fit for use. That judgment depends on standards, criteria, designated uses, ecological thresholds, method validity, magnitude, duration, frequency, and context.
| Distinction | Why It Matters | Design Implication |
|---|---|---|
| Quality versus quantity | Flow shapes dilution, concentration, residence time, transport, and load. | Pair quality observations with hydrological context when interpreting condition or load. |
| Ambient monitoring versus drinking-water surveillance | Environmental condition and treated-water safety operate under different frameworks. | Use separate site metadata, standards, methods, and public-health interpretation. |
| Compliance versus ecological assessment | Numeric thresholds may not capture cumulative ecological stress. | Combine criteria, biological response, habitat, hydrology, and stressor context. |
| Field sensing versus laboratory analysis | Sensors and labs answer different temporal and analytical questions. | Define which readings are screening, operational, confirmatory, or regulatory evidence. |
| Concentration versus load | Point condition and transported mass are different forms of evidence. | Use discharge and event timing when management depends on material transport. |
| Measurement versus assessment | Values become judgments only through standards, thresholds, and valid-use logic. | Maintain assessment matrices and public caveats for each decision context. |
These distinctions prevent water quality monitoring from being reduced to parameter dashboards. The monitoring system’s purpose is to support defensible aquatic judgment, not merely to generate readings.
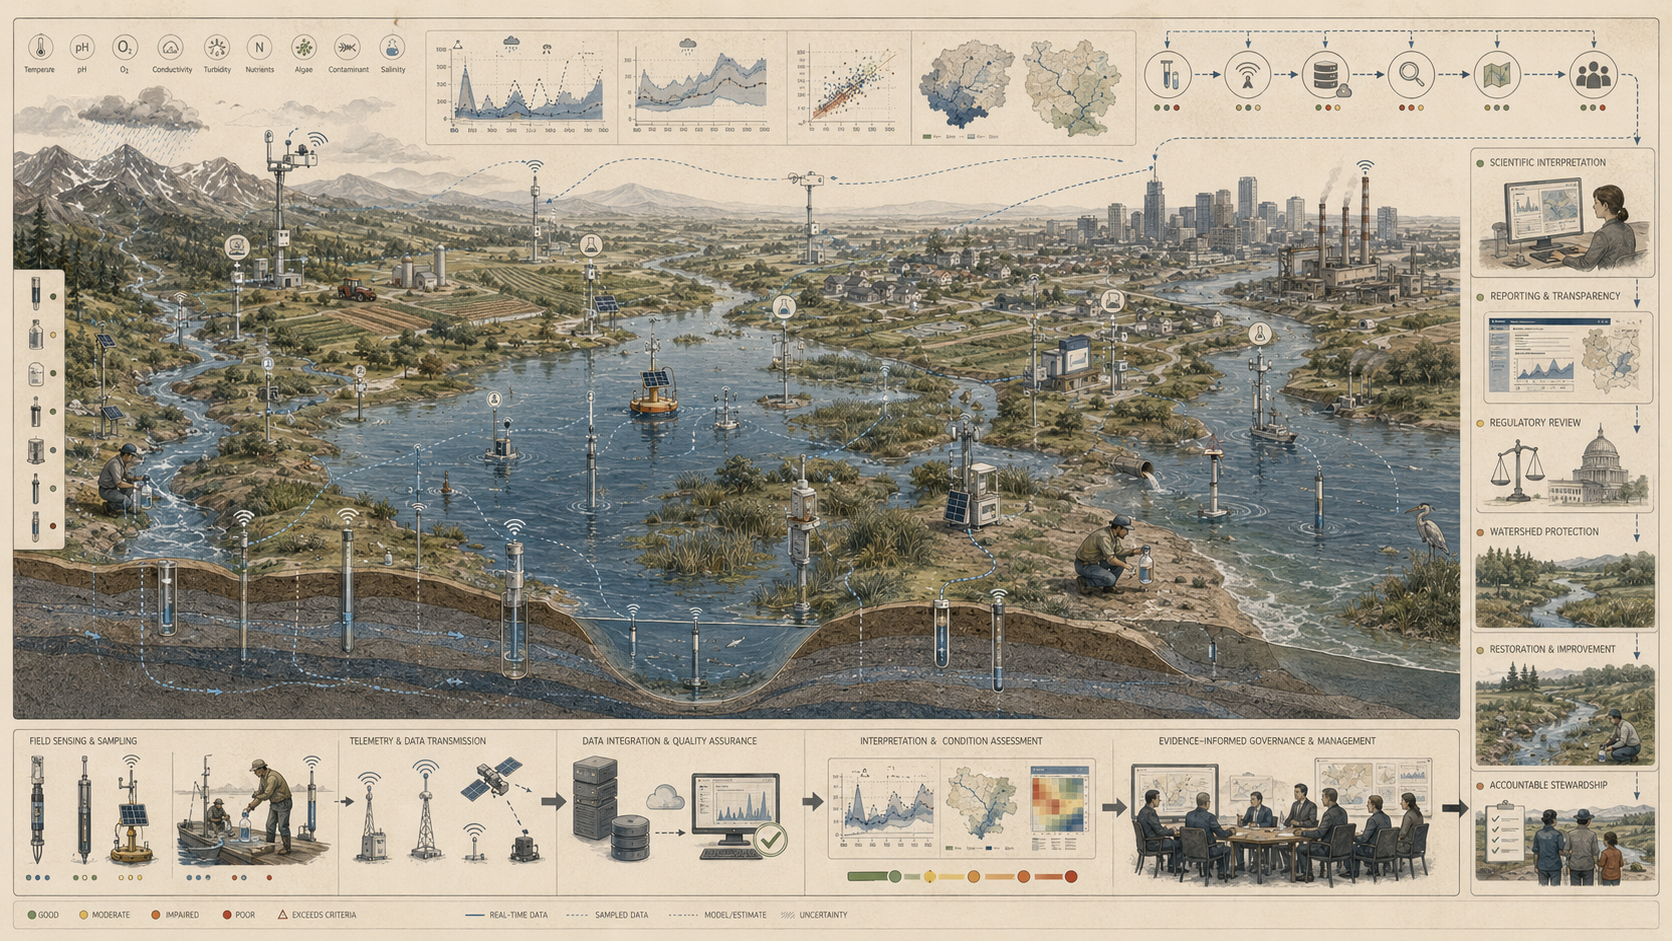
System Architecture: From Observation to Aquatic Decision Support
Water quality monitoring systems operate as layered architectures that connect field observation to institutional judgment and action. Field sensors and sampling protocols capture water-quality conditions at selected sites and times. Measurements are recorded, time-stamped, georeferenced, and paired with site and hydrological metadata. Calibration checks, blanks, duplicates, chain-of-custody records, laboratory methods, and review procedures identify error and uncertainty. Raw measurements are cleaned, validated, transformed, and placed into analyzable datasets. Results are compared against criteria, trends, ecological context, thresholds, treatment requirements, advisories, or operational needs. Agencies, utilities, researchers, and communities then use the information for compliance, treatment, restoration, warnings, public reporting, and policy.
| Stage | Transformation | Failure Risk |
|---|---|---|
| Aquatic condition | Water chemistry, biology, flow, temperature, land-use influence, and exposure pathways vary through time. | The selected parameter does not represent the risk or condition of concern. |
| Observation or sample | Sensors, field meters, grab samples, composite samples, or biological assessments capture partial evidence. | Site, timing, depth, or method is not representative. |
| Metadata capture | Records are linked to site, time, unit, method, hydrology, field conditions, and sample handling. | Data become difficult to interpret, combine, or validate. |
| QA/QC and calibration | Calibration, blanks, duplicates, drift checks, detection limits, and review flags qualify the evidence. | Bad data enter assessments or public dashboards. |
| Processing and integration | Values are cleaned, joined to flow or context, transformed, and prepared for analysis. | Processing hides assumptions or breaks lineage. |
| Assessment | Results are compared to thresholds, criteria, baselines, trends, advisories, or ecological expectations. | Measurement is mistaken for assessment without valid-use logic. |
| Decision and communication | Evidence supports treatment, warning, restoration, compliance, enforcement, public reporting, or further investigation. | Monitoring produces information without action, caveat, or accountability. |
| Review and revision | Methods, thresholds, sites, and sampling design are updated after events, failures, or new risks. | The monitoring system fails to learn from uncertainty or missed conditions. |
This architecture makes clear that the value of a water-quality result depends on more than measurement alone. Timing, metadata, hydrological context, method choice, QA/QC, and interpretive framework all shape whether an observation becomes credible evidence. In water systems, good monitoring is as much about the structure of the inference chain as about the instrument at the point of contact.
Continuous Sensors, Grab Samples, and Laboratory Analysis
Modern water quality programs often combine continuous sensing with discrete sampling because water-quality dynamics unfold across different timescales and constituent classes. Continuous monitoring is valuable where variables change rapidly during storms, low-flow stress, treatment events, tidal shifts, algal episodes, temperature extremes, or diel biological cycles. It provides temporal resolution that snapshot sampling cannot capture.
Grab samples and laboratory analysis remain essential because many constituents require greater specificity, lower detection limits, microbial testing, chain-of-custody documentation, or confirmatory chemistry than in situ platforms can provide. Laboratory methods are often necessary for trace contaminants, pathogen indicators, metals, organic chemicals, PFAS, pesticides, and analytes whose field measurement remains operationally limited or too uncertain for the decision at hand.
These methods should not be treated as competitors. Continuous sensing offers temporal visibility and operational awareness. Laboratory sampling offers analytical depth, specificity, and validation. Strong monitoring systems are hybrid systems because water-quality reality is both temporally dynamic and chemically diverse.
| Method | Strength | Best Use | Main Limitation |
|---|---|---|---|
| Continuous in situ sensors | High-frequency temporal visibility. | Temperature, pH, conductivity, dissolved oxygen, turbidity, chlorophyll-related signals, operational alarms. | Limited analyte specificity; requires calibration, fouling control, and validation. |
| Grab samples | Method-controlled snapshot evidence. | Laboratory chemistry, microbial indicators, site investigations, confirmatory testing. | May miss short-lived events or high-frequency variation. |
| Composite samples | Integrated evidence over time, flow, or discharge. | Wastewater, stormwater, load estimation, compliance contexts where averaging is appropriate. | Can obscure short peaks and depends on compositing design. |
| Autosamplers | Event-sensitive discrete sampling. | Storm pulses, first flush, sediment and nutrient transport, episodic contamination. | Requires trigger design, maintenance, preservation, and retrieval logistics. |
| Laboratory analysis | Analyte specificity, detection limits, confirmatory evidence. | Trace contaminants, pathogens, nutrients, metals, PFAS, pesticides, regulated parameters. | Slower turnaround and dependence on sample handling and method context. |
| Biological assessment | Integrates cumulative ecological response. | Aquatic-life condition, habitat stress, restoration assessment, long-term ecosystem health. | May lag behind chemical changes and requires careful protocol consistency. |
The strongest programs define which method produces which kind of evidence: screening, operational awareness, confirmatory analysis, regulatory assessment, ecological diagnosis, or public communication.
Representativeness, Timing, and Hydrological Context
One of the central intellectual problems in water quality monitoring is representativeness. A sample or sensor reading is never simply “the water body.” It is a measurement taken at a particular point, depth, flow condition, season, and hydrological moment. Whether that observation captures broader condition depends on site selection, sampling frequency, stratification, mixing, event timing, flow regime, and the dynamics of transport and transformation.
Storm-event undercapture is a classic problem. Many water-quality impairments intensify during high-flow runoff periods, yet routine monitoring schedules may miss those short-lived peaks. Conversely, baseflow sampling may reveal chronic conditions while understating event-driven pulses. Sensor fouling, calibration drift, and changing hydraulic conditions can further complicate interpretation. Laboratory precision may be high, yet still fail to reflect the most environmentally consequential moment if the sample was mistimed.
This means that representativeness is not guaranteed by technical accuracy alone. A precise result from a poorly timed or weakly situated sample can mislead. A lower-cost sensor placed strategically within a strong hydrological design may be more useful for real-world inference. Water quality monitoring is therefore a problem of temporal and spatial fit as much as analytical method.
| Challenge | How It Appears | Why It Matters | Mitigation |
|---|---|---|---|
| Storm-event undercapture | Routine sampling misses runoff pulses, first flush, and short-term peaks. | Loads and exposure risks may be underestimated. | Event-triggered sampling, autosamplers, high-frequency sensors, hydrological flags. |
| Baseflow bias | Samples overrepresent stable low-flow or normal-flow conditions. | Diffuse pollution and episodic transport remain hidden. | Stratify sampling by flow condition and season. |
| Spatial heterogeneity | Conditions differ by depth, bank, tributary input, lake layer, pipe segment, or mixing zone. | Single-point readings may not represent the relevant water body or exposure. | Use site rationale, transects, depth profiles, mixing assessment, and sub-site metadata. |
| Proxy misinterpretation | Surrogates such as turbidity or conductance are treated as direct contaminant measures. | Apparent signal may not prove specific cause or constituent. | Validate proxies with paired laboratory samples and causal context. |
| Sensor deployment bias | Sensors are placed where power, access, or security is easiest. | Monitoring reflects infrastructure convenience rather than risk distribution. | Use representativeness audits and risk-based site planning. |
| Temporal lag | Laboratory results arrive after the operational decision window. | Evidence may be confirmatory but not timely for warning or treatment. | Use rapid screening plus confirmatory workflows where needed. |
Representativeness is the bridge between measurement and meaning. Without it, water-quality data may be technically valid yet weakly informative for the actual decision.
Quality Assurance, Calibration, and Data Integrity
Water quality monitoring depends heavily on quality assurance and quality control because aquatic measurements are sensitive to calibration, fouling, contamination, sample handling, preservation, method choice, detection limits, and procedural inconsistency. Good data are not merely generated; they are produced through disciplined method.
| Practice | Purpose | Evidence Artifact | Failure Risk |
|---|---|---|---|
| Instrument calibration | Ensures field sensors and meters produce valid readings. | Calibration log, standard solution record, pre/post deployment check. | Sensor drift becomes apparent water-quality change. |
| Fouling and drift inspection | Detects biological growth, sediment coating, sensor aging, or platform malfunction. | Maintenance log, deployment notes, drift review flags. | False trends or false stability appear in continuous records. |
| Field blanks and duplicates | Checks contamination and measurement consistency. | Blank/duplicate records, QA/QC summary. | Contamination or variability goes unrecognized. |
| Sample handling and preservation | Protects sample integrity between field collection and laboratory analysis. | Chain-of-custody record, preservation method, holding time. | Laboratory result no longer represents field condition. |
| Detection-limit documentation | Clarifies analytical sensitivity and non-detect interpretation. | Method detection limit, reporting limit, qualifier flags. | Non-detects are mistaken for absence or comparable zeros. |
| Hydrological metadata | Links values to flow, stage, runoff, season, and event context. | Flow linkage, event flag, sampling condition notes. | Values are interpreted outside the conditions that produced them. |
| Data lineage and revision | Preserves the path from field record to reported value. | Version history, processing log, review status. | Public or regulatory claims become unreconstructable. |
QA/QC is not a bureaucratic supplement to monitoring. It is what allows observational claims to remain credible across scientific, regulatory, operational, and public contexts. In water-quality systems, trustworthiness depends on whether the path from field condition to reported value is documented, controlled, and fit for purpose.
Source–Pathway–Receptor Logic and Watershed Interpretation
Water-quality measurements acquire their deepest meaning when interpreted through source–pathway–receptor logic. Contaminants originate from sources such as agriculture, wastewater, urban runoff, industry, landfills, atmospheric deposition, geogenic conditions, septic systems, stormwater, or legacy contamination. They move through pathways shaped by land use, hydrology, infrastructure, soils, groundwater connection, drainage networks, channel transport, and residence time. They matter because they affect receptors such as drinking-water intakes, aquatic habitats, recreational users, irrigation systems, food webs, downstream communities, or sensitive species.
This watershed perspective is crucial because concentration alone rarely explains cause. The same nitrate value may reflect fertilizer runoff, wastewater influence, groundwater contribution, atmospheric deposition, or seasonal biogeochemical transformation. The same turbidity reading may arise from erosion, channel disturbance, stormflow, construction runoff, algal material, or sensor fouling. Effective monitoring programs therefore pair parameter data with watershed position, flow regime, tributary structure, land-use context, groundwater pathways, and management history so that measurements can be interpreted as part of movement through a basin rather than as isolated numbers.
This is also why loads matter as much as concentrations in many management settings. Concentration indicates condition at a point; load reflects transport through the system over time. Monitoring becomes most powerful when it can support both: point condition and system movement.
| Component | Monitoring Question | Evidence Needed | Interpretive Risk |
|---|---|---|---|
| Source | Where might the constituent or condition originate? | Land use, discharge records, industrial history, agriculture, wastewater, geology, septic density. | Attribution is made from concentration alone. |
| Pathway | How does the pollutant or condition move through the system? | Flow, runoff, groundwater, drainage infrastructure, channel transport, residence time. | Transport timing and transformation are ignored. |
| Receptor | Who or what is affected? | Drinking-water intake, aquatic habitat, recreation area, irrigation use, downstream community, species sensitivity. | Hazard is discussed without exposure or ecological consequence. |
| Event context | When does risk intensify? | Storm, low flow, snowmelt, treatment disruption, discharge event, bloom season. | Routine samples miss the period of greatest concern. |
| Assessment logic | What judgment follows from the evidence? | Standard, criterion, advisory rule, operational threshold, ecological benchmark. | Data are presented without decision relevance. |
Source–pathway–receptor logic turns water-quality monitoring from parameter surveillance into aquatic diagnosis. It connects values to causes, movement, exposure, and responsibility.
Governance, Standards, and Monitoring Capacity
Water quality monitoring is deeply shaped by governance because water condition becomes actionable only when linked to standards, criteria, regulatory programs, treatment requirements, advisories, public-health protections, or policy goals. Standards for human health, aquatic life, recreation, nutrient condition, or drinking-water safety provide the interpretive frameworks through which observations become judgments about impairment, compliance, risk, or necessary intervention. EPA’s water-quality criteria and standards framework is one of the clearest examples of this link between measurement and governance.
This governance dimension also means monitoring capacity is uneven. Not all jurisdictions have the same laboratory infrastructure, sensor coverage, trained personnel, field protocols, telemetry systems, data-management capacity, or enforcement authority. Weak monitoring is therefore often not just a technical gap, but a governance gap. Where capacity is limited, pollution may remain under-characterized, episodic risks may go undetected, and restoration or enforcement may lack evidentiary support. UNEP’s GEMS/Water programme is especially important in this context because it supports countries in collecting, analyzing, and sharing water-quality data for status and trend assessment.
The ability to monitor water well is thus itself a component of institutional competence. It shapes what forms of degradation become visible, which problems are prioritized, and whether water governance can operate on evidence rather than assumption.
| Governance Responsibility | Question | Evidence |
|---|---|---|
| Parameter governance | Who decides what variables are monitored and why? | Parameter rationale, risk assessment, designated-use statement, public priority record |
| Method governance | Which field and laboratory methods are valid for the decision? | Method registry, detection limits, validation record, QA/QC policy |
| Threshold governance | Which standards, criteria, advisories, or operational thresholds apply? | Assessment matrix, threshold registry, standard source, revision history |
| Data-quality governance | How are calibration, drift, blanks, duplicates, missingness, and flagged data handled? | Calibration log, QA/QC table, review rules, data-quality flags |
| Capacity governance | Does the monitoring program have sufficient staff, lab access, equipment, and data systems? | Capacity plan, training record, laboratory agreement, maintenance budget |
| Public accountability | Can water-quality claims be inspected, contested, and revised? | Public evidence package, caveat statement, data portal, governance log |
| Equity governance | Are vulnerable, historically under-monitored, or high-exposure communities adequately represented? | Coverage audit, environmental justice review, monitoring-priority rationale |
Water quality monitoring becomes trustworthy when governance connects method, standard, capacity, transparency, and public responsibility. Without governance, monitoring can produce numbers without accountability.
Future Directions
The future of water quality monitoring lies in deeper integration across continuous sensing, laboratory methods, telemetry, hydrological data, ecological assessment, watershed models, public-health systems, and interoperable data platforms. Real-time systems are expanding operational awareness for treatment, advisories, and event detection, while broader monitoring frameworks increasingly connect ambient water quality to watershed management, public health, sustainability reporting, and global environmental assessment.
Artificial intelligence, high-frequency sensing, lower-cost field devices, optical surrogates, satellite and drone observations, networked data platforms, source-tracking methods, microbial analytics, non-target chemical screening, and integrated watershed models will likely expand the ability to detect patterns that older monitoring systems missed. But these tools will also make governance and QA/QC more important. If algorithms infer water-quality condition from proxies, remote products, or partial sensor streams, the system must preserve metadata, calibration, method limits, uncertainty, and validation records. More advanced analytics do not eliminate the need for method discipline; they make method discipline more visible and more consequential.
The deeper challenge is not simply to collect more measurements. It is to build monitoring systems that are representative, trustworthy, and decision-relevant under conditions of variability, diffuse pollution, unequal capacity, and changing climate. Future systems will need stronger coupling between quality and hydrology, better event-based sampling strategies, more explicit handling of proxy-versus-direct measurement, improved metadata and QA/QC discipline, stronger public evidence packages, and clearer integration across environmental, regulatory, and public-health purposes.
Water quality is never simply “seen” without an observational system. Aquatic degradation is often episodic, diffuse, delayed, or chemically invisible, which means it can remain politically and institutionally hidden unless monitoring makes it legible. Where monitoring is strong, pollution becomes more governable, treatment and restoration more realistic, and environmental claims more testable. Where monitoring is weak, uncertainty often protects degradation rather than the public. In that sense, water quality monitoring systems are not merely technical programs. They are infrastructures of aquatic accountability.
Deployment Readiness Gate
Before a water quality monitoring system is used for public-health protection, aquatic-life assessment, regulatory compliance, recreational advisories, treatment operations, restoration evaluation, source-water protection, wastewater review, public reporting, or sustainability claims, it should pass a deployment readiness gate. This gate should test whether the system is representative, methodologically valid, hydrologically contextualized, quality-assured, threshold-aligned, and governance-ready.
| Readiness Area | Required Question | Pass Evidence |
|---|---|---|
| Purpose readiness | Does the system define waterbody type, use, risk question, decision context, and parameter rationale? | Monitoring objective manifest, use statement, parameter rationale |
| Site readiness | Are sites, depths, locations, and hydrological settings representative of the intended claim? | Site registry, sampling design, representativeness audit |
| Method readiness | Are sensors, grab samples, composite samples, biological protocols, or lab methods fit for purpose? | Method registry, lab method table, valid-use statement |
| QA/QC readiness | Are calibration, drift, fouling, blanks, duplicates, detection limits, and review flags handled? | QA/QC policy, calibration log, blank/duplicate records, data-quality flags |
| Hydrological readiness | Are flow, stage, runoff, event timing, dilution, residence time, or load context recorded where needed? | Flow linkage table, event flags, load-estimation method |
| Laboratory readiness | Are analytical specificity, detection limits, preservation, chain of custody, and turnaround appropriate? | Laboratory agreement, chain-of-custody form, method detection limit table |
| Assessment readiness | Are standards, criteria, advisories, operational thresholds, or ecological benchmarks defined? | Assessment matrix, threshold registry, standard source, revision history |
| Interoperability readiness | Can data be combined with hydrology, site metadata, laboratory records, and public reporting systems? | Schema, data dictionary, API/export format, metadata rules |
| Governance readiness | Are caveats, public evidence, capacity limits, equity, access, and revision responsibilities documented? | Governance log, public evidence package, capacity review, coverage audit |
This readiness gate prevents water quality monitoring from being treated as complete merely because measurements exist. The stronger standard is whether the system can support credible aquatic judgment and accountable action.
Data and Configuration Artifacts
A reproducible water-quality monitoring workflow should include explicit artifacts for objectives, sites, parameters, methods, sensors, samples, laboratory results, QA/QC, hydrological context, thresholds, assessment outputs, and governance. These artifacts make water-quality conclusions auditable rather than hidden inside spreadsheets, dashboards, laboratory PDFs, or informal field notes.
| Artifact | Purpose | Suggested Path |
|---|---|---|
| Water quality objective manifest | Defines waterbody type, monitoring purpose, parameter set, use, decision context, and evidence standard. | config/water_quality_objective.yml |
| Site and station registry | Stores site ID, coordinates, waterbody type, depth, watershed position, agency, and use context. | data/site_station_registry.csv |
| Parameter and method registry | Documents parameters, units, method type, detection limits, sensor/lab status, and valid-use limits. | data/parameter_method_registry.csv |
| Sensor calibration and maintenance log | Tracks calibration, deployment, fouling, drift, standard checks, and maintenance events. | data/sensor_calibration_log.csv |
| Sampling event log | Records grab, composite, autosampler, microbial, biological, and laboratory sampling events. | data/sampling_event_log.csv |
| Laboratory results table | Stores analyte results, detection limits, method codes, qualifiers, and QA/QC flags. | data/laboratory_results.csv |
| Hydrological and load linkage | Pairs quality observations with flow, stage, runoff condition, event flag, and load calculations. | data/hydrology_load_linkage.csv |
| Assessment threshold registry | Documents standards, criteria, advisory levels, operational thresholds, and valid-use context. | data/assessment_threshold_registry.csv |
| Readiness and evidence-quality scores | Assesses representativeness, analytical validity, QA/QC, hydrological context, load readiness, and governance. | data/water_quality_monitoring_readiness_scores.csv |
| Governance and public evidence log | Tracks caveats, public claims, standards updates, capacity limits, and accountability decisions. | data/water_quality_governance_log.csv |
These artifacts turn water quality monitoring into a reproducible aquatic evidence system rather than a loose collection of readings, samples, methods, and public claims.
Mathematical Lens: Concentration, Load, Exposure, Standards, and Evidence Quality
Several simple metrics can help evaluate water-quality monitoring readiness. These metrics are not substitutes for laboratory science, toxicology, hydrology, ecological assessment, public-health judgment, or regulatory interpretation, but they make monitoring evidence quality more inspectable.
L(t) = C(t)Q(t)
\]
Interpretation: Instantaneous load is concentration multiplied by discharge. This helps distinguish a point value from transported mass.
L_{\mathrm{event}} = \int_{t_0}^{t_1} C(t)Q(t)\,dt
\]
Interpretation: Event load estimates total transported mass across a storm, pulse, low-flow episode, discharge event, or treatment-relevant interval.
R_{\mathrm{exceedance}} = \frac{N_{\mathrm{exceedances}}}{N_{\mathrm{valid\ observations}}}
\]
Interpretation: Exceedance ratio summarizes how often valid observations exceed a threshold, criterion, or operational limit.
E_{\mathrm{exposure}} = C \times T \times F
\]
Interpretation: A simplified exposure expression depends on concentration, duration, and frequency of contact. Real public-health and ecological assessments require parameter-specific methods.
Q_{\mathrm{water\ quality\ evidence}} =
w_1S_m +
w_2A_v +
w_3H_c +
w_4Q_c +
w_5L_r +
w_6T_a +
w_7U_c +
w_8D_i +
w_9G_r
\]
Interpretation: Water-quality evidence quality depends on sampling representativeness, analytical validity, hydrological context, QA/QC completeness, load readiness, threshold alignment, uncertainty communication, data interoperability, and governance readiness.
These measures evaluate water quality monitoring as an evidence system. They ask whether observations are representative, valid, contextualized, quality-assured, decision-linked, and accountable enough to support the claim being made.
Python Workflow: Water Quality Monitoring Readiness and Evidence Quality
A Python workflow can demonstrate how water quality monitoring programs might be evaluated for sampling representativeness, analytical validity, hydrological context, QA/QC completeness, load readiness, threshold alignment, uncertainty communication, data interoperability, and governance readiness. The purpose is not to create a universal score, but to make evidence-quality dimensions visible.
from dataclasses import dataclass
from typing import List
import pandas as pd

@dataclass
class WaterQualityMonitoringProgram:
    program_id: str
    waterbody_type: str
    decision_use: str
    sampling_representativeness: float
    analytical_validity: float
    hydrological_context: float
    qaqc_completeness: float
    load_readiness: float
    threshold_alignment: float
    uncertainty_communication: float
    data_interoperability: float
    governance_readiness: float
    high_stakes_use: bool

def water_quality_evidence_score(program: WaterQualityMonitoringProgram) -> float:
    return (
        0.13 * program.sampling_representativeness +
        0.13 * program.analytical_validity +
        0.12 * program.hydrological_context +
        0.13 * program.qaqc_completeness +
        0.11 * program.load_readiness +
        0.11 * program.threshold_alignment +
        0.09 * program.uncertainty_communication +
        0.09 * program.data_interoperability +
        0.09 * program.governance_readiness
    )

def classify_review_priority(program: WaterQualityMonitoringProgram, score: float) -> str:
    if program.high_stakes_use and program.analytical_validity < 0.75:
        return "high_stakes_analytical_validity_review"
    if program.sampling_representativeness < 0.70:
        return "sampling_representativeness_review"
    if program.hydrological_context < 0.70:
        return "hydrological_context_review"
    if program.qaqc_completeness < 0.75:
        return "qaqc_completeness_review"
    if program.load_readiness < 0.70:
        return "load_readiness_review"
    if program.threshold_alignment < 0.75:
        return "threshold_alignment_review"
    if program.uncertainty_communication < 0.75:
        return "uncertainty_communication_review"
    if program.data_interoperability < 0.75:
        return "data_interoperability_review"
    if program.governance_readiness < 0.75:
        return "governance_readiness_review"
    if score < 0.75:
        return "water_quality_evidence_review"
    return "routine_monitoring"

programs: List[WaterQualityMonitoringProgram] = [
    WaterQualityMonitoringProgram(
        "ambient-river-quality-network",
        "river",
        "ambient_condition_and_trends",
        0.78,
        0.84,
        0.82,
        0.88,
        0.76,
        0.80,
        0.78,
        0.82,
        0.80,
        True,
    ),
    WaterQualityMonitoringProgram(
        "storm-event-nutrient-program",
        "watershed",
        "event_load_estimation",
        0.72,
        0.82,
        0.86,
        0.80,
        0.68,
        0.76,
        0.74,
        0.72,
        0.76,
        True,
    ),
    WaterQualityMonitoringProgram(
        "recreational-microbial-advisory",
        "recreational_water",
        "public_health_advisory",
        0.70,
        0.78,
        0.66,
        0.82,
        0.52,
        0.84,
        0.76,
        0.74,
        0.78,
        True,
    ),
    WaterQualityMonitoringProgram(
        "continuous-source-water-sensors",
        "source_water",
        "treatment_operations",
        0.76,
        0.74,
        0.80,
        0.70,
        0.62,
        0.72,
        0.70,
        0.78,
        0.76,
        True,
    ),
]

records = []
for program in programs:
    score = water_quality_evidence_score(program)
    records.append({
        "program_id": program.program_id,
        "waterbody_type": program.waterbody_type,
        "decision_use": program.decision_use,
        "sampling_representativeness": program.sampling_representativeness,
        "analytical_validity": program.analytical_validity,
        "hydrological_context": program.hydrological_context,
        "qaqc_completeness": program.qaqc_completeness,
        "load_readiness": program.load_readiness,
        "threshold_alignment": program.threshold_alignment,
        "uncertainty_communication": program.uncertainty_communication,
        "data_interoperability": program.data_interoperability,
        "governance_readiness": program.governance_readiness,
        "water_quality_evidence_score": round(score, 3),
        "review_priority": classify_review_priority(program, score),
    })

df = pd.DataFrame(records)
print(df.sort_values(["review_priority", "water_quality_evidence_score"]))
This workflow treats water quality monitoring programs as evidence systems. A program is not ready merely because it measures parameters. It must preserve enough evidence about representativeness, analytical validity, hydrology, QA/QC, load readiness, standards, uncertainty, interoperability, and governance to support the intended claim.
R Workflow: Monitoring Review, Load Summary, and Governance Readiness
An R workflow can support monitoring-program governance by summarizing readiness across ambient water, event-load, recreational-water, and source-water contexts. This is useful for program audits, public evidence packages, laboratory coordination, watershed planning, and monitoring redesign.
library(dplyr)
library(readr)

water_quality_programs <- tribble(
  ~program_id, ~waterbody_type, ~decision_use, ~sampling_representativeness, ~analytical_validity, ~hydrological_context, ~qaqc_completeness, ~load_readiness, ~threshold_alignment, ~uncertainty_communication, ~data_interoperability, ~governance_readiness, ~high_stakes_use,
  "ambient-river-quality-network", "river", "ambient_condition_and_trends", 0.78, 0.84, 0.82, 0.88, 0.76, 0.80, 0.78, 0.82, 0.80, TRUE,
  "storm-event-nutrient-program", "watershed", "event_load_estimation", 0.72, 0.82, 0.86, 0.80, 0.68, 0.76, 0.74, 0.72, 0.76, TRUE,
  "recreational-microbial-advisory", "recreational_water", "public_health_advisory", 0.70, 0.78, 0.66, 0.82, 0.52, 0.84, 0.76, 0.74, 0.78, TRUE,
  "continuous-source-water-sensors", "source_water", "treatment_operations", 0.76, 0.74, 0.80, 0.70, 0.62, 0.72, 0.70, 0.78, 0.76, TRUE
)

water_quality_summary <- water_quality_programs %>%
  mutate(
    water_quality_evidence_score = round(
      0.13 * sampling_representativeness +
      0.13 * analytical_validity +
      0.12 * hydrological_context +
      0.13 * qaqc_completeness +
      0.11 * load_readiness +
      0.11 * threshold_alignment +
      0.09 * uncertainty_communication +
      0.09 * data_interoperability +
      0.09 * governance_readiness,
      3
    ),
    review_priority = case_when(
      high_stakes_use & analytical_validity < 0.75 ~ "high_stakes_analytical_validity_review",
      sampling_representativeness < 0.70 ~ "sampling_representativeness_review",
      hydrological_context < 0.70 ~ "hydrological_context_review",
      qaqc_completeness < 0.75 ~ "qaqc_completeness_review",
      load_readiness < 0.70 ~ "load_readiness_review",
      threshold_alignment < 0.75 ~ "threshold_alignment_review",
      uncertainty_communication < 0.75 ~ "uncertainty_communication_review",
      data_interoperability < 0.75 ~ "data_interoperability_review",
      governance_readiness < 0.75 ~ "governance_readiness_review",
      water_quality_evidence_score < 0.75 ~ "water_quality_evidence_review", TRUE ~ "routine_monitoring" ) ) %>%
  arrange(review_priority, water_quality_evidence_score)

print(water_quality_summary)

write_csv(
  water_quality_summary,
  "outputs/water_quality_monitoring_readiness_summary.csv"
)
The R workflow emphasizes that water-quality review should account for sampling representativeness, analytical validity, hydrological context, QA/QC completeness, load readiness, threshold alignment, uncertainty communication, data interoperability, and governance. These dimensions help prevent monitoring systems from being judged by parameter count alone.
Systems Code: Sensors, Samples, QA/QC, Loads, Alerts, and Governance Logs
Water quality monitoring depends on full-stack environmental data systems. The stack includes site registries, sensor inventories, calibration logs, field records, sampling events, chain-of-custody records, laboratory results, detection limits, QA/QC flags, hydrological links, load calculations, assessment thresholds, public advisories, dashboards, data-sharing interfaces, and governance logs. A serious companion repository should therefore include both analytical workflows and systems-code scaffolding.
| Language / Tool | Role in Companion Repository | Example Use |
|---|---|---|
| Python | Readiness scoring, QA/QC triage, load calculations, threshold review, and evidence-quality summaries | Monitoring-program audit and review prioritization |
| R | Monitoring-program summaries, public evidence tables, trend preparation, and load reporting | Reporting-ready monitoring summaries and governance outputs |
| SQL | Site registries, parameter methods, sampling events, lab results, QA/QC flags, thresholds, and governance logs | Auditable water-quality monitoring database schema |
| GeoJSON | Sampling sites, water bodies, intakes, discharge points, tributaries, and monitoring coverage | Spatial registry for water-quality monitoring networks |
| TypeScript | Dashboard and platform data models | Parameter cards, alert panels, QA/QC views, advisory status displays |
| Go | Lightweight monitoring-program status endpoint | Expose sensor, lab, QA/QC, threshold, and governance readiness |
| Rust | Safe validation CLI for observations, samples, and lab records | Validate required fields, units, timestamps, method codes, and quality flags |
| C / C++ | Low-level sensor-record and event-queue examples | Demonstrate embedded sensor records and bounded alert/event buffers |
| Shell scripts | Reproducible directory, validation, and export workflows | One-command scaffold validation and output generation |
This breadth is appropriate because water quality monitoring is not only field sampling or laboratory analysis. It is evidence infrastructure spanning sensors, samples, methods, hydrology, analytics, standards, communication, and public accountability.
GitHub Repository
A companion repository for this article should translate the water-quality monitoring framework into reproducible technical scaffolding. The repository should include monitoring objective manifests, site registries, parameter and method tables, sensor calibration logs, sampling events, laboratory results, QA/QC policies, hydrological and load linkages, assessment threshold registries, readiness scoring workflows, SQL schemas, dashboard data types, and governance logs.
Testing and Validation
Testing water quality monitoring systems requires more than confirming that values are present in a dataset. It requires validating site metadata, parameter definitions, units, sensor calibration, laboratory method, detection limits, sample handling, hydrological context, QA/QC flags, threshold linkage, representativeness, and governance documentation. A system can appear scientifically precise while producing weak public evidence if the method chain is incomplete.
| Test Type | Purpose | Example Test |
|---|---|---|
| Site metadata test | Ensure location, waterbody type, depth, watershed position, and use context are documented. | Validate site registry fields and geospatial coordinates. |
| Parameter and unit test | Ensure variables are defined consistently and units are not mixed. | Check parameter registry and unit conversions. |
| Calibration test | Ensure sensors and field meters were calibrated and checked for drift or fouling. | Review calibration logs and deployment records. |
| Laboratory method test | Ensure analyte results have method codes, detection limits, qualifiers, and chain-of-custody records. | Validate lab result metadata and sample handling records. |
| QA/QC test | Ensure blanks, duplicates, control samples, outliers, and flagged values are handled properly. | Review QA/QC flags and exclusion rules. |
| Hydrological context test | Ensure quality observations are paired with flow, stage, event status, or sampling condition where needed. | Join quality records to hydrology/load linkage table. |
| Load-estimation test | Ensure concentration and discharge are paired appropriately for transported-mass claims. | Audit sample-flow alignment and event interpolation assumptions. |
| Threshold alignment test | Ensure standards, criteria, advisories, or operational thresholds match the decision context. | Review assessment threshold registry and valid-use notes. |
| Representativeness test | Ensure site, time, depth, method, and hydrological condition support the intended claim. | Audit sampling design against waterbody, exposure, and event dynamics. |
| Governance test | Ensure public claims expose methods, uncertainty, caveats, and accountability owners. | Review public evidence package and governance log. |
Validation should test the water quality monitoring system as an aquatic evidence chain. The decisive question is not whether a value exists, but whether the value can support the judgment being made from it.
Operational Signals and Water-Quality Monitoring Observability
Water quality monitoring systems must observe themselves. A system that monitors water but cannot report sensor health, calibration status, sample status, laboratory method status, detection-limit metadata, QA/QC flags, hydrological context, telemetry completeness, threshold linkage, and public caveats is operationally fragile. Monitoring-system observability should track both technical workflow health and evidence health.
| Signal | Why It Matters | Failure Indicator |
|---|---|---|
| Sensor health | Determines whether field readings remain current, calibrated, and plausible. | Drift, fouling, flatline, missing deployment check, stale telemetry. |
| Calibration status | Determines whether continuous measurements can be trusted. | Expired calibration, failed standard check, undocumented post-deployment check. |
| Sample status | Determines whether samples were collected, preserved, transported, and processed properly. | Missing chain of custody, expired holding time, incomplete preservation metadata. |
| Laboratory method status | Determines whether analyte results are method-controlled and comparable. | Missing method code, detection limit, qualifier, or lab QA/QC note. |
| QA/QC flag status | Determines whether values are validated, provisional, suspect, or excluded. | Unflagged outliers, missing duplicates, blank contamination, unexplained anomalies. |
| Hydrological context status | Determines whether values can be interpreted against flow, runoff, dilution, or load. | Quality record has no flow, stage, event, or sampling-condition context. |
| Threshold linkage status | Determines whether values can support assessment or advisory decisions. | No valid-use threshold, standard source, or decision rule. |
| Public evidence readiness | Determines whether monitoring claims can be interpreted and contested. | No method note, no uncertainty statement, no caveat, no governance owner. |
Operational observability protects water-quality monitoring from silent evidence degradation. It helps ensure that public trust does not outlast the quality and accountability of the monitoring system beneath it.
Engineer and Researcher Checklist
- Define the waterbody type, designated use, decision purpose, risk question, and parameter rationale before collecting data.
- Distinguish ambient monitoring, drinking-water surveillance, wastewater compliance, recreational advisories, ecological assessment, and treatment-process monitoring.
- Document site location, depth, waterbody type, watershed position, sampling method, parameter, unit, method code, and quality flag.
- Pair water-quality results with flow, stage, runoff condition, event status, season, or operational context where interpretation requires it.
- Distinguish direct measurements from proxies and validate proxy relationships with confirmatory samples.
- Use continuous sensors for temporal visibility and laboratory methods for specificity, detection limits, microbial confirmation, and regulated analytes.
- Maintain calibration, fouling, drift, blanks, duplicates, chain-of-custody, detection-limit, and QA/QC records.
- Use event-triggered sampling where storms, first flush, algal episodes, low-flow concentration, or contamination pulses matter.
- Separate concentration claims from load, transport, exposure, and ecological consequence claims.
- Maintain assessment threshold registries that distinguish standards, criteria, advisories, operational thresholds, and ecological benchmarks.
- Audit under-monitored communities, water bodies, exposure pathways, tributaries, and contamination sources.
- Provide public evidence packages that explain methods, uncertainty, valid-use limits, capacity constraints, and governance owners.
Where This Fits in the Series
This article connects Environmental Monitoring Systems to river and watershed monitoring, smart water systems, flood monitoring, soil monitoring, environmental data platforms, monitoring dashboards, risk and resilience, public-health surveillance, and aquatic ecosystem stewardship. It sits at the aquatic evidence layer of the series: the point where field sensing, sampling, laboratory analysis, hydrology, standards, and governance become a shared infrastructure for water accountability.
Within the broader series, this article provides the water-quality framework that supports river and watershed monitoring networks, flood monitoring systems and hydrological risk detection, smart water systems and environmental sensing, soil monitoring systems and agricultural sensing, environmental data platforms and decision support systems, environmental analytics and monitoring dashboards, monitoring environmental risk and resilience, IoT architectures for environmental monitoring, edge computing in environmental monitoring, and embedded monitoring devices for field observation. Its role is to show that water-quality intelligence does not emerge from measurement alone. It emerges from the relationship among method, representativeness, hydrology, QA/QC, standards, interpretation, and governance.
Related articles
- Environmental Monitoring Systems
- River and Watershed Monitoring Networks
- Flood Monitoring Systems and Hydrological Risk Detection
- Smart Water Systems and Environmental Sensing
- Soil Monitoring Systems and Agricultural Sensing
- Environmental Data Platforms and Decision Support Systems
- Environmental Analytics and Monitoring Dashboards
- Monitoring Environmental Risk and Resilience
- IoT Architectures for Environmental Monitoring
- Edge Computing in Environmental Monitoring
Further reading
- U.S. Environmental Protection Agency (2026) Water Quality Criteria. Available at: https://www.epa.gov/wqc
- U.S. Environmental Protection Agency (2026) Water Quality Standards: Regulations and Resources. Available at: https://www.epa.gov/wqs-tech
- U.S. Environmental Protection Agency (2026) Basic Information on Water Quality Criteria. Available at: https://www.epa.gov/wqc/basic-information-water-quality-criteria
- U.S. Environmental Protection Agency (2026) National Recommended Water Quality Criteria: Aquatic Life Criteria Table. Available at: https://www.epa.gov/wqc/national-recommended-water-quality-criteria-aquatic-life-criteria-table
- U.S. Environmental Protection Agency (2026) Drinking Water Regulations. Available at: https://www.epa.gov/dwreginfo/drinking-water-regulations
- U.S. Geological Survey (2026) National Water Quality Program. Available at: https://www.usgs.gov/programs/national-water-quality-program
- U.S. Geological Survey (2026) National Real-Time Water Quality. Available at: https://nrtwq.usgs.gov/
- U.S. Geological Survey (2023) Use of Multiparameter Instruments for Routine Field Measurements. Available at: https://pubs.usgs.gov/publication/tm9A6.8/full
- Water Quality Portal (2026) Water Quality Data Home. Available at: https://www.waterqualitydata.us/
- World Health Organization (2026) Drinking-water quality guidelines. Available at: https://www.who.int/teams/environment-climate-change-and-health/water-sanitation-and-health/water-safety-and-quality/drinking-water-quality-guidelines
- World Health Organization (2022) Guidelines for Drinking-water Quality: Fourth Edition Incorporating the First and Second Addenda. Available at: https://www.who.int/publications/i/item/9789240045064
- United Nations Environment Programme (2026) Monitoring Water Quality. Available at: https://www.unep.org/topics/fresh-water/water-quality/monitoring-water-quality
- United Nations Environment Programme (2025) GEMS/Water. Available at: https://www.unep.org/topics/environment-under-review/gemswater
- GEMStat (2026) The Global Freshwater Quality Database. Available at: https://gemstat.org/
References
- GEMStat (2026) The Global Freshwater Quality Database. Available at: https://gemstat.org/ (Accessed: 14 May 2026).
- U.S. Environmental Protection Agency (2026) Basic Information on Water Quality Criteria. Available at: https://www.epa.gov/wqc/basic-information-water-quality-criteria (Accessed: 14 May 2026).
- U.S. Environmental Protection Agency (2026) Drinking Water Regulations. Available at: https://www.epa.gov/dwreginfo/drinking-water-regulations (Accessed: 14 May 2026).
- U.S. Environmental Protection Agency (2026) National Recommended Water Quality Criteria: Aquatic Life Criteria Table. Available at: https://www.epa.gov/wqc/national-recommended-water-quality-criteria-aquatic-life-criteria-table (Accessed: 14 May 2026).
- U.S. Environmental Protection Agency (2026) Water Quality Criteria. Available at: https://www.epa.gov/wqc (Accessed: 14 May 2026).
- U.S. Environmental Protection Agency (2026) Water Quality Standards: Regulations and Resources. Available at: https://www.epa.gov/wqs-tech (Accessed: 14 May 2026).
- U.S. Geological Survey (2023) Use of Multiparameter Instruments for Routine Field Measurements. Available at: https://pubs.usgs.gov/publication/tm9A6.8/full (Accessed: 14 May 2026).
- U.S. Geological Survey (2026) National Real-Time Water Quality. Available at: https://nrtwq.usgs.gov/ (Accessed: 14 May 2026).
- U.S. Geological Survey (2026) National Water Quality Program. Available at: https://www.usgs.gov/programs/national-water-quality-program (Accessed: 14 May 2026).
- United Nations Environment Programme (2025) GEMS/Water. Available at: https://www.unep.org/topics/environment-under-review/gemswater (Accessed: 14 May 2026).
- United Nations Environment Programme (2026) Monitoring Water Quality. Available at: https://www.unep.org/topics/fresh-water/water-quality/monitoring-water-quality (Accessed: 14 May 2026).
- Water Quality Portal (2026) Water Quality Data Home. Available at: https://www.waterqualitydata.us/ (Accessed: 14 May 2026).
- World Health Organization (2022) Guidelines for Drinking-water Quality: Fourth Edition Incorporating the First and Second Addenda. Available at: https://www.who.int/publications/i/item/9789240045064 (Accessed: 14 May 2026).
- World Health Organization (2026) Drinking-water quality guidelines. Available at: https://www.who.int/teams/environment-climate-change-and-health/water-sanitation-and-health/water-safety-and-quality/drinking-water-quality-guidelines (Accessed: 14 May 2026).