
Last Updated May 28, 2026
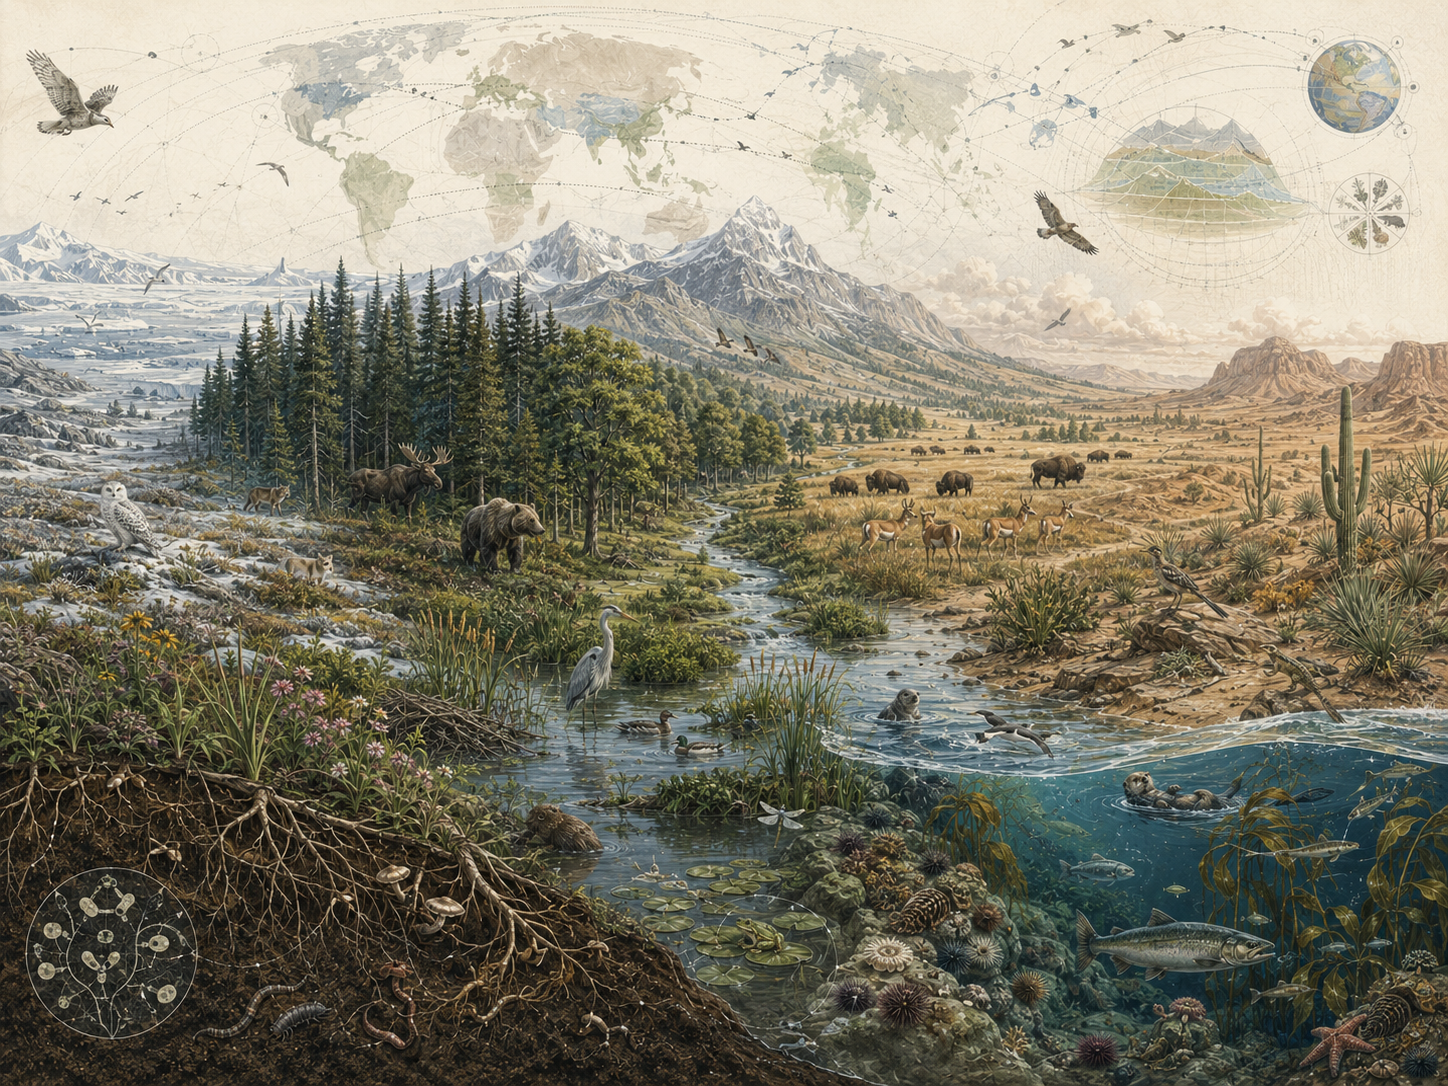
Biomes, habitats, and the geography of life examine how climate, water, seasonality, soils, disturbance, evolutionary history, dispersal, isolation, and human transformation shape the uneven distribution of living systems across Earth. Life is not spread across the planet in a uniform or accidental way. It is organized into broad ecological formations, regional biotas, local habitats, and fine-grained environmental mosaics that reflect both present-day conditions and deep historical processes. Forests, deserts, grasslands, tundra, reefs, estuaries, wetlands, river systems, mountain zones, island systems, and shelf seas are not simply scenic backdrops for organisms. They are structured settings in which ecological possibility is constrained, diversified, filtered, and historically assembled.
The geography of life is therefore one of biology’s central organizing problems. It asks why species occur where they do, why biodiversity concentrates in some regions and not others, why similar climates may contain different lineages, why islands and mountains generate endemism, why freshwater and marine systems follow different spatial logics, and why habitat fragmentation can disrupt ecological persistence even when some land cover remains. Biomes and habitats are not static labels. They are spatial expressions of climate, water, substrate, disturbance, evolutionary history, ecological interaction, and human land-use change.
Main Library
Publications
Article Map
Biology
Related Topic
Environmental Science
Related Topic
Earth Science
Related Topic
Geography
The article is written for ecologists, marine biologists, freshwater scientists, medical and environmental-health readers, computational biology readers, biodiversity experts, restoration practitioners, conservation planners, and research biologists who need a spatially explicit frame for linking habitat, biodiversity, Earth-system structure, and changing environmental conditions.
The article also extends biogeography into quantitative and computational biology through habitat-suitability functions, species-area relationships, distance-decay models, species distribution modeling, spatial prioritization, habitat-fragmentation scenarios, R workflows, Python workflows, SQL provenance structures, and a linked full-stack GitHub repository containing Python, R, Julia, Fortran, Rust, Go, C, C++, SQL, notebooks, data files, and reproducibility documentation.
What biomes and habitats are
A biome is a broad ecological formation shaped by recurring combinations of climate, vegetation, soils, water balance, disturbance, and associated life forms across large areas. Biomes are useful because they allow ecologists to recognize large-scale regularities in the biosphere. Tropical forests, temperate forests, grasslands, deserts, tundra, boreal systems, Mediterranean shrublands, savannas, wetlands, freshwater systems, and major marine realms differ from one another in systematic ways, and those differences are not merely descriptive. They reflect environmental structure, historical contingency, and long-term ecological filtering.
A habitat is more immediate and more local. It is the setting in which an organism, population, or community actually lives. Habitats are defined by the physical and biological conditions that make persistence possible: moisture, shelter, substrate, salinity, light, temperature, oxygen, food supply, structural complexity, disturbance regime, and biotic interaction. Within a single biome, many habitats may coexist. A temperate forest may contain streams, canopy gaps, floodplains, coarse woody debris, litter layers, wetlands, understory thickets, rocky outcrops, and soil microhabitats, each supporting distinct ecological assemblages.
This distinction matters because biome and habitat answer different kinds of questions. Biome helps explain broad planetary pattern. Habitat helps explain actual occupancy, persistence, and interaction at the scale where organisms meet their environment. A biome may describe the regional ecological formation; a habitat explains why a species occurs in one valley, reef patch, stream reach, forest gap, or tidal zone and not another.
For research biologists, this is one of the first principles of spatial ecology: life is structured at multiple scales simultaneously. A species may belong to a biome, occupy a habitat, depend on microhabitats, move through corridors, and respond to regional climate at the same time.
The geography of life as an ecological problem
The geography of life is one of ecology’s central problems because biological diversity is spatially structured. Species richness, endemism, productivity, community composition, trophic organization, ecological function, and evolutionary novelty vary across gradients of temperature, moisture, seasonality, elevation, area, isolation, nutrient supply, salinity, depth, substrate, and disturbance. The question is not only why organisms occur where they do, but why particular forms of life recur in some settings and not others, why similar climates sometimes support different biotas, and why spatial separation so often produces ecological and evolutionary divergence.
This is why biogeography belongs at the intersection of ecology, evolution, Earth science, and history. Climate matters, but so do barriers, dispersal limits, extinction, continental history, disturbance, species interactions, and the structure of habitat mosaics. Similar environments do not always contain the same organisms, and different environments do not always differ in simple or linear ways. The geography of life is therefore not reducible to climate matching alone.
At a deeper level, the spatial distribution of life also tells us something about the structure of ecological possibility itself. Some landscapes support high turnover across short distances. Some regions accumulate extraordinary endemic diversity. Some habitats function as refugia. Others act as corridors, filters, sinks, sources, stepping-stones, or transition zones. Geography does not merely contain ecology. It helps generate it.
This matters for conservation and restoration because spatial pattern often determines whether ecological recovery is possible. A degraded habitat near intact source populations may recover differently from an isolated remnant. A protected area embedded in a connected landscape may function differently from one surrounded by intensive land use. A freshwater species blocked by dams, culverts, or altered flow may be unable to track suitable habitat even if some habitat remains. The geography of life is therefore not only descriptive. It is predictive and practical.
Biomes as large-scale ecological formations
Biomes are large-scale expressions of ecological order. They emerge because climate and water balance strongly influence plant form, productivity, decomposition, disturbance regimes, and the temporal structure of biological activity. Forests are possible where moisture, soils, and disturbance permit sustained woody dominance. Deserts emerge where water limitation strongly constrains biomass. Grasslands often arise where intermediate moisture combines with fire, herbivory, or seasonal stress to prevent closed forest. Tundra reflects cold limitation, short growing seasons, wind exposure, frozen soils, and often the influence of permafrost.
Biome classifications simplify real ecological variation, but that simplification is often useful. It allows ecologists to identify recurring structural patterns in the biosphere and to compare analogous systems across continents. Biomes are therefore neither arbitrary labels nor exhaustive descriptions. They are large-scale summaries of how energy, water, seasonality, disturbance, and environmental constraint produce recurring ecological forms.
They are also dynamic. No biome is a frozen category. Fire regimes change. Rainfall shifts. Soils erode or develop. Herbivore pressure changes vegetation structure. Human land use fragments habitat mosaics. Climate change alters thermal and hydrological baselines. Invasive species alter disturbance and resource dynamics. Biomes remain useful precisely because they help scientists perceive transformation against a large-scale ecological background.
This is especially important in the Anthropocene, where potential natural vegetation, actual land cover, and ecological function may diverge sharply. A region climatically suitable for forest may be agricultural. A grassland may be altered by woody encroachment. A wetland may be drained but still restorable. A coastal biome may be compressed between sea-level rise and human infrastructure. Biome thinking remains necessary, but it must be joined to land-use history, disturbance ecology, and future climate trajectories.
Habitats and microhabitats
Habitats are often more operationally important than biome labels because organisms live in concrete local conditions, not in abstractions. A stream fish does not inhabit “temperate forest” in the abstract; it inhabits cool flowing water with appropriate substrate, oxygen, shelter, thermal regime, prey supply, and connectivity to upstream and downstream reaches. A pollinator may depend on a flowering mosaic, nesting substrate, and seasonal continuity of forage. A benthic invertebrate may depend on sediment grain size, organic content, salinity, oxygen, and hydrodynamic conditions. A forest amphibian may depend on leaf litter moisture, vernal pools, canopy cover, and predator-free breeding habitat.
Microhabitats refine this further. The underside of bark, the interstitial pore space of soils, a mangrove root mass, a seagrass patch, a decomposing log, a coral crevice, a shallow tidal pool, a moss mat, or a shaded seep may each function as a distinct ecological world. These fine-grained conditions often matter disproportionately for biodiversity, recruitment, shelter, predation risk, microbial metabolism, reproduction, and early life stages.
This is one reason why habitat degradation can be severe even where land cover appears superficially intact. Structural simplification, flow alteration, canopy thinning, substrate disturbance, salinity change, sedimentation, oxygen decline, chemical contamination, or loss of coarse woody debris may profoundly alter ecological function without producing an immediately obvious change on a coarse map. A forest can remain forest in a land-cover product while losing the old-growth structure needed by specialized species. A river can remain blue on a map while losing thermal refugia, flow pulses, or spawning substrate. A reef can remain physically present while losing living coral cover and recruitment.
Serious ecological analysis therefore has to move between biome-scale pattern and habitat-scale mechanism. The large-scale geography of life explains broad distributions, but habitat and microhabitat explain persistence.
Climate, water, and seasonality
Climate is one of the strongest determinants of large-scale ecological pattern because it influences temperature, precipitation, evapotranspiration, productivity, frost limitation, water stress, and the timing of biological activity. But climate does not act only through annual means. Ecological systems are shaped just as much by timing, variability, and recurrence. A strongly seasonal rainfall regime produces different ecological outcomes from a more even hydrological pattern. Snow storage and spring melt differ ecologically from year-round liquid water. Repeated drought, monsoon pulses, stratified summers, cold dormant winters, and flood-recession cycles each organize life differently.
Water is particularly important because it mediates both climate and habitat. It controls plant growth, salinity, freshwater persistence, wetland structure, estuarine transitions, oxygen conditions, disease ecology, sediment movement, and the movement of nutrients and organisms. The same nominal climate can produce very different ecological outcomes depending on drainage, storage, groundwater inputs, flooding regime, soil-water interactions, slope, geomorphology, and human water management.
For many systems, the relevant question is therefore not simply how much water exists, but when, where, in what form, and with what degree of variability. This is true in terrestrial, freshwater, and marine-connected environments alike. An ephemeral wetland, a snowmelt river, a monsoon forest, a Mediterranean shrubland, a coral lagoon, a tidal marsh, and a groundwater-fed spring each represent different forms of ecological time.
Climate and water also influence disease ecology and environmental health. Warmer temperatures may alter vector distributions. Drought may concentrate animals and humans near limited water sources. Flooding may mobilize contaminants or create mosquito habitat. Marine warming may shift harmful algal bloom risk. These effects show that the geography of life is not only about biodiversity patterns, but also about exposure, health, and ecological risk.
Soils, substrate, and disturbance
Climate does not determine ecological form by itself. Soils and substrates shape rooting depth, nutrient availability, moisture retention, salinity, pH, texture, drainage, organic matter, microbial conditions, and the physical structure available to organisms. Sandy soils, peatlands, alluvial floodplains, volcanic surfaces, limestone-derived systems, serpentine soils, clay-rich basins, rocky alpine slopes, coral rubble, kelp holdfasts, and sediment-dominated deltas may support very different ecological assemblages even under overlapping climatic conditions.
Substrate matters across realms. In freshwater systems, gravel, sand, silt, wood, macrophytes, and bedrock influence spawning, invertebrate communities, oxygen exchange, and flow structure. In marine systems, hard bottom, soft sediment, seagrass beds, coral frameworks, oyster reefs, mangrove roots, and kelp forests create distinct habitat conditions. In terrestrial systems, soil depth, texture, nutrient status, and microbial communities shape vegetation, decomposition, root systems, and water retention.
Disturbance is equally important. Fire, grazing, flood pulses, sediment transport, storms, frost, ice scour, drought, windthrow, volcanic activity, insect outbreaks, disease, and herbivory can structure ecological systems over long periods. In many cases, disturbance is not an exception to a stable ecological norm but part of the process that maintains the system. Grasslands, savannas, shrublands, floodplains, coastal marshes, deltas, and some forest systems are all strongly shaped by disturbance regimes.
This matters for scientific interpretation because static habitat categories can be misleading when they ignore regime dynamics. It matters just as much for applied work because management often fails when it attempts to preserve the appearance of a system while suppressing the processes that sustain it. A fire-adapted grassland without fire may become woody. A floodplain without floods may lose recruitment and nutrient renewal. A coastal marsh without sediment supply may drown. A forest without natural disturbance may shift structure and species composition. Habitat is therefore not only place; it is process through time.
Terrestrial, freshwater, marine, and coastal systems
The geography of life extends across multiple environmental realms, each with its own spatial logic. Terrestrial systems are often organized through vegetation structure, climate, soil formation, topography, and disturbance. Freshwater systems are shaped by flow, hydroperiod, watershed position, floodplain connection, nutrient supply, sediment, thermal regime, and oxygen conditions. Marine systems reflect depth, light penetration, circulation, salinity, substrate, oxygen, nutrient upwelling, thermal structure, and biogeographic separation across basins and coasts.
Coastal systems deserve special attention because they are transition zones rather than simple boundaries. Estuaries, mangroves, salt marshes, seagrass beds, deltas, intertidal flats, reefs, oyster beds, and continental shelf habitats connect land, freshwater, sediment, nutrient cycles, and marine processes in ways that generate especially high ecological complexity. Many of these systems also function as nurseries, migration corridors, filtration zones, storm buffers, carbon sinks, and sites of intense biogeochemical transformation.
A scientifically useful account of biomes and habitats therefore cannot treat terrestrial systems as the default model. Freshwater and marine spatial structure are not secondary cases. They are central to the geography of life. Rivers have longitudinal structure from headwaters to floodplains and estuaries. Lakes have depth, stratification, shoreline, and pelagic-benthic gradients. Oceans have vertical and horizontal structure shaped by light, pressure, temperature, circulation, nutrients, and seafloor form. Coastal ecosystems sit at the edge of multiple systems and often respond to changes from land and sea simultaneously.
For research biologists, the key lesson is that ecological space is not one thing. A hectare of forest, a kilometer of river, a coral reef patch, a coastal wetland, and a mountain slope are not interchangeable units. Each has a different spatial ecology.
Mountains, islands, and isolation
Mountains and islands make biogeography especially legible because they intensify gradients and isolate populations. Mountains compress ecological transitions across short distances, often producing strong turnover with elevation, climatic refugia, and highly localized endemism. Temperature, moisture, wind exposure, snowpack, soil depth, slope, and isolation can shift sharply across elevation. As a result, mountain systems can function as laboratories of adaptation, speciation, and climate sensitivity.
Islands, whether literal oceanic islands or island-like habitat fragments, emphasize the importance of area, colonization, extinction, and dispersal limitation. The classic insight of island biogeography remains influential because it formalized species richness as a dynamic outcome of immigration and extinction processes shaped by isolation and area. Small, isolated islands tend to hold fewer species than large, connected or less isolated ones, but they may also hold highly distinctive endemic lineages.
These settings are scientifically powerful because they show how geography becomes an active force in ecological and evolutionary differentiation. They also matter practically because they often concentrate rare species, vulnerability, and irreplaceable ecological structure. Small changes in connectivity, land use, temperature, invasive species pressure, fire regime, hydrology, or sea level can have disproportionate effects in such systems.
Mountains add an additional dimension by showing that climatic structure and habitat stacking can create island-like patterns over elevation rather than across oceans. A high-elevation species may be trapped on mountaintop “islands” as warming pushes suitable climate upward. A wetland remnant in a dry landscape may function as an ecological island. A forest patch in an agricultural matrix may behave like an island for dispersal-limited species. Biogeography therefore helps interpret not only natural islands but fragmented landscapes more broadly.
Biogeographic regions and endemism
Biogeographic regions reflect the fact that the distribution of life is historical as well as environmental. Continents drifted apart, seaways opened and closed, mountain systems rose, glaciations advanced and retreated, sea levels shifted, deserts expanded, rivers changed course, and lineages dispersed unevenly. As a result, present-day ecological similarity does not always imply common biotic composition. Comparable climates on different continents may host different lineages because those lineages arrived, diverged, persisted, or remained isolated in different ways.
Endemism is one of the clearest outcomes of this history. Species confined to isolated islands, ancient lakes, mountain ranges, caves, sky islands, unique soil systems, or long-separated landmasses reveal that geography is part of evolutionary explanation. Endemic species are often conservation priorities not because rarity is automatically valuable in a simple numerical sense, but because narrow distributions may represent unique evolutionary history and high vulnerability to disturbance.
This is one reason why regional biodiversity cannot be understood purely as a present-day response to climate and habitat structure. It also reflects deep time, lineage history, barriers to movement, and historical contingency. A tropical forest in South America, Africa, and Southeast Asia may share broad structural similarities while containing very different evolutionary lineages. A Mediterranean-climate shrubland in California, Chile, South Africa, Australia, or the Mediterranean Basin may show convergent ecological patterns while differing in biotic history.
For scientists working with biodiversity patterns, this means that spatial conservation cannot be reduced to generic area targets alone. The identity, history, and irreplaceability of what occupies a place matter.
Human remapping of the living world
The contemporary geography of life is increasingly shaped by sustained human transformation. Agriculture, urbanization, transport infrastructure, hydrological modification, extraction, forestry, coastal engineering, dam construction, fisheries, grazing, mining, pollution, fire suppression, invasive species movement, and managed landscapes have created a world in which many species now occupy remade ecological mosaics rather than comparatively intact biome systems. The living world is increasingly structured by fragmentation, simplification, edge effects, land-use intensity, altered disturbance, and novel combinations of habitats.
This does not mean that human-dominated landscapes are biologically empty. Many support important biodiversity, ecological function, cultural landscapes, agroecological systems, urban habitats, restoration corridors, and transitional habitat. But they change the terms of ecological persistence. Range limits, recruitment, dispersal, predation, disturbance, hydrology, nutrient flow, and disease exposure all become entangled with infrastructure and land use.
The concept of anthropogenic biomes is useful here because it recognizes that many terrestrial ecosystems are no longer adequately described by potential natural vegetation alone. Croplands, rangelands, villages, dense settlements, urban systems, managed forests, and mixed-use mosaics now shape the biosphere at large scales. The geography of life can no longer be described only as a map of natural biomes. It must also include the social, infrastructural, and economic systems that have reorganized habitat availability.
For conservation and restoration biology, this is a crucial shift. Protecting life now requires work within remapped systems: agricultural matrices, urban watersheds, fragmented forests, altered rivers, coastal infrastructure, working lands, and hybrid landscapes. The geography of life is no longer only natural history. It is also historical ecology under conditions of human transformation.
Range shifts, biome change, and ecological reorganization
Climate change is reorganizing the geography of life by altering temperature regimes, hydrological patterns, seasonal timing, disturbance frequencies, snow and ice persistence, oxygen conditions, ocean chemistry, sea level, and extreme-event exposure. These changes affect biome boundaries, habitat quality, migration corridors, reproductive timing, food webs, and interaction networks. Species may shift poleward, upslope, offshore, deeper, or into newly suitable habitats, but such movements are rarely simple. They occur through fragmented landscapes, constrained dispersal pathways, altered hydrology, and changing community contexts.
This is why ecological change under climate forcing often appears not as clean spatial replacement but as reorganization. Some habitats degrade before alternatives become available. Some species move faster than others. Some remain trapped in shrinking climatic envelopes. Some encounter novel competitors, predators, pathogens, or mutualists. Some systems become no-analog assemblages, combining species and conditions that did not historically occur together.
Biome change can therefore be slower, faster, messier, and more discontinuous than climate-envelope maps imply. Tree species may lag behind changing climates because dispersal and recruitment are slow. Coral reefs may lose living coral faster than new reef-building systems can establish. Alpine species may run out of elevation. Freshwater species may be blocked by dams or unsuitable stream temperatures. Coastal habitats may be squeezed between sea-level rise and hard infrastructure. Marine species may shift in depth or latitude, altering fisheries and trophic relationships.
For scientists, this makes the geography of life an inherently dynamic field. It is no longer enough to ask where a species or habitat is now. The harder and more consequential question is where ecological structure is moving, fragmenting, or becoming unstable through time.
Quantitative biogeography: mathematics, R, and Python
Biogeography becomes most useful when it moves beyond descriptive categories and toward models that can be estimated, tested, and extended. At a conceptual level, habitat suitability can be treated as a function of multiple interacting variables:
H_i=f(T_i,P_i,S_i,C_i,D_i,L_i,B_i)
\]
Interpretation: \(H_i\) is habitat suitability for site \(i\), \(T_i\) is temperature, \(P_i\) is precipitation or water availability, \(S_i\) is soil or substrate condition, \(C_i\) is connectivity, \(D_i\) is disturbance regime, \(L_i\) is land-use pressure, and \(B_i\) is biotic context. In applied work, this usually becomes a species distribution model or habitat suitability model in which occurrence, abundance, or condition is linked to environmental predictors across space.
A second classic relationship is the species-area equation:
S=cA^z
\]
Interpretation: \(S\) is species richness, \(A\) is habitat area, and \(c\) and \(z\) are fitted constants. This relationship remains influential because it links spatial extent to expected richness and helps formalize why fragmentation, reserve size, island area, and habitat loss matter so strongly.
A third useful formulation for turnover across space is a simple distance-decay expression:
\beta_{ij}=1-e^{-kd_{ij}}
\]
Interpretation: \(\beta_{ij}\) is ecological dissimilarity between sites \(i\) and \(j\), \(d_{ij}\) is environmental or geographic distance, and \(k\) is a fitted decay parameter. This is not a universal law, but it formalizes the intuition that community similarity often declines with distance, dispersal limitation, or environmental difference.
Worked example: species-area loss under fragmentation
Suppose a habitat patch has area \(A=100\), a fitted constant \(c=10\), and a species-area exponent \(z=0.25\). Expected richness is:
S=10(100)^{0.25}\approx31.6
\]
Interpretation: Under this simplified species-area relationship, a habitat patch with area 100 is expected to support about 31.6 species-equivalent richness units.
If fragmentation reduces effective habitat area by 30 percent, the new area is \(A=70\), and expected richness becomes:
S=10(70)^{0.25}\approx28.9
\]
Interpretation: The simplified loss is about 2.7 species-equivalent units. The number is not a prediction for a real site, but it illustrates why area reduction can translate into biodiversity loss through nonlinear spatial relationships.
These compact equations are useful because they make spatial assumptions visible. They do not replace field observation, taxonomic knowledge, remote sensing, ecological history, or conservation judgment. They clarify how geography can be translated into testable ecological models.
R and Python workflows
The following examples are compact article-level workflows. The full GitHub repository expands them into richer multi-language implementations with SQL provenance, validation notes, species-area modeling, habitat-suitability screening, spatial prioritization, distance-decay examples, biome and habitat classification tables, and reproducible computational biogeography scaffolding.
R example: species-area model fitting, uncertainty, and scenario comparison
# Advanced species-area workflow
#
# This example:
# - fits a log-log species-area model
# - estimates uncertainty by bootstrap
# - compares observed richness to a fragmentation scenario
# - produces interpretable diagnostics

set.seed(123)

# Example patch data.
patches <- data.frame(
  patch_id = paste0("P", 1:15),
  area = c(
    1.2, 2.3, 3.1, 4.8, 6.2, 8.5, 10.1, 14.8, 19.5,
    26.0, 35.2, 47.5, 62.1, 81.0, 110.0
  ),
  richness = c(
    12, 15, 18, 21, 24, 27, 29, 33, 36,
    39, 43, 47, 51, 55, 60
  )
)

# Fit log-log model: log(S) = log(c) + z log(A).
fit <- lm(log(richness) ~ log(area), data = patches)

# Extract species-area parameters.
intercept <- coef(fit)[1]
z_est <- coef(fit)[2]
c_est <- exp(intercept)

cat("Estimated c:", round(c_est, 3), "\n")
cat("Estimated z:", round(z_est, 3), "\n")

# Predictions on original scale.
patches$predicted <- exp(predict(fit, newdata = patches))
patches$residual <- patches$richness - patches$predicted

# Bootstrap uncertainty for z.
n_boot <- 2000
boot_z <- numeric(n_boot)

for (b in seq_len(n_boot)) {
  idx <- sample(seq_len(nrow(patches)), replace = TRUE)
  fit_b <- lm(log(richness) ~ log(area), data = patches[idx, ])
  boot_z[b] <- coef(fit_b)[2]
}

print(quantile(boot_z, probs = c(0.025, 0.5, 0.975)))

# Scenario: 30 percent reduction in habitat area from fragmentation.
patches$fragmented_area <- patches$area * 0.70
patches$predicted_fragmented <- c_est * patches$fragmented_area^z_est
patches$expected_loss <- patches$predicted - patches$predicted_fragmented

print(
  round(
    patches[
      ,
      c(
        "patch_id",
        "area",
        "richness",
        "predicted",
        "fragmented_area",
        "predicted_fragmented",
        "expected_loss"
      )
    ],
    2
  )
)

# Visualization.
plot(
  patches$area,
  patches$richness,
  log = "xy",
  pch = 16,
  xlab = "Patch area",
  ylab = "Species richness",
  main = "Species-Area Relationship with Fragmentation Scenario"
)

area_seq <- seq(min(patches$area), max(patches$area), length.out = 200)

# Fitted relationship.
lines(area_seq, c_est * area_seq^z_est, lwd = 2)

# Fragmented scenario line.
lines(area_seq, c_est * (area_seq * 0.70)^z_est, lty = 2, lwd = 2)

legend(
  "bottomright",
  legend = c("Observed", "Fitted SAR", "30% area loss scenario"),
  pch = c(16, NA, NA),
  lty = c(NA, 1, 2),
  bty = "n"
)
This R workflow is substantially more useful than a simple species-area plot because it estimates the exponent, quantifies uncertainty, and turns the relationship into a scenario tool. A research biologist could adapt it for island systems, reserve networks, forest fragments, reef patches, wetland complexes, restoration mosaics, or habitat-loss projections.
Python example: habitat suitability, cross-validation, and spatial prioritization prototype
import numpy as np
import pandas as pd
from sklearn.linear_model import LogisticRegression
from sklearn.model_selection import cross_val_score
from sklearn.pipeline import Pipeline
from sklearn.preprocessing import StandardScaler

# Example site-level ecological data.
# occurrence = 1 if a focal species is present, 0 otherwise.
sites = pd.DataFrame(
    {
        "temperature": [
            18.1, 19.4, 16.2, 14.8, 20.0, 21.3,
            15.5, 17.8, 13.9, 22.1, 18.9, 16.7
        ],
        "precipitation": [
            850, 910, 780, 620, 990, 1020,
            700, 840, 590, 1100, 930, 760
        ],
        "soil_quality": [
            0.72, 0.81, 0.60, 0.52, 0.88, 0.91,
            0.56, 0.73, 0.48, 0.95, 0.84, 0.62
        ],
        "connectivity": [
            0.80, 0.74, 0.55, 0.40, 0.89, 0.92,
            0.46, 0.70, 0.33, 0.96, 0.83, 0.58
        ],
        "disturbance": [
            0.20, 0.24, 0.45, 0.61, 0.18, 0.15,
            0.52, 0.31, 0.70, 0.12, 0.22, 0.41
        ],
        "land_use_pressure": [
            0.25, 0.30, 0.48, 0.60, 0.18, 0.16,
            0.55, 0.35, 0.68, 0.10, 0.21, 0.44
        ],
        "occurrence": [1, 1, 1, 0, 1, 1, 0, 1, 0, 1, 1, 0],
    }
)

X = sites.drop(columns=["occurrence"])
y = sites["occurrence"]

# Pipeline: scaling plus logistic regression.
model = Pipeline(
    [
        ("scaler", StandardScaler()),
        ("clf", LogisticRegression(max_iter=1000)),
    ]
)

# Cross-validation score.
# The dataset is intentionally small for article readability; real workflows
# should use larger datasets and spatially aware validation.
cv_scores = cross_val_score(model, X, y, cv=4, scoring="roc_auc")

print("Mean CV AUC:", round(cv_scores.mean(), 3))
print("Fold AUCs:", np.round(cv_scores, 3))

# Train final model.
model.fit(X, y)

# Predict suitability probability for existing sites.
sites["suitability_probability"] = model.predict_proba(X)[:, 1]

# Add a simple conservation-priority layer:
# high suitability + high connectivity - land-use pressure.
sites["priority_score"] = (
    0.45 * sites["suitability_probability"]
    + 0.30 * sites["connectivity"]
    - 0.25 * sites["land_use_pressure"]
)

# Rank sites.
ranked = sites.sort_values("priority_score", ascending=False).reset_index(drop=True)

print(
    ranked[
        [
            "temperature",
            "precipitation",
            "soil_quality",
            "connectivity",
            "disturbance",
            "land_use_pressure",
            "occurrence",
            "suitability_probability",
            "priority_score",
        ]
    ].round(3).to_string(index=False)
)

# Scenario test: what if land-use pressure rises by 0.10 across all sites?
scenario = X.copy()
scenario["land_use_pressure"] = scenario["land_use_pressure"] + 0.10

ranked["suitability_under_pressure"] = model.predict_proba(
    scenario.loc[ranked.index]
)[:, 1]

ranked["delta_suitability"] = (
    ranked["suitability_under_pressure"]
    - ranked["suitability_probability"]
)

print(
    ranked[
        [
            "suitability_probability",
            "suitability_under_pressure",
            "delta_suitability",
        ]
    ].round(3).to_string(index=False)
)
This Python workflow is closer to a real research pipeline than a simple weighted average. It introduces predictors, model fitting, cross-validation, probability outputs, and a prioritization layer that can be extended into species distribution modeling, corridor planning, restoration targeting, marine habitat screening, freshwater refugia analysis, or biodiversity-risk assessment. A research biologist or computational ecologist could replace the small demonstration dataset with field records, rasters, bathymetry, eDNA-derived detections, citizen-science records, or remote-sensing covariates.
Python example: distance-decay and turnover screening
import itertools
import numpy as np
import pandas as pd

# Example sites with simplified geographic distance and habitat class.
sites = pd.DataFrame(
    {
        "site": ["forest_A", "forest_B", "wetland_A", "grassland_A", "coast_A"],
        "x": [0.0, 1.2, 3.5, 5.0, 8.0],
        "y": [0.0, 0.9, 2.0, 4.1, 6.0],
        "habitat_class": ["forest", "forest", "wetland", "grassland", "coastal"],
    }
)

k = 0.18

rows = []

for i, j in itertools.combinations(range(len(sites)), 2):
    dx = sites.loc[i, "x"] - sites.loc[j, "x"]
    dy = sites.loc[i, "y"] - sites.loc[j, "y"]
    distance = np.sqrt(dx**2 + dy**2)

    beta_dissimilarity = 1 - np.exp(-k * distance)

    rows.append(
        {
            "site_i": sites.loc[i, "site"],
            "site_j": sites.loc[j, "site"],
            "distance": distance,
            "distance_decay_dissimilarity": beta_dissimilarity,
            "same_habitat_class": (
                sites.loc[i, "habitat_class"] == sites.loc[j, "habitat_class"]
            ),
        }
    )

turnover = pd.DataFrame(rows)

print(turnover.round(3).to_string(index=False))
This distance-decay scaffold helps connect biogeographic theory to practical biodiversity screening. A real workflow would replace the simple coordinates with geospatial distances, environmental distances, hydrological distances, ocean-current connectivity, or resistance surfaces, depending on the organism and habitat system being studied.
These examples are still intentionally compact enough to fit inside an article, but they move toward the kinds of workflows scientists actually use: parameter estimation, uncertainty, scenario testing, cross-validation, spatial prioritization, turnover screening, and extensible code structures rather than single-line illustrations.
GitHub repository
The article body includes compact R and Python examples so the ecological and scientific argument remains readable. The full repository expands those examples into a broader computational biogeography workflow, including species-area modeling, habitat-suitability screening, spatial prioritization, distance-decay examples, biome and habitat classification tables, SQL provenance structures, reproducible data files, and full-stack scientific-computing examples across Python, R, Julia, Fortran, Rust, Go, C, C++, SQL, and notebooks.
Relevance for ecology and field science
For ecologists and field biologists, biomes and habitats remain indispensable because they organize how sampling, inference, and comparison are done across space. They help define species pools, environmental gradients, expected turnover, disturbance context, and the scale at which ecological processes should be interpreted. Field ecology depends on this spatial framing because no observation is ecologically neutral with respect to place. Abundance, interaction strength, productivity, recruitment, and community composition all depend on where the system sits in larger geographic and environmental structure.
This also means that ecological generalization requires spatial caution. Processes observed in one habitat or one biome may not translate cleanly elsewhere, even when species or climates seem comparable. A pollination pattern in one fragmented landscape may not hold in another. A fire regime in one grassland may not explain another grassland with different soils, grazing history, or rainfall seasonality. A stream temperature threshold may have different consequences depending on connectivity and groundwater input.
For research biologists, the geography of life is therefore not background context but part of the causal structure of the system being studied.
Relevance for marine and coastal science
For marine biologists, the geography of life is often expressed not through vegetation-based biome categories but through salinity structure, bathymetry, substrate, circulation, oxygen dynamics, coastal geomorphology, depth, light, nutrient flow, and habitat connectivity. Estuaries, seagrass meadows, reefs, kelp systems, mangroves, tidal flats, oyster reefs, deep-sea benthic habitats, and shelf systems each represent distinct ecological spaces with different community structure, recruitment dynamics, and exposure to change.
A marine-facing treatment of geography must therefore attend to classification systems that capture water-column structure, benthic substrate, coastal transition zones, and the relationship between local habitats and larger seascape pattern. Marine habitats are not simply underwater versions of terrestrial habitats. Their spatial organization is shaped by currents, larval dispersal, pressure, salinity, oxygen, light penetration, hydrodynamics, and the three-dimensional structure of the water column.
This matters because marine conservation, fisheries management, coastal restoration, and climate adaptation all depend on spatially explicit habitat knowledge. A reef, seagrass meadow, mangrove forest, salt marsh, estuary, or continental shelf system may function as nursery habitat, carbon sink, biodiversity reservoir, shoreline buffer, migration corridor, or biogeochemical processing zone. Marine biogeography therefore connects habitat classification to ecological function.
Relevance for environmental health and disease ecology
For medical professionals and disease ecologists, the geography of life matters because environmental change alters the conditions under which hosts, vectors, reservoirs, pathogens, and human populations encounter one another. Habitat conversion, warming, altered water regimes, fragmentation, urban expansion, irrigation, wetland change, biodiversity loss, and shifts in seasonality can change exposure patterns even before they produce obvious biodiversity loss.
Environmental health therefore depends partly on spatial ecological structure: where wetlands persist, where vectors expand, where water quality declines, where reservoirs move, where heat exposure intensifies, where ecological buffering is lost, and where land-use transitions bring people, livestock, wildlife, and pathogens into new patterns of contact. Disease ecology is spatial ecology with health consequences.
A scientifically useful article on biomes and habitats should therefore make clear that spatial ecological changes have consequences beyond biodiversity alone. They can alter vector-borne disease risk, waterborne exposure, harmful algal bloom conditions, wildfire smoke vulnerability, nutritional systems, heat stress, and contaminant pathways. The geography of life is also a geography of risk.
Relevance for computational biology and biodiversity informatics
For computational readers, the geography of life has become a data-rich modeling problem. Species occurrence records, environmental rasters, land-cover classifications, bathymetric data, remote-sensing products, habitat maps, biodiversity databases, camera traps, acoustic monitoring, eDNA observations, and ecological trait databases now allow biogeographic questions to be explored quantitatively at large scales.
Species distribution models, habitat suitability models, connectivity analyses, turnover metrics, biome classification systems, spatial prioritization tools, and range-shift projections all depend on treating ecology as structured in environmental and geographic space. But computational scale does not remove ecological interpretation. A model can predict habitat suitability without understanding dispersal barriers. A raster can classify land cover without measuring habitat quality. An occurrence record can indicate presence without explaining persistence. A correlation can reveal pattern without proving mechanism.
This makes biogeography especially important for readers working at the interface of ecology, computation, biodiversity informatics, and research biology more broadly. It is one of the main domains in which biological theory, spatial data, and predictive modeling meet. The goal is not merely to map life, but to understand how place, process, history, and changing conditions shape where life can persist.
Conclusion
Biomes, habitats, and the geography of life reveal that living systems are spatially structured through recurring relationships among climate, water, soils, disturbance, history, dispersal, isolation, and ecological interaction. Biomes describe large-scale ecological formations. Habitats describe the more immediate conditions under which organisms actually live. Microhabitats reveal that biological persistence often depends on fine-grained structure. Biogeographic regions show that present-day distributions reflect deep evolutionary and geological histories. Human land use and climate change show that the map of life is still being redrawn.
To understand the geography of life is therefore to understand one of biology’s central organizing principles: life is distributed, constrained, diversified, and transformed through space. The map of the living world is not merely a record of where organisms occur. It is a record of environmental structure, evolutionary history, ecological process, disturbance, adaptation, and the changing conditions under which life persists.
This is why biomes and habitats matter far beyond classification. They are the spatial grammar of biology. They show how Earth’s living systems are arranged, how ecological possibility is filtered through place, and how the future of biodiversity will depend on whether habitats remain connected, functional, and capable of supporting life through environmental change.
Related articles
- Biology
- Ecology and the Interdependence of Life
- Population Dynamics and Ecological Modeling
- Populations, Communities, and Ecosystem Dynamics
- Biodiversity and the Structure of Living Systems
- Biogeochemical Cycles and the Conditions of Habitability
- The Biosphere and Planetary Life Support Systems
- Conservation Biology and the Protection of Life
- Restoration Ecology and the Repair of Living Systems
Further reading
- MacArthur, R.H. and Wilson, E.O. (1967) The Theory of Island Biogeography. Princeton, NJ: Princeton University Press. Publisher information available at: https://press.princeton.edu/books/paperback/9780691088365/the-theory-of-island-biogeography
- Whittaker, R.H. (1975) Communities and Ecosystems. 2nd edn. New York: Macmillan.
- Whittaker, R.J. and Fernández-Palacios, J.M. (2007) Island Biogeography: Ecology, Evolution, and Conservation. 2nd edn. Oxford: Oxford University Press. Publisher information available at: https://global.oup.com/academic/product/island-biogeography-9780198566113
- Elith, J. and Leathwick, J.R. (2009) ‘Species distribution models: Ecological explanation and prediction across space and time’, Annual Review of Ecology, Evolution, and Systematics, 40, pp. 677–697. Available at: https://www.annualreviews.org/content/journals/10.1146/annurev.ecolsys.110308.120159
- Dodds, W.K., Perkin, J.S. and Gerken, J.E. (2019) ‘The freshwater biome gradient framework’, Ecosphere, 10(6), e02786. Available at: https://esajournals.onlinelibrary.wiley.com/doi/full/10.1002/ecs2.2786
- Federal Geographic Data Committee, NOAA and partners (2012) Coastal and Marine Ecological Classification Standard, Version 4.0. Available at: https://repository.library.noaa.gov/view/noaa/41982/noaa_41982_DS1.pdf
- NOAA National Centers for Environmental Information (n.d.) Coastal and Marine Ecological Classification Standard. Available at: https://www.ncei.noaa.gov/products/coastal-marine-ecological-classification-standard
- NASA Earthdata (n.d.) Biosphere. Available at: https://www.earthdata.nasa.gov/topics/biosphere
- NASA Earthdata / CIESIN (2014) Anthropogenic Biomes of the World, Version 2: 2000. Available at: https://www.earthdata.nasa.gov/data/catalog/sedac-ciesin-sedac-anthromes-v2-2000-2.00
- IPBES (2019) Summary for Policymakers of the Global Assessment Report on Biodiversity and Ecosystem Services. Available at: https://files.ipbes.net/ipbes-web-prod-public-files/inline/files/ipbes_global_assessment_report_summary_for_policymakers.pdf
References
- Brown, J.H. and Lomolino, M.V. (1998) Biogeography. 2nd edn. Sunderland, MA: Sinauer Associates.
- Dodds, W.K., Perkin, J.S. and Gerken, J.E. (2019) ‘The freshwater biome gradient framework’, Ecosphere, 10(6), e02786. Available at: https://doi.org/10.1002/ecs2.2786
- Elith, J. and Leathwick, J.R. (2009) ‘Species distribution models: Ecological explanation and prediction across space and time’, Annual Review of Ecology, Evolution, and Systematics, 40, pp. 677–697. Available at: https://doi.org/10.1146/annurev.ecolsys.110308.120159
- Ellis, E.C. and Ramankutty, N. (2008) ‘Putting people in the map: Anthropogenic biomes of the world’, Frontiers in Ecology and the Environment, 6(8), pp. 439–447. Available at: https://doi.org/10.1890/070062
- Federal Geographic Data Committee, NOAA and partners (2012) Coastal and Marine Ecological Classification Standard, Version 4.0. Available at: https://repository.library.noaa.gov/view/noaa/41982/noaa_41982_DS1.pdf
- IPBES (2019) Summary for Policymakers of the Global Assessment Report on Biodiversity and Ecosystem Services. Available at: https://files.ipbes.net/ipbes-web-prod-public-files/inline/files/ipbes_global_assessment_report_summary_for_policymakers.pdf
- MacArthur, R.H. and Wilson, E.O. (1967) The Theory of Island Biogeography. Princeton, NJ: Princeton University Press. Publisher information available at: https://press.princeton.edu/books/paperback/9780691088365/the-theory-of-island-biogeography
- NASA Earthdata (n.d.) Biosphere. Available at: https://www.earthdata.nasa.gov/topics/biosphere
- NASA Earthdata / CIESIN (2014) Anthropogenic Biomes of the World, Version 2: 1700. Available at: https://www.earthdata.nasa.gov/data/catalog/sedac-ciesin-sedac-anthromes-v2-1700-2.0
- NASA Earthdata / CIESIN (2014) Anthropogenic Biomes of the World, Version 2: 2000. Available at: https://www.earthdata.nasa.gov/data/catalog/sedac-ciesin-sedac-anthromes-v2-2000-2.00
- NOAA National Centers for Environmental Information (n.d.) Coastal and Marine Ecological Classification Standard. Available at: https://www.ncei.noaa.gov/products/coastal-marine-ecological-classification-standard
- Rosenzweig, M.L. (1995) Species Diversity in Space and Time. Cambridge: Cambridge University Press. Publisher information available at: https://www.cambridge.org/core/books/species-diversity-in-space-and-time/34A4F94070482C5EA6A81CB669D7B2ED
- Whittaker, R.H. (1975) Communities and Ecosystems. 2nd edn. New York: Macmillan.
- Whittaker, R.J. and Fernández-Palacios, J.M. (2007) Island Biogeography: Ecology, Evolution, and Conservation. 2nd edn. Oxford: Oxford University Press. Publisher information available at: https://global.oup.com/academic/product/island-biogeography-9780198566113