
Last Updated May 28, 2026
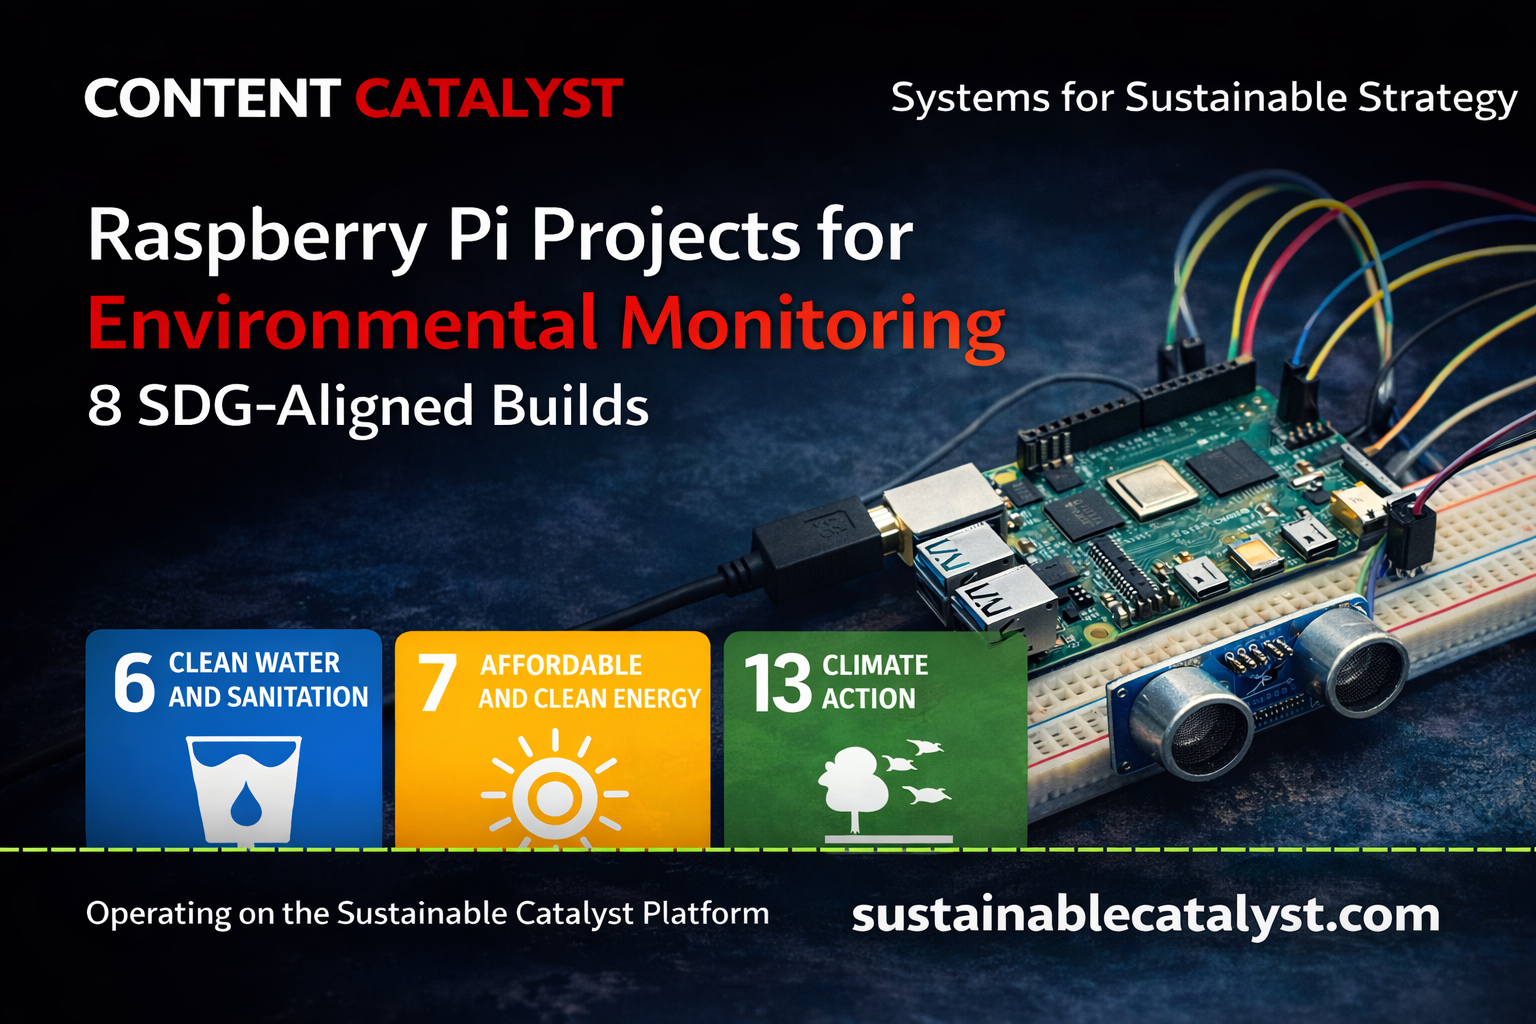
Raspberry Pi environmental monitoring projects show how low-cost computing platforms can support climate observation, water-quality analysis, biodiversity monitoring, renewable-energy systems, agricultural resilience, flood preparedness, and distributed environmental intelligence aligned with the United Nations Sustainable Development Goals.
Environmental sustainability increasingly depends on the ability to observe and measure complex systems in real time. Climate variability, water scarcity, ecosystem degradation, air pollution, energy transitions, biodiversity loss, food-system stress, and disaster preparedness all require monitoring infrastructure capable of collecting, storing, interpreting, and communicating environmental data.
Raspberry Pi devices are especially useful in this context because they sit between simple microcontroller projects and full-scale industrial monitoring systems. They can connect to sensors, run Python scripts, store observations in databases, host dashboards, perform lightweight machine learning, serve local web interfaces, and operate as edge-computing nodes in distributed environmental monitoring networks.
This article map serves as the central gateway for a Raspberry Pi sustainability engineering series. The projects are not certified scientific instruments, regulatory systems, emergency warning networks, or production infrastructure. They are open educational prototypes that demonstrate how sensing, edge computing, data logging, analytics, dashboards, and decision support can work together in environmental systems.
Main Library
Publications
Article Map
Raspberry Pi Projects
Related Topic
Environmental Monitoring
Related Topic
Infrastructure Systems
Related Topic
SDGs & Boundaries
The series connects directly to broader knowledge areas across the site, including Environmental Monitoring Systems, Intelligent Infrastructure Systems, Sustainable Development Goals Within Planetary Boundaries, Climate Change as a Planetary Boundary, Freshwater Change and Earth System Risk, Biosphere Integrity and the Stability of Life Systems, and Planetary Boundaries.
Purpose of the Series
This article map serves as the central index for a series of Raspberry Pi sustainability engineering projects. Each project introduces a practical environmental monitoring build, explains its system architecture, identifies relevant sensors and data flows, provides code-oriented implementation guidance, and connects the build to one or more Sustainable Development Goals.
The projects can be read individually, but they also work together as a small curriculum in applied environmental data infrastructure. Across the series, several recurring patterns appear:
- Sensing: measuring environmental or infrastructure conditions such as temperature, humidity, air quality, rainfall, water quality, river levels, soil moisture, wildlife activity, and solar power output.
- Edge computing: using Raspberry Pi hardware to process observations locally, reduce dependence on constant cloud connectivity, and run monitoring logic near the source of data.
- Data storage: recording observations in CSV files, SQLite databases, time-series databases, image folders, log files, or dashboard-ready exports.
- Analytics: applying thresholds, rolling averages, anomaly detection, model inference, simple forecasting, or dashboard logic to translate raw readings into interpretable signals.
- Decision support: using environmental data to support monitoring, early warning, conservation, water stewardship, energy resilience, or agricultural decision-making.
These builds are reference prototypes rather than final systems. Their strongest use is educational, experimental, and conceptual: they show how sustainability challenges can be translated into measurable engineering workflows.
That distinction matters. A Raspberry Pi dashboard that detects a rising river, poor air-quality reading, high turbidity spike, or solar-output anomaly may be useful for learning and local awareness. It is not automatically an official warning system, regulatory instrument, public-health monitor, or certified scientific network. The series therefore emphasizes validation, metadata, calibration, field maintenance, and responsible interpretation as much as code.
Why Raspberry Pi for Environmental Monitoring?
Raspberry Pi platforms are useful because they provide more computing capability than many microcontroller systems while remaining affordable, compact, programmable, and accessible. They can run a full Linux operating system, support Python, communicate with sensors, host local databases, serve dashboards, connect to networks, and run lightweight machine-learning workloads.
This makes Raspberry Pi especially well suited for environmental systems that need more than a single sensor reading. A Raspberry Pi node can collect data, clean it, timestamp it, store it, visualize it, synchronize it, and apply local analytics before sending anything to the cloud. That ability is central to edge computing: moving computation closer to the environment being measured.
Raspberry Pi systems are also flexible. The same basic architecture can support a climate station, a water-quality monitor, an irrigation controller, a biodiversity camera trap, a solar microgrid dashboard, or a flood-monitoring node. The sensors change, the code changes, and the interpretation changes, but the underlying monitoring pattern remains recognizable.
The Raspberry Pi is not always the right tool. Some field systems require lower power consumption, industrial-grade enclosures, real-time operation, certified measurement hardware, cellular or satellite telemetry, rugged connectors, or long-duration reliability beyond hobby hardware. The purpose of this series is not to pretend otherwise. The purpose is to use Raspberry Pi projects as an accessible way to understand the architecture of environmental monitoring infrastructure.
Engineering Architecture of Environmental Monitoring Systems
Most Raspberry Pi environmental monitoring projects follow a similar technical architecture:
Environmental Sensors → Edge Computing → Data Storage → Analytics → Decision SupportEach layer contributes a different function:
- Sensor layer: collects measurements such as temperature, rainfall, air quality, water chemistry, wildlife motion, river level, soil conditions, or power output.
- Edge computing layer: processes sensor signals locally, performs filtering and aggregation, executes monitoring logic, and manages device-level workflows.
- Data layer: stores observations in local files, SQLite databases, time-series databases, image archives, or cloud-synchronized repositories.
- Analytics layer: applies statistical models, threshold rules, machine learning methods, or anomaly detection to identify trends, outliers, or emerging risks.
- Decision layer: generates alerts, dashboards, summaries, or operational insights that support environmental management.
Raspberry Pi systems operate primarily in the edge computing layer, where sensor data can be processed locally before being transmitted to centralized databases or monitoring platforms. Because Raspberry Pi hardware is relatively affordable, energy efficient, programmable, and widely available, it can support distributed environmental monitoring networks that scale across cities, watersheds, farms, ecosystems, field stations, schools, restoration projects, and community science efforts.
The architecture also clarifies why environmental monitoring is not only about sensors. Sensors produce signals. Monitoring systems require timekeeping, unit conventions, metadata, calibration records, database schemas, enclosure design, power management, error handling, maintenance logs, and interpretive rules. Without those supporting layers, a sensor network can produce numbers without producing trustworthy knowledge.
Projects at a Glance
| Project | Primary SDG Alignment | Core Sustainability Theme | Main Technical Pattern |
|---|---|---|---|
| Environmental Data Hub | SDG 13 | Climate monitoring and environmental data infrastructure | Sensor aggregation, local logging, climate API integration, analytics |
| Urban Air Quality and Heat Island Monitor | SDG 11 / SDG 13 | Urban resilience, air pollution, and heat exposure | PM sensing, atmospheric monitoring, SQLite logging, anomaly detection |
| Smart Irrigation Data Controller | SDG 2 / SDG 6 | Agricultural resilience and water efficiency | Soil sensing, weather-aware control, relay actuation, dashboards |
| Biodiversity Camera Trap with Edge AI | SDG 15 | Biodiversity monitoring and ecological observation | Motion-triggered imaging, metadata logging, TensorFlow Lite inference |
| Smart Water Quality Monitoring Network | SDG 6 | Freshwater stewardship and water-quality observation | pH, turbidity, temperature sensing, ADC conversion, SQLite logging |
| Solar Microgrid Monitoring System | SDG 7 | Renewable energy visibility and microgrid resilience | Voltage/current sensing, energy logging, dashboard export |
| Climate Early Warning System | SDG 13 / SDG 11 | Climate resilience and disaster preparedness | Multi-hazard sensing, threshold logic, local alerts, climate logging |
| Flood and River Monitoring Network | SDG 6 / SDG 13 | Flood resilience and hydrological monitoring | Water-level sensing, rainfall monitoring, alert logic, trend detection |
The series is intentionally interdisciplinary. Climate data hubs, urban sensors, irrigation controllers, camera traps, water-quality networks, solar monitors, early-warning systems, and flood nodes may look like separate projects, but they all share the same systems problem: how to convert environmental signals into reliable, interpretable, ethically usable data.
1. Environmental Data Hub
Primary SDG alignment: SDG 13: Climate Action
The Environmental Data Hub aggregates measurements from environmental sensors and provides a local platform for climate monitoring, environmental logging, and edge analytics. A Raspberry Pi can collect data from sensors such as the BME280, particulate matter monitors, rainfall gauges, and other environmental devices, then store readings locally for analysis or dashboard export.
Typical System Components
- Raspberry Pi 4, Raspberry Pi 5, or Raspberry Pi Zero 2 W
- BME280 environmental sensor for temperature, humidity, and pressure
- optional particulate matter sensor
- optional rainfall, soil, or water-quality sensors
- SQLite, CSV, InfluxDB, or other environmental data storage tools
- dashboard or visualization layer
- optional API integration with climate datasets
Why It Matters
A Raspberry Pi environmental data hub allows communities, researchers, educators, and local monitoring programs to build localized environmental observatories. By collecting sensor data over long periods, these systems can support climate trend analysis, local environmental awareness, pollution event detection, and evidence-based climate adaptation planning.
The data hub is the foundation of the series because many other projects depend on the same pattern: collect readings, add timestamps and metadata, store data locally, and prepare the dataset for analysis. It also demonstrates why environmental observation must be cumulative. A single temperature reading is useful; a multi-year record becomes a local climate archive.
This project connects closely to Environmental Monitoring Systems, Intelligent Infrastructure Systems, and Climate Change as a Planetary Boundary.
Full project: Raspberry Pi Environmental Data Hub for Climate Monitoring
2. Urban Air Quality and Heat Island Monitor
Primary SDG alignment: SDG 11: Sustainable Cities and Communities and SDG 13: Climate Action
Urban environments often experience environmental conditions that differ significantly from surrounding rural or less built-up regions. Dense infrastructure, transportation networks, impervious surfaces, waste heat, limited vegetation, and uneven tree canopy can intensify heat retention and air pollution, producing urban heat islands and localized environmental health risks.
A Raspberry Pi urban monitoring station can measure particulate pollution, temperature, humidity, pressure, and local environmental variation. These observations help make neighborhood-scale differences in heat and air quality more visible.
Typical System Components
- Raspberry Pi computer
- BME280 or similar atmospheric sensor
- PMS5003 or similar particulate matter sensor
- optional volatile organic compound sensor
- local data logger or SQLite database
- dashboard or visualization layer
- weather-resistant enclosure with proper airflow
Why It Matters
Urban monitoring systems help identify neighborhoods experiencing elevated heat exposure, particulate pollution, or environmental stress. These systems support SDG 11 by improving urban environmental awareness and SDG 13 by strengthening local climate adaptation strategies.
The project also raises an equity question. Heat and air pollution are often unevenly distributed across cities because of land use, industrial siting, traffic corridors, housing conditions, tree canopy, infrastructure investment, and historic patterns of exclusion. Local sensing cannot solve those inequities alone, but it can make environmental burdens more visible at a scale that citywide averages often obscure.
This project connects to Atmospheric Aerosol Loading and Regional Planetary Risk, Climate Change as a Planetary Boundary, and Intelligent Infrastructure Systems.
Full project: Raspberry Pi Urban Air Quality and Heat Island Monitor
3. Smart Irrigation Data Controller
Primary SDG alignment: SDG 2: Zero Hunger and SDG 6: Clean Water and Sanitation
A Raspberry Pi irrigation controller integrates soil sensing, weather-aware decision logic, dashboards, and optional automation to improve irrigation efficiency and reduce water waste in agriculture, gardens, greenhouses, and controlled growing environments.
Unlike a simple timer, a sensor-driven irrigation system can respond to actual conditions. Soil moisture, temperature, humidity, forecast data, and plant water requirements can be combined into a decision workflow that waters only when conditions justify it.
Typical System Components
- Raspberry Pi controller
- soil moisture sensors
- temperature and humidity sensors
- weather API integration
- relay module
- irrigation valve or water pump
- monitoring dashboard
- optional rain gauge or flow meter
Why It Matters
Agricultural water use is central to freshwater sustainability. Sensor-driven irrigation systems allow crops, gardens, and controlled growing environments to be watered based on measured soil conditions rather than fixed schedules. This supports water efficiency, agricultural resilience, and more responsible resource use.
The project also illustrates a broader systems lesson: efficiency is not achieved by automation alone. It depends on good sensor placement, crop-specific thresholds, soil type, weather context, pump and valve reliability, and clear safeguards that prevent overwatering or equipment failure.
This project connects to Freshwater Change and Earth System Risk, Land-System Change and Ecological Transformation, and Environmental Monitoring Systems.
Full project: Smart Irrigation with Raspberry Pi
4. Biodiversity Camera Trap with Edge AI
Primary SDG alignment: SDG 15: Life on Land
Biodiversity monitoring is essential for understanding ecosystem health, wildlife movement, habitat use, and ecological change. Raspberry Pi camera traps combine automated image capture with optional local AI inference to support ecological observation without continuous human presence in the field.
A Raspberry Pi biodiversity camera trap can use a PIR motion sensor to trigger image capture, store images locally, log observation metadata in SQLite, and optionally run TensorFlow Lite models to filter empty frames or classify broad wildlife categories.
Typical System Components
- Raspberry Pi computer
- camera module
- PIR motion sensor
- local image and metadata storage
- optional TensorFlow Lite model for image classification
- weather-resistant field enclosure
- optional solar-assisted battery system
Why It Matters
Camera traps allow researchers, educators, conservation groups, and community science programs to observe animal activity without constant human presence in habitats. Edge AI can reduce manual review time by prioritizing likely wildlife images and filtering low-value captures.
The project also raises important ethical and governance questions. Wildlife images can reveal sensitive species locations, nesting sites, private property, or human activity. Responsible biodiversity camera traps must consider data privacy, site permissions, species protection, and the risk of exposing vulnerable wildlife to harm.
This project connects directly to Biosphere Integrity and the Stability of Life Systems, Land-System Change and Ecological Transformation, and Environmental Monitoring Systems.
Full project: Raspberry Pi Biodiversity Camera Trap with Edge AI
5. Smart Water Quality Monitoring Network
Primary SDG alignment: SDG 6: Clean Water and Sanitation
Freshwater ecosystems require continuous monitoring to detect contamination events, sediment pulses, chemical stress, and temperature shifts. A Raspberry Pi water quality monitoring system can collect pH, turbidity, temperature, conductivity, and related readings, then store observations locally or export them to dashboards.
The Raspberry Pi does not have native analog input, so many water-quality projects use an analog-to-digital converter such as the ADS1115 to read analog sensor signals.
Typical System Components
- Raspberry Pi data hub
- pH sensor
- turbidity sensor
- DS18B20 waterproof temperature probe
- electrical conductivity or dissolved solids sensor
- ADS1115 analog-to-digital converter
- local database or cloud dashboard
- waterproof probe housing and field enclosure
Why It Matters
Distributed water quality monitoring networks allow communities, researchers, educators, and environmental managers to detect changes in freshwater conditions earlier and build more transparent water-governance systems. These systems support watershed awareness, pollution detection, environmental education, and SDG 6-aligned stewardship.
The project also illustrates why water data must be interpreted carefully. Low-cost sensors can support screening, trend analysis, and education, but they do not identify every contaminant and should not be used alone for drinking-water safety, regulatory compliance, or public-health decisions.
This project connects to Freshwater Change and Earth System Risk, Biogeochemical Flows: Nitrogen, Phosphorus, and Planetary Destabilization, and Environmental Monitoring Systems.
Full project: Raspberry Pi Water Quality Monitoring System
6. Solar Microgrid Monitoring System
Primary SDG alignment: SDG 7: Affordable and Clean Energy
Renewable energy systems require monitoring tools that track electricity generation, battery performance, charge behavior, and load demand in real time. A Raspberry Pi solar microgrid monitoring system can measure low-voltage DC power flows and store energy observations for later analysis.
In a small prototype, the system may use an INA219 sensor to measure voltage, current, and instantaneous power. In larger systems, monitoring may extend to charge controllers, inverters, battery banks, weather conditions, and load behavior.
Typical System Components
- Raspberry Pi monitoring node
- INA219 or similar current and voltage sensor
- solar panel array
- battery bank
- charge controller
- optional inverter or DC load system
- energy data logger or dashboard
- optional weather sensor for irradiance and temperature context
Why It Matters
Energy monitoring systems help operators understand solar production patterns, diagnose faults, track battery behavior, and optimize renewable energy infrastructure. These Raspberry Pi systems support SDG 7 by improving the visibility, reliability, and maintainability of distributed clean-energy systems.
The project also shows that clean-energy transition is not only about generation. It is about feedback: knowing what the system produces, when batteries charge or discharge, where losses occur, and whether loads match available energy.
This project connects to Intelligent Infrastructure Systems, Climate Change as a Planetary Boundary, and Sustainable Development Goals Within Planetary Boundaries.
Full project: Raspberry Pi Solar Microgrid Monitoring System
7. Climate Early Warning System
Primary SDG alignment: SDG 13: Climate Action and SDG 11: Sustainable Cities and Communities
Climate early warning systems monitor atmospheric and hydrological signals associated with storms, heatwaves, flooding, drought, and other climate-related hazards. A Raspberry Pi early warning prototype can combine temperature, humidity, pressure, rainfall, water-level, and optional wind or soil-moisture data into local risk-detection workflows.
Threshold logic, rolling baselines, anomaly detection, and dashboard alerts can translate environmental change into early awareness. The system is not a public warning network, but it demonstrates the architecture of local climate-risk monitoring.
Typical System Components
- Raspberry Pi weather monitoring station
- BME280 or equivalent atmospheric sensor
- barometric pressure sensor
- temperature and humidity sensors
- rainfall gauge
- optional wind or water-level sensors
- alert logic and environmental logging tools
Why It Matters
Early warning systems help communities prepare for climate hazards before they escalate into emergencies. By detecting unusual environmental patterns in real time, Raspberry Pi monitoring stations support climate resilience, disaster preparedness, and local environmental awareness.
The project must be framed carefully. Educational early-warning prototypes can teach the architecture of risk monitoring, but official warnings require validated instrumentation, institutional accountability, communications protocols, redundancy, and emergency-management integration.
This project connects to Climate Change as a Planetary Boundary, Freshwater Change and Earth System Risk, and Intelligent Infrastructure Systems.
Full project: Raspberry Pi Climate Early Warning System
8. Flood and River Monitoring Network
Primary SDG alignment: SDG 6: Clean Water and Sanitation and SDG 13: Climate Action
Flood monitoring systems track hydrological conditions such as river levels, rainfall intensity, drainage behavior, rate of rise, and soil saturation to identify emerging flood risks. A Raspberry Pi monitoring node can collect water-level data, rainfall measurements, and atmospheric readings, then apply local alert logic to support early awareness.
Typical System Components
- Raspberry Pi monitoring node
- ultrasonic water-level sensor or weather-rated distance sensor
- tipping-bucket rainfall gauge
- optional soil moisture sensors
- BME280 environmental sensor package
- wireless communication or dashboard interface
- solar power and battery storage for field deployment
Why It Matters
Flood monitoring networks allow communities, watershed managers, educators, and resilience groups to observe rising water levels earlier, understand rainfall-runoff patterns, and strengthen climate adaptation planning. These systems support both SDG 6 and SDG 13 by improving hydrological visibility.
The project also demonstrates the importance of rate-of-change monitoring. Absolute water level matters, but a rapid rise may be more significant than a high but stable level. Responsible flood-monitoring prototypes should therefore track both level and trend while making clear that official flood warnings require validated hydrological networks and emergency-management authority.
This project connects to Freshwater Change and Earth System Risk, Climate Change as a Planetary Boundary, and Environmental Monitoring Systems.
Full project: Raspberry Pi Flood and River Monitoring Network
Building Distributed Environmental Monitoring Systems
The projects in this series illustrate how Raspberry Pi systems can function as environmental data infrastructure. By connecting sensors, databases, analytics tools, dashboards, and communication layers, small monitoring devices can evolve into distributed environmental observation networks.
These networks support applications such as:
- climate monitoring
- biodiversity research
- agricultural optimization
- water-resource management
- renewable energy monitoring
- urban environmental resilience
- flood and disaster preparedness
- community science and environmental education
Because Raspberry Pi hardware is affordable and widely available, these monitoring systems can be implemented by universities, research groups, schools, local governments, community science initiatives, restoration projects, watershed groups, and local organizations.
The long-term value of these systems is not only that they collect data. Their value is that they make environmental conditions more observable, comparable, and interpretable across time and place. A single monitoring node can teach the workflow. A network of nodes can reveal spatial variation, local inequities, upstream-downstream differences, microclimates, ecological gradients, infrastructure vulnerabilities, and seasonal change.
Distributed monitoring also introduces governance questions. Who owns the data? Who maintains the sensors? Who interprets alerts? Who has access to location information? Who benefits from the monitoring, and who is burdened by it? These questions are part of responsible environmental data infrastructure.
Shared Data Model for the Series
Although each project measures different variables, the series benefits from a shared data model. Consistent fields make projects easier to compare, extend, and document.
| Field | Example | Purpose |
|---|---|---|
| timestamp_utc | 2026-05-28T09:15:00Z | Provides a consistent time reference for analysis |
| site_id | urban_heat_node_03 | Identifies the monitoring location or system node |
| project_type | air_quality | Distinguishes project workflows across the series |
| sensor_id | pms5003_a | Links readings to specific hardware |
| variable | pm2_5_ug_m3 | Names the measured quantity |
| value | 18.4 | Stores the measured or calculated reading |
| unit | µg/m³ | Preserves the unit needed for interpretation |
| quality_flag | valid | Marks readings as valid, suspect, missing, or calibration-needed |
| calibration_id | pm_cal_2026_05 | Connects the reading to calibration history |
| notes | sensor cleaned after dust event | Captures maintenance or field context |
A shared data model supports the larger purpose of the series: showing that environmental monitoring is not only about hardware. It is also about making data durable, interpretable, comparable, and reusable.
Data Quality, Validation, and Responsible Use
Environmental monitoring systems must be interpreted carefully. Low-cost sensors can be useful for education, local observation, trend detection, and prototype engineering, but they are not automatically equivalent to certified scientific instruments or regulatory networks.
Several issues affect data quality:
- Sensor calibration: readings must be checked against reference conditions or known values where possible.
- Placement: sensor location, height, shading, enclosure airflow, water exposure, or mounting angle can strongly affect measurements.
- Power stability: weak power supplies can cause sensor errors, corrupted files, or failed logging.
- Environmental exposure: moisture, heat, dust, insects, corrosion, and vibration can degrade field equipment.
- Metadata quality: timestamps, units, location identifiers, sensor IDs, and maintenance notes are essential for interpretation.
- Validation: dashboards and alerts should be tested under simulated and real conditions before being trusted.
- Reference comparison: prototype readings should be compared with reference instruments, public datasets, laboratory results, or known test conditions where possible.
Projects involving flood risk, climate hazards, air quality, drinking water, or public safety should be treated especially carefully. Raspberry Pi systems can support local observation and decision support, but official public warnings, regulatory decisions, public-health decisions, and emergency actions should rely on validated systems and responsible institutional processes.
Data quality is also an equity issue. Poorly validated monitoring can mislead communities, understate environmental burdens, exaggerate risks, or shift responsibility away from institutions. Responsible environmental data systems should make uncertainty visible rather than hiding it behind dashboards.
Edge Analytics, Dashboards, and Decision Support
Raspberry Pi systems are valuable because they can perform local analytics. Instead of sending every raw reading to a remote server, a Raspberry Pi node can calculate rolling averages, detect missing data, flag sensor drift, identify threshold exceedances, summarize daily patterns, and produce local dashboards.
Common edge-analytics patterns include:
- Rolling averages: smoothing noisy readings to reveal short-term trends.
- Rate-of-change detection: identifying rapid increases in water level, temperature, pollution, or energy demand.
- Threshold logic: flagging values above or below defined reference levels.
- Anomaly detection: identifying values that differ sharply from recent baselines.
- Event logging: storing not only readings, but the moments when conditions change.
- Dashboard summaries: converting raw logs into charts, maps, status panels, or maintenance views.
Decision support should remain proportionate to system maturity. A dashboard can help users notice environmental change, but it should not create false authority. For consequential decisions, prototype analytics should be reviewed, validated, and embedded within accountable institutional processes.
Field Deployment, Power, and Maintenance
Field deployment is often the difference between a working prototype and a useful monitoring system. Environmental systems fail through water intrusion, overheating, insects, loose connectors, corrosion, weak batteries, damaged cables, poor airflow, condensation, sensor fouling, and unmaintained data storage.
Responsible deployment should address:
- weather-resistant enclosures
- ventilation and radiation shielding for atmospheric sensors
- waterproof probe housings for aquatic systems
- strain relief for field wiring
- battery sizing and solar charging where appropriate
- watchdog processes and automatic restart behavior
- local storage redundancy or remote synchronization
- maintenance schedules
- sensor cleaning and recalibration
- safe mounting that does not damage ecosystems, infrastructure, or property
Maintenance is not a minor operational detail. It is part of the measurement system. A neglected sensor can produce data that looks precise while becoming increasingly wrong. Each project in the series should therefore be documented with maintenance notes, calibration logs, and known failure modes.
Supporting the Sustainable Development Goals
The United Nations Sustainable Development Goals emphasize evidence-based decision-making in addressing global environmental challenges. Environmental monitoring infrastructure helps governments, researchers, communities, educators, and local institutions measure conditions more accurately and respond to emerging risks more effectively.
The Raspberry Pi projects in this series connect to several SDGs:
- SDG 2: Zero Hunger — through irrigation monitoring and climate-resilient agriculture.
- SDG 6: Clean Water and Sanitation — through freshwater, flood, and water-quality observation.
- SDG 7: Affordable and Clean Energy — through solar microgrid monitoring and renewable energy visibility.
- SDG 9: Industry, Innovation and Infrastructure — through distributed sensing, edge computing, data infrastructure, and resilient monitoring systems.
- SDG 11: Sustainable Cities and Communities — through urban air quality, heat island, climate adaptation, and disaster-preparedness monitoring.
- SDG 13: Climate Action — through climate observation, early warning, flood monitoring, and local resilience systems.
- SDG 15: Life on Land — through biodiversity monitoring, ecological camera traps, habitat observation, and conservation technology.
Raspberry Pi computers contribute to this effort by providing accessible computing platforms capable of supporting distributed environmental data networks. Projects like those described in this series demonstrate how open hardware, open-source software, local sensing, and edge analytics can strengthen environmental monitoring capabilities worldwide.
The SDG framing should still be used carefully. A prototype aligned with SDG 6, SDG 13, or SDG 15 does not automatically produce water justice, climate resilience, or biodiversity protection. It contributes to the measurement layer that can support those goals when embedded in responsible governance, community participation, scientific validation, and sustained maintenance.
Expanded Article Architecture
The Raspberry Pi environmental monitoring series is organized as an applied project map rather than a simple list of builds. Each article introduces one environmental monitoring problem, one Raspberry Pi system architecture, one SDG-aligned sustainability use case, and one reusable data or analytics pattern. Together, the eight projects form a practical curriculum in distributed environmental intelligence.
The architecture below groups the projects by their main systems function while preserving the published article sequence. This gives readers a clearer path through the series: first the data infrastructure, then urban and agricultural sensing, then biodiversity and water monitoring, then renewable-energy and climate-risk systems.
Environmental Data Infrastructure and Local Climate Observation
- 1. Raspberry Pi Environmental Data Hub for Climate Monitoring — A foundational project for aggregating atmospheric, climate, and environmental sensor data into a local edge-computing hub. The article explains sensor aggregation, local logging, climate API integration, dashboard preparation, and how environmental data hubs support climate observation and SDG 13-aligned resilience planning.
Urban Environmental Conditions, Heat, Air Quality, and Agricultural Water Use
- 2. Raspberry Pi Urban Air Quality and Heat Island Monitor — A city-focused monitoring build for measuring particulate matter, temperature, humidity, pressure, and urban environmental variation. The article connects low-cost sensing to heat exposure, air pollution, neighborhood-scale climate adaptation, environmental justice, and urban resilience.
- 3. Smart Irrigation with Raspberry Pi — A water-efficiency and agricultural-resilience project that integrates soil moisture sensing, weather-aware control logic, relay actuation, and dashboards. The article demonstrates how irrigation systems can move beyond fixed timers toward measured, condition-responsive water management.
Biodiversity Observation, Freshwater Stewardship, and Ecological Monitoring
- 4. Raspberry Pi Biodiversity Camera Trap with Edge AI — A conservation technology project that combines motion-triggered imaging, local metadata logging, and optional TensorFlow Lite inference. The article shows how camera traps can support biodiversity observation while raising questions about data sensitivity, field ethics, habitat disturbance, and responsible AI-assisted review.
- 5. Raspberry Pi Water Quality Monitoring System — A freshwater monitoring project that uses sensors for pH, turbidity, temperature, conductivity, and related water-quality indicators. The article explains the need for analog-to-digital conversion, calibration, probe maintenance, SQLite logging, and responsible interpretation of water-quality data.
Renewable Energy Visibility, Climate Risk, and Early Warning Systems
- 6. Raspberry Pi Solar Microgrid Monitoring System — A renewable-energy monitoring project for observing voltage, current, power, battery behavior, charge patterns, and system performance in low-voltage solar and microgrid contexts. The article frames energy monitoring as a feedback layer for clean-energy reliability and SDG 7-aligned infrastructure.
- 7. Raspberry Pi Climate Early Warning System — A climate-risk monitoring prototype that combines atmospheric, rainfall, water-level, and hazard-related signals into local early-awareness workflows. The article emphasizes threshold logic, rolling baselines, anomaly detection, local alerts, and the distinction between educational prototypes and official public warning systems.
- 8. Raspberry Pi Flood and River Monitoring Network — A hydrological monitoring project focused on river levels, rainfall, rate of rise, and flood-risk visibility. The article connects local water-level sensing to climate adaptation, watershed awareness, flood preparedness, and responsible hydrological data interpretation.
This structure gives the series a clearer knowledge architecture. The first project establishes the environmental data hub; the next two apply sensing to urban and agricultural systems; the middle projects extend monitoring into biodiversity and freshwater systems; and the final three projects focus on energy visibility, climate hazards, and hydrological risk. The result is not only a collection of Raspberry Pi builds, but a coherent map of how edge computing can support environmental monitoring across sustainability domains.
Conclusion
Raspberry Pi environmental monitoring projects demonstrate how accessible computing platforms can support climate resilience, water management, biodiversity research, agricultural optimization, renewable-energy monitoring, urban environmental awareness, and disaster preparedness.
By combining sensors with data storage, analytics, visualization tools, edge computing, and open-source workflows, Raspberry Pi systems transform raw environmental measurements into interpretable monitoring infrastructure. They make it possible to experiment with distributed observation systems at human scale while connecting those prototypes to larger sustainability challenges.
The strongest lesson across this series is that sustainability depends on feedback. Communities, researchers, educators, and decision-makers need systems that can observe environmental conditions, store reliable records, detect change, and support responsible interpretation. Raspberry Pi systems do not solve planetary challenges by themselves, but they help make the logic of environmental monitoring, resilience, and data-driven sustainability visible in practical form.
The deeper institutional lesson is that environmental data infrastructure must be treated with care. A sensor network can illuminate climate, water, air, biodiversity, energy, and flood conditions only when it is calibrated, maintained, documented, governed, and interpreted with humility. The value of the Raspberry Pi is not that it makes environmental systems simple. Its value is that it gives learners and practitioners a concrete way to build the measurement layer that serious environmental stewardship requires.
Related Site Areas
- Environmental Monitoring Systems
- Intelligent Infrastructure Systems
- Sustainable Development Goals Within Planetary Boundaries
- Climate Change as a Planetary Boundary
- Freshwater Change and Earth System Risk
- Atmospheric Aerosol Loading and Regional Planetary Risk
- Biogeochemical Flows: Nitrogen, Phosphorus, and Planetary Destabilization
- Biosphere Integrity and the Stability of Life Systems
- Land-System Change and Ecological Transformation
- Planetary Boundaries
Further Reading
- Adafruit (n.d.) Raspberry Pi Sensor Guides. Available at: https://learn.adafruit.com/category/raspberry-pi
- European Environment Agency (n.d.) Air Quality Monitoring. Available at: https://www.eea.europa.eu/en/topics/in-depth/air-pollution
- International Energy Agency (n.d.) Renewables. Available at: https://www.iea.org/energy-system/renewables
- IPBES (2019) Global Assessment Report on Biodiversity and Ecosystem Services. Available at: https://ipbes.net/global-assessment
- Raspberry Pi Foundation (n.d.) Raspberry Pi Documentation. Available at: https://www.raspberrypi.com/documentation/
- United Nations (n.d.) The 17 Sustainable Development Goals. Available at: https://sdgs.un.org/goals
- UNDRR (n.d.) Early Warnings for All. Available at: https://www.undrr.org/early-warnings-for-all
- U.S. Environmental Protection Agency (n.d.) Air Sensor Toolbox. Available at: https://www.epa.gov/air-sensor-toolbox
- U.S. Geological Survey (2019) National Field Manual for the Collection of Water-Quality Data. Available at: https://www.usgs.gov/mission-areas/water-resources/science/national-field-manual-collection-water-quality-data-nfm
- World Meteorological Organization (n.d.) Early Warnings for All. Available at: https://wmo.int/activities/early-warnings-all
References
- Adafruit (n.d.) Raspberry Pi Sensor Guides. Available at: https://learn.adafruit.com/category/raspberry-pi
- European Environment Agency (n.d.) Air Pollution. Available at: https://www.eea.europa.eu/en/topics/in-depth/air-pollution
- International Energy Agency (n.d.) Renewables. Available at: https://www.iea.org/energy-system/renewables
- IPBES (2019) Global Assessment Report on Biodiversity and Ecosystem Services. Available at: https://ipbes.net/global-assessment
- Raspberry Pi Foundation (n.d.) Raspberry Pi Documentation. Available at: https://www.raspberrypi.com/documentation/
- United Nations (n.d.) The 17 Sustainable Development Goals. Available at: https://sdgs.un.org/goals
- United Nations (n.d.) Sustainable Development Goal 2: Zero Hunger. Available at: https://sdgs.un.org/goals/goal2
- United Nations (n.d.) Sustainable Development Goal 6: Clean Water and Sanitation. Available at: https://sdgs.un.org/goals/goal6
- United Nations (n.d.) Sustainable Development Goal 7: Affordable and Clean Energy. Available at: https://sdgs.un.org/goals/goal7
- United Nations (n.d.) Sustainable Development Goal 9: Industry, Innovation and Infrastructure. Available at: https://sdgs.un.org/goals/goal9
- United Nations (n.d.) Sustainable Development Goal 11: Sustainable Cities and Communities. Available at: https://sdgs.un.org/goals/goal11
- United Nations (n.d.) Sustainable Development Goal 13: Climate Action. Available at: https://sdgs.un.org/goals/goal13
- United Nations (n.d.) Sustainable Development Goal 15: Life on Land. Available at: https://sdgs.un.org/goals/goal15
- UNDRR (n.d.) Early Warnings for All. Available at: https://www.undrr.org/early-warnings-for-all
- U.S. Environmental Protection Agency (n.d.) Air Sensor Toolbox. Available at: https://www.epa.gov/air-sensor-toolbox
- U.S. Geological Survey (2019) National Field Manual for the Collection of Water-Quality Data. Available at: https://www.usgs.gov/mission-areas/water-resources/science/national-field-manual-collection-water-quality-data-nfm
- World Meteorological Organization (n.d.) Early Warnings for All. Available at: https://wmo.int/activities/early-warnings-all