
Last Updated May 28, 2026
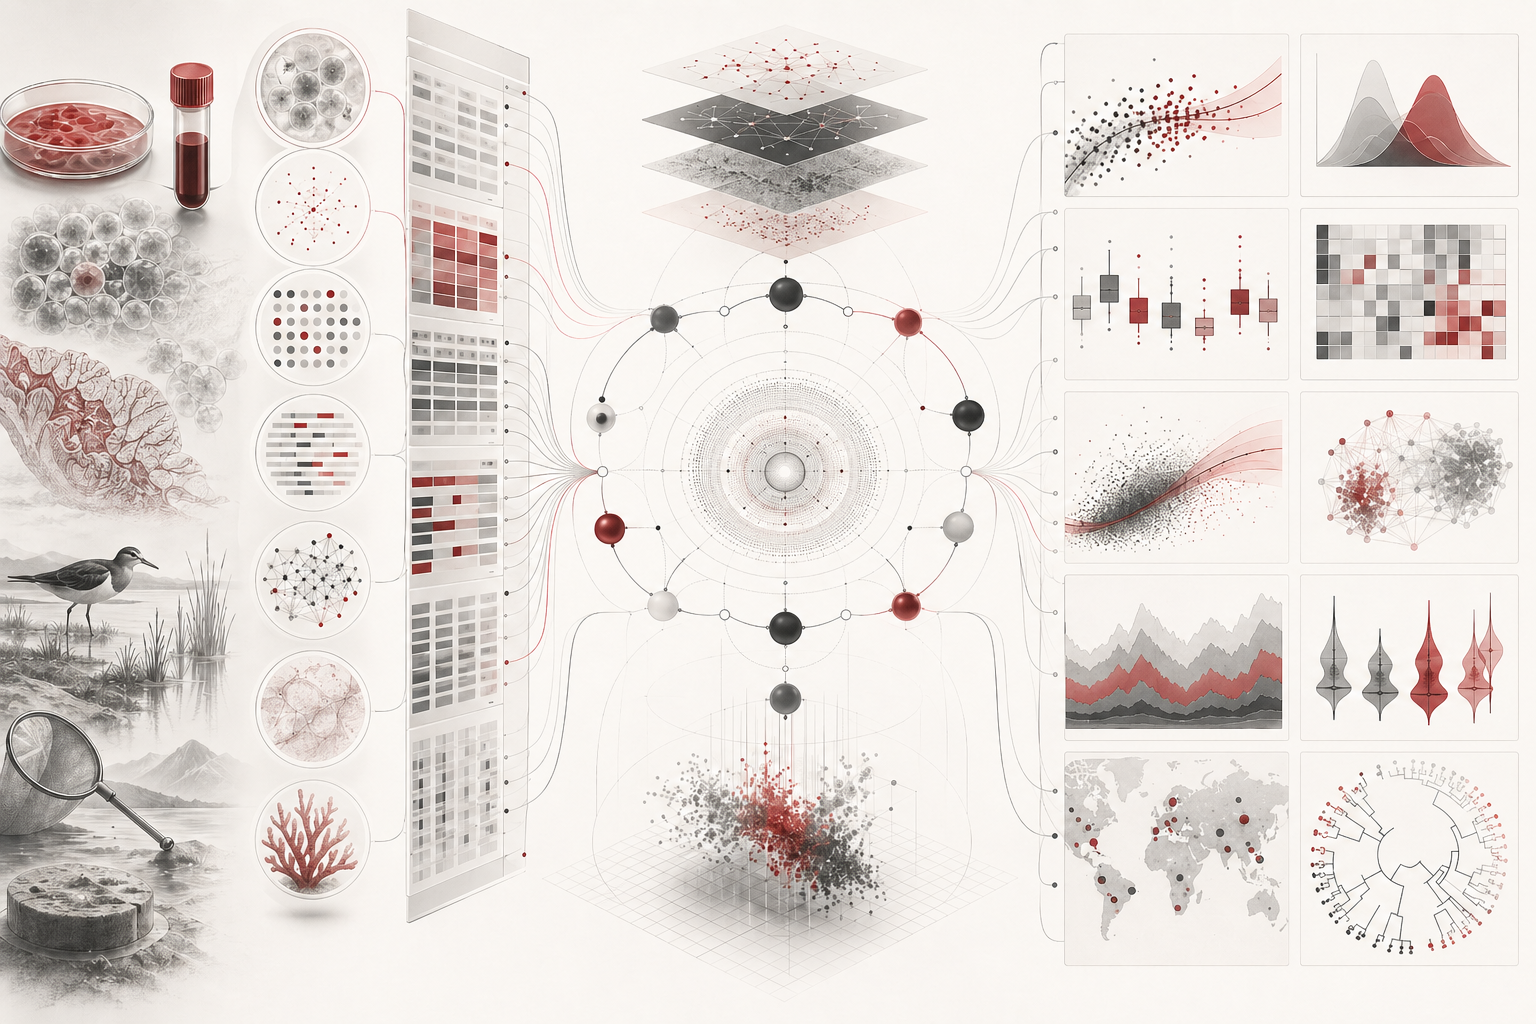
R for biological data analysis and visualization gives life scientists a rigorous, reproducible language for moving from messy observations to defensible biological evidence: importing data, cleaning records, modeling uncertainty, summarizing variation, visualizing patterns, testing hypotheses, and communicating results through transparent computational workflows. In modern biology, data are everywhere: gene-expression matrices, ecological surveys, microbiome tables, assay readouts, physiological traces, sequencing metadata, biodiversity observations, imaging measurements, field records, and simulation outputs. The challenge is not only collecting biological data. The challenge is making those data interpretable, reproducible, statistically responsible, and visually intelligible.
This article introduces R as a core tool for biological data analysis and visualization. It explains why R remains especially valuable in the life sciences: it combines statistical depth, strong visualization tools, reproducible scripting, literate programming, ecological and biomedical packages, Bioconductor infrastructure, and a large scientific community. R is not merely a plotting tool or a statistics calculator. Used well, it becomes a complete analytical environment for life-science reasoning.
Main Library
Publications
Article Map
Biology
Related Topic
Mathematical Modeling
Related Topic
Environmental Science
Related Topic
Chemistry
The article is written for biologists, ecologists, marine biologists, biomedical researchers, laboratory scientists, computational biologists, statisticians, data scientists, biotechnology teams, environmental scientists, engineers, and scientific readers who want to analyze biological data responsibly. It emphasizes practical workflows: data import, tidy data, metadata, quality control, exploratory analysis, visualization, statistical modeling, uncertainty, reproducible reports, and transparent code organization.
The article also extends the discussion into reproducible computational practice through R-first workflows, tidyverse-style data handling, ggplot2 visualization, base R statistical summaries, ecological count analysis, assay quality control, biological measurement uncertainty, reproducible reports, SQL-backed metadata, Python validation helpers, and a linked full-stack GitHub repository containing R, Python, Julia, Fortran, Rust, Go, C, C++, SQL, notebooks, data files, validation notes, and reproducibility documentation.
Why R matters for biology
R matters for biology because biological research is statistical, visual, and reproducible by nature. Life scientists rarely work with perfectly controlled, perfectly clean, perfectly balanced data. They work with variation: variation among organisms, tissues, cells, ecosystems, instruments, observers, batches, locations, seasons, genes, populations, treatments, and environments. R was built for statistical computing and graphics, which makes it especially well suited to the analytical structure of biological evidence.
A biological dataset usually needs several steps before it can support a claim. Samples must be identified. Variables must be defined. Units must be checked. Missing values must be handled. Quality-control flags must be interpreted. Groups must be compared. Variation must be quantified. Visual patterns must be inspected. Models must be fit. Assumptions must be checked. Results must be communicated. R allows these steps to live in code rather than in memory, manual spreadsheet operations, or undocumented software clicks.
R is also valuable because it supports both breadth and depth. A beginner can use it to summarize a small assay table. An ecologist can use it to visualize species counts. A microbiologist can use it to analyze microbial community profiles. A geneticist can use Bioconductor packages for high-throughput data structures. A statistician can build models directly. A computational biologist can combine R with SQL, Python, shell scripts, version control, and reproducible reports.
The deeper point is that R helps turn biological analysis into a workflow. It allows the scientist to ask: what data were used, how were they cleaned, which assumptions were made, which plots were generated, which model was fit, and can the result be reproduced?
Biological data are messy, contextual, and structured
Biological data are rarely simple tables of independent numbers. A single row may represent a sample, an organism, a plot, a cell, a tissue section, a sequencing library, a time point, an experimental unit, or a measurement event. A column may represent a treatment, species, gene, metabolite, observation date, instrument, batch, location, concentration, abundance, survival status, or uncertainty estimate. The meaning of each value depends on biological and methodological context.
This is why biological analysis requires metadata. A gene-expression value without tissue, organism, protocol, library, batch, and normalization context is incomplete. A species count without location, survey effort, observer, date, and sampling method is incomplete. An assay measurement without unit, instrument, calibration, batch, and quality-control flag is incomplete. An image-derived cell measurement without segmentation method and imaging settings is incomplete.
R works well in this setting because it encourages explicit data structures. Data frames, tibbles, lists, matrices, and specialized objects can represent biological observations and their metadata. A well-organized R workflow can separate raw data, cleaned data, metadata, scripts, outputs, figures, and reports. It can also document the transformations that connect them.
Biological data are messy because life is variable and measurement is imperfect. R cannot eliminate that complexity, but it can make the analytical response to complexity visible.
From spreadsheets to reproducible scripts
Spreadsheets are useful for inspection, entry, and communication, but they are risky as the primary analytical environment for scientific inference. Manual filtering, hidden formatting, overwritten cells, inconsistent formulas, and undocumented edits can make results difficult to audit. A spreadsheet can show a table, but it often hides the procedure that produced the table.
R scripts solve a different problem. They preserve the sequence of analytical operations. A script can import a file, check required columns, convert units, remove failed quality-control records, summarize groups, fit models, create figures, export tables, and regenerate results. When combined with version control, scripts also preserve the history of changes.
This matters because reproducibility is not merely a preference. It is part of scientific accountability. A biologist should be able to explain how a figure was generated. A statistician should be able to inspect how missing values were handled. A reviewer should be able to understand which records were excluded. A future collaborator should be able to rerun the analysis when new data arrive.
Moving from spreadsheets to scripts does not mean abandoning practical data handling. It means moving irreversible analytical choices into transparent, reusable code.
Tidy data and biological measurement
Tidy data principles are especially useful in biology. A common tidy-data structure places each variable in a column, each observation in a row, and each type of observational unit in a table. For biological research, this structure clarifies what is being measured and at what level.
For example, an assay table might use one row per sample measurement, with columns for sample identifier, organism, tissue, treatment, batch, value, unit, and quality-control flag. An ecological table might use one row per species observation at a site and time, with columns for site, date, species, count, method, observer, and effort. A physiological table might use one row per individual and time point, with columns for subject, condition, time, biomarker, unit, and instrument.
Tidy structure helps prevent analytical confusion. It distinguishes sample-level variables from measurement-level variables, treatment labels from outcomes, and metadata from results. It also makes plotting, grouping, modeling, and validation easier.
Biology often contains nested and repeated structures: samples within batches, cells within images, plots within sites, repeated measures within organisms, species within communities, genes within pathways. Tidy data does not erase this structure. It makes it easier to represent clearly before choosing appropriate statistical models.
Visualization as biological reasoning
Visualization is not just decoration. In biology, visualization is a form of reasoning. A plot can reveal batch effects, outliers, nonlinear patterns, heteroscedasticity, missingness, group overlap, threshold behavior, measurement drift, ecological gradients, species turnover, assay failure, or unexpected biological variation.
Good biological visualization should respect the data-generating process. Replicates should be visible when possible. Error bars should represent clearly defined uncertainty. Axes should include units. Groups should be distinguishable without misleading visual emphasis. Transformed scales should be explained. Summary statistics should not hide important variation. Plots should show enough structure to support interpretation without overwhelming the reader.
R is powerful here because visualization can be scripted. A figure can be regenerated when data change. A plotting function can be reused across experiments. The same aesthetic logic can be applied consistently across panels. Data cleaning and visualization can be connected in the same workflow.
A good biological plot answers not only “what does the result look like?” but also “what does this reveal about measurement, variation, uncertainty, and biological structure?”
ggplot2 and the grammar of biological graphics
ggplot2 is one of the most important tools in the R ecosystem because it treats graphics as structured objects. Instead of manually drawing chart elements one by one, the analyst maps variables to aesthetics, chooses geometric layers, applies scales, facets data, and controls themes. This grammar-of-graphics approach is especially useful in biology because biological plots often need to show multiple dimensions at once: treatment, time, organism, tissue, batch, site, abundance, uncertainty, and grouping structure.
A ggplot2 workflow usually begins with a dataset and an aesthetic mapping. A point layer can show individual observations. A boxplot layer can summarize distributions. A smooth layer can reveal trends. Facets can separate tissues, sites, species, or treatments. Color, shape, and line type can represent categorical biological variables. Error bars and ribbons can show uncertainty.
The grammar approach encourages clarity. It asks the scientist to decide which biological variables matter and how they should be encoded visually. It also discourages one-off figure manipulation because the plot is built from code. A figure becomes a reproducible scientific object.
In biological contexts, ggplot2 is useful for assay comparisons, time series, dose-response curves, ecological gradients, biodiversity summaries, gene-expression plots, quality-control diagnostics, and publication-ready figures.
Biostatistics in R
R is widely used for biostatistics because it integrates data preparation, exploratory analysis, statistical modeling, and visualization. Common biological analyses include group comparisons, linear models, generalized linear models, mixed-effects models, survival analysis, repeated-measures analysis, regression, correlation, ordination, permutation tests, bootstrap confidence intervals, and simulation.
The statistical strength of R comes from its openness and extensibility. Base R includes many foundational statistical tools, while CRAN and Bioconductor provide specialized packages for particular domains. This makes R useful across small laboratory studies, ecological fieldwork, high-throughput biology, and computational modeling.
But statistical power also creates responsibility. R will fit a model even when the model is inappropriate. It will produce a p-value even when the design is weak. It will generate a beautiful plot even when the data are biased. The analyst must still understand experimental design, sampling, replication, independence, missingness, confounding, uncertainty, and biological plausibility.
R is not a substitute for statistical judgment. It is a language for making statistical judgment explicit.
Ecological and biodiversity analysis
R is especially important in ecology and biodiversity science. Ecological data often include species counts, community matrices, site metadata, environmental gradients, spatial information, repeated observations, detection issues, and complex sampling designs. R can help organize these data, calculate diversity indices, summarize abundance, visualize community structure, fit models, and connect ecological evidence to reproducible workflows.
A species-by-site matrix, for example, can be used to calculate richness, Shannon diversity, evenness, Bray-Curtis dissimilarity, and ordination. Site metadata can then be linked to habitat, disturbance, restoration treatment, temperature, salinity, nutrient levels, or land-use variables. Visualization can reveal ecological gradients and group differences before formal modeling.
Ecological analysis requires particular caution. Species absence may reflect non-detection rather than true absence. Counts depend on effort. Sampling design shapes inference. Spatial autocorrelation can violate independence. Seasonal timing matters. Rare species can affect diversity metrics. Community composition can change in nonlinear ways.
R provides tools for these problems, but the ecological question must guide the workflow.
Bioconductor and high-throughput biology
Bioconductor is central to R’s role in high-throughput biology. Genomics, transcriptomics, epigenomics, proteomics, single-cell biology, and other large-scale biological datasets require specialized data structures and methods. Bioconductor provides infrastructure for organizing assays, sample metadata, genomic ranges, annotations, experimental design, normalization, differential analysis, and reproducible workflows.
High-throughput biology is challenging because the data are large, structured, and technically complex. A gene-expression matrix is not just a matrix. It is tied to samples, features, annotations, batches, protocols, normalization choices, and statistical assumptions. Specialized objects help keep assays and metadata connected so that analysis remains interpretable.
Bioconductor also reflects a broader principle: biological analysis should preserve structure. Genomic coordinates matter. Sample metadata matter. Feature annotations matter. Batch structure matters. Experimental design matters. A reproducible workflow must keep these relationships intact.
For many life-science researchers, the combination of R, Bioconductor, ggplot2, and reproducible reporting creates a complete environment for high-throughput biological analysis.
Quality control, metadata, and provenance
Quality control should be built into R workflows from the beginning. A script can check whether required columns exist, whether units are consistent, whether sample identifiers are unique, whether quality-control flags use valid values, whether missingness exceeds thresholds, whether replicate agreement is plausible, and whether batch structure needs inspection.
Metadata should be imported and joined deliberately. Sample metadata, assay metadata, site metadata, instrument metadata, and processing metadata should be treated as data rather than comments scattered across notebooks. A data dictionary should define columns, units, allowed values, and missing-data conventions.
Provenance records the history of data transformations. In R, provenance can be supported through project structure, scripts, readme files, file manifests, session information, package versions, Git commits, checksums, and reproducible reports. The goal is to make the analytical path inspectable: from raw data to cleaned data, from cleaned data to summary tables, from summary tables to models, and from models to figures.
Biological results are stronger when they are traceable.
Reproducible reports and scientific communication
R supports reproducible reporting through tools such as Quarto and R Markdown. These tools combine prose, code, results, tables, and figures in a single document. When the data or code change, the report can be regenerated. This reduces the risk of mismatched figures, outdated tables, and manually copied results.
For biology, reproducible reports are useful at multiple levels. A lab may use them for quality-control summaries. A field project may use them for monitoring reports. A genomic analysis may use them for pipeline documentation. A manuscript may use them for figures and supplemental analyses. A teaching workflow may use them to connect code, explanation, and biological interpretation.
Reproducible communication matters because scientific claims are not only results. They are arguments supported by methods, data, analysis, uncertainty, and interpretation. R-based reports help keep these elements connected.
The best reports are not code dumps. They are structured scientific narratives where code supports evidence and evidence supports claims.
Mathematical lens: statistical summaries in R
Several mathematical ideas appear repeatedly in R-based biological analysis. These expressions do not replace study design, biological interpretation, statistical diagnostics, or domain expertise. They help clarify how central tendency, dispersion, uncertainty, relative change, richness, diversity, and linear relationships can be represented formally.
Sample mean
\bar{x}=\frac{1}{n}\sum_{i=1}^{n}x_i
\]
Interpretation: The mean summarizes central tendency for a numeric biological measurement, but it should be interpreted alongside variation, distribution shape, sampling design, and measurement context.
Sample variance
s^2=\frac{1}{n-1}\sum_{i=1}^{n}(x_i-\bar{x})^2
\]
Interpretation: Variance measures dispersion among observations. In biological data, high variance may reflect real heterogeneity, measurement noise, batch effects, or sampling structure.
Standard error
SE=\frac{s}{\sqrt{n}}
\]
Interpretation: The standard error summarizes uncertainty in an estimated mean under model assumptions. It should not be confused with biological variability among observations.
Coefficient of variation
CV=\frac{s}{\bar{x}}
\]
Interpretation: The coefficient of variation compares relative variability across measurements with different scales. It is useful for quality control, assay comparison, and biological variability summaries.
Log fold change
LFC=\log_2\left(\frac{\bar{x}_{treatment}}{\bar{x}_{control}}\right)
\]
Interpretation: Log fold change is common in gene expression, assay response, and comparative biological measurement. It should be interpreted with attention to scale, baseline values, uncertainty, and pseudocount choices when needed.
Richness
S=\sum_{i=1}^{p}I(n_i>0)
\]
Interpretation: Richness counts the number of observed taxa or categories with nonzero abundance. It is sensitive to sampling effort, detection probability, and taxonomic resolution.
Shannon diversity
H’=-\sum_{i=1}^{p}p_i\log(p_i)
\]
Interpretation: Shannon diversity combines richness and relative abundance. It summarizes community structure but should be interpreted with field methods and sampling effort in mind.
Linear model
y_i=\beta_0+\beta_1x_i+\epsilon_i
\]
Interpretation: Linear models are useful for estimating relationships, but biological interpretation depends on design, assumptions, residuals, uncertainty, and context.
R workflows
The following examples are compact article-level workflows. The full GitHub repository expands them into richer multi-language implementations with SQL provenance, validation notes, plots, data dictionaries, and reproducible scaffolding.
R example: biological measurement quality summary
# Biological measurement quality summary.
#
# Example uses:
# assay values, biomarker readings, physiological measurements,
# field sensor data, microscopy-derived features, or laboratory observations.

measurements <- data.frame(
  sample_id = paste0("sample_", sprintf("%02d", 1:12)),
  treatment = rep(c("control", "treated"), each = 6),
  value = c(10.2, 10.5, 10.1, 10.4, 10.3, 10.6,
            12.1, 12.4, 11.9, 12.8, NA, 12.5),
  unit = "mmol/L",
  qc_flag = c("pass", "pass", "pass", "pass", "pass", "pass",
              "pass", "pass", "pass", "review", "fail", "pass")
)

valid_data <- measurements[
  measurements$qc_flag == "pass" & !is.na(measurements$value),
]

summary_by_treatment <- aggregate(
  value ~ treatment,
  data = valid_data,
  FUN = function(x) {
    c(
      n = length(x),
      mean = mean(x),
      sd = sd(x),
      se = sd(x) / sqrt(length(x)),
      cv = sd(x) / mean(x)
    )
  }
)

summary_table <- do.call(
  data.frame,
  summary_by_treatment
)

print(round(summary_table, 4))
R example: ggplot2 assay visualization
# Assay visualization with ggplot2.
#
# This example keeps individual observations visible while also
# showing group-level summaries.

library(ggplot2)

measurements <- data.frame(
  sample_id = paste0("sample_", sprintf("%02d", 1:16)),
  treatment = rep(c("control", "treated"), each = 8),
  value = c(10.2, 10.5, 10.1, 10.4, 10.3, 10.6, 10.7, 10.4,
            12.1, 12.4, 11.9, 12.8, 12.0, 12.5, 12.7, 12.3)
)

plot_obj <- ggplot(measurements, aes(x = treatment, y = value)) +
  geom_boxplot(outlier.shape = NA, width = 0.5) +
  geom_jitter(width = 0.08, height = 0, alpha = 0.8) +
  labs(
    title = "Biological assay values by treatment",
    x = "Treatment",
    y = "Measurement value"
  ) +
  theme_minimal(base_size = 12)

print(plot_obj)
R example: ecological diversity from species counts
# Ecological richness and Shannon diversity from species counts.
#
# Example uses:
# field surveys, marine transects, restoration monitoring,
# microbial community tables, or biodiversity inventories.

species_counts <- data.frame(
  site = c("reef_A", "reef_A", "reef_A", "reef_B", "reef_B", "reef_B"),
  species = c("sp_1", "sp_2", "sp_3", "sp_1", "sp_2", "sp_3"),
  count = c(18, 7, 3, 10, 11, 9)
)

shannon_diversity <- function(counts) {
  positive_counts <- counts[counts > 0]
  proportions <- positive_counts / sum(positive_counts)
  -sum(proportions * log(proportions))
}

site_summary <- aggregate(
  count ~ site,
  data = species_counts,
  FUN = function(x) {
    c(
      total_abundance = sum(x),
      richness = sum(x > 0),
      shannon = shannon_diversity(x)
    )
  }
)

summary_table <- do.call(data.frame, site_summary)

print(round(summary_table, 4))
R example: dose-response visualization
# Dose-response visualization.
#
# The curve here is descriptive, not a validated pharmacological model.

library(ggplot2)

dose_data <- data.frame(
  dose = rep(c(0, 1, 3, 10, 30, 100), each = 4),
  response = c(
    0.05, 0.03, 0.06, 0.04,
    0.12, 0.15, 0.11, 0.13,
    0.25, 0.28, 0.22, 0.27,
    0.54, 0.58, 0.51, 0.56,
    0.78, 0.82, 0.76, 0.80,
    0.91, 0.94, 0.89, 0.93
  )
)

plot_obj <- ggplot(dose_data, aes(x = dose, y = response)) +
  geom_point(alpha = 0.8) +
  geom_smooth(method = "loess", se = TRUE) +
  scale_x_continuous(trans = "log10") +
  labs(
    title = "Dose-response pattern",
    x = "Dose",
    y = "Response"
  ) +
  theme_minimal(base_size = 12)

print(plot_obj)
R example: reproducibility session record
# Reproducibility record.
#
# sessionInfo() captures R version, platform, and attached packages.
# In a full project, store this output with analysis results.

analysis_manifest <- data.frame(
  artifact = c("raw_measurements.csv", "clean_measurements.csv", "analysis.R", "figure_assay.png"),
  role = c("input", "processed", "code", "output"),
  status = c("archived", "generated", "versioned", "generated")
)

print(analysis_manifest)

sessionInfo()GitHub repository
The article body includes compact R examples so the scientific argument remains readable. The full repository expands those examples into a rigorous R-first biological data analysis and visualization workflow, including measurement-quality summaries, ggplot2-ready plotting scripts, ecological diversity summaries, dose-response visualization, data dictionaries, metadata validation, SQL provenance structures, reproducible reports, cross-language validation helpers, and full-stack scientific-computing examples across R, Python, Julia, Fortran, Rust, Go, C, C++, SQL, and notebooks.
The full code distribution for this article, including selected article examples, expanded computational workflows, reproducible data structures, provenance documentation, validation notes, and full-stack scientific-computing scaffolding, is available on GitHub.
Limits, responsible use, and common pitfalls
R is powerful, but it does not protect analysts from poor study design, inappropriate models, unclear variables, missing metadata, hidden batch effects, or overinterpreted plots. A well-written R script can still produce weak science if the biological question, sampling design, or statistical assumptions are flawed.
Common pitfalls include treating technical replicates as biological replicates, ignoring batch effects, filtering outliers without predefined criteria, using bar plots that hide individual observations, reporting p-values without effect sizes, failing to check model assumptions, mixing units, joining tables incorrectly, and saving only final outputs without code or provenance.
Another pitfall is confusing reproducibility with correctness. A script may be perfectly reproducible and still wrong. Reproducibility means others can inspect, rerun, and challenge the work. It does not guarantee that the biological interpretation is valid.
Responsible R-based biology therefore requires domain knowledge, statistical reasoning, data stewardship, transparent documentation, and humility about uncertainty.
Why R-based biological analysis matters
R-based biological analysis matters because life-science evidence increasingly depends on computation. Biological claims are shaped by data cleaning, transformations, filtering, models, plots, and reports. If those steps are hidden, the evidence becomes difficult to trust. If they are written in transparent code, the analysis becomes inspectable.
R also matters because it bridges communities. Ecologists, biostatisticians, genomics researchers, epidemiologists, biomedical scientists, microbiome researchers, environmental scientists, and data scientists all use R, often with different packages and traditions. This shared language helps biological knowledge move across fields.
Finally, R matters because it supports the full arc of scientific work: exploration, analysis, visualization, reporting, and reuse. For biological science, that arc is essential. Data must become evidence, evidence must become interpretation, and interpretation must remain connected to the workflow that produced it.
Conclusion
R for biological data analysis and visualization gives life scientists a rigorous language for working with variation, measurement, uncertainty, and complexity. It helps researchers move from raw observations to cleaned data, from cleaned data to summaries, from summaries to models, from models to figures, and from figures to reproducible scientific communication.
The strength of R lies not only in its packages, but in its workflow logic. It encourages analysis as a transparent sequence of steps: import, validate, clean, transform, visualize, model, document, and share. For biology, this matters because evidence is always shaped by measurement, context, and interpretation.
Used responsibly, R helps make biological research more reproducible, more visual, more statistically grounded, and more trustworthy.
Related articles
- Biology
- R for Biostatistics, Ecology, and Genomics
- Data, Measurement, and Reproducibility in the Life Sciences
- Statistics, Uncertainty, and Measurement in Biology
- Biostatistics and Experimental Design in Biology
- Probability, Variation, and Biological Inference
- Mathematical Biology and the Logic of Living Systems
- Networks, Systems, and Biological Complexity
- Population Dynamics and Ecological Modeling
- Ecology and the Interdependence of Life
- Genomics and the Expansion of Biological Knowledge
- Observation, Experiment, and the Methods of Biological Inquiry
Further reading
- R Core Team (2026) The R Project for Statistical Computing. Available at: https://www.r-project.org/
- Wickham, H., Çetinkaya-Rundel, M. and Grolemund, G. (2023) R for Data Science. 2nd edn. Available at: https://r4ds.hadley.nz/
- Wickham, H. et al. (2026) ggplot2: Create Elegant Data Visualisations Using the Grammar of Graphics. Available at: https://ggplot2.tidyverse.org/
- Tidyverse Team (2026) Tidyverse: R Packages for Data Science. Available at: https://tidyverse.org/
- Bioconductor (2026) Open Source Software for Bioinformatics. Available at: https://www.bioconductor.org/
- Bioconductor (2017) Introduction to Bioconductor. Available at: https://www.bioconductor.org/help/course-materials/2017/OSU/B1_Bioconductor_intro.html
- Oksanen, J. et al. (2025) vegan: Community Ecology Package. Available at: https://cran.r-project.org/web/packages/vegan/index.html
- Landau, W.M. (2025) targets: Dynamic Function-Oriented Make-Like Declarative Pipelines. Available at: https://cran.r-project.org/web/packages/targets/index.html
- Posit (n.d.) Quarto: Open-Source Scientific and Technical Publishing System. Available at: https://quarto.org/
- Wickham, H. (2016) ggplot2: Elegant Graphics for Data Analysis. 2nd edn. Cham: Springer.
References
- Bioconductor (2026) Open Source Software for Bioinformatics. Available at: https://www.bioconductor.org/
- Bioconductor (2017) Introduction to Bioconductor. Available at: https://www.bioconductor.org/help/course-materials/2017/OSU/B1_Bioconductor_intro.html
- Landau, W.M. (2025) targets: Dynamic Function-Oriented Make-Like Declarative Pipelines. Available at: https://cran.r-project.org/web/packages/targets/index.html
- Oksanen, J. et al. (2025) vegan: Community Ecology Package. Available at: https://cran.r-project.org/web/packages/vegan/index.html
- R Core Team (2026) The R Project for Statistical Computing. Available at: https://www.r-project.org/
- Posit (n.d.) Quarto: Open-Source Scientific and Technical Publishing System. Available at: https://quarto.org/
- Tidyverse Team (2026) Tidyverse: R Packages for Data Science. Available at: https://tidyverse.org/
- Wickham, H. (2016) ggplot2: Elegant Graphics for Data Analysis. 2nd edn. Cham: Springer.
- Wickham, H. et al. (2026) ggplot2: Create Elegant Data Visualisations Using the Grammar of Graphics. Available at: https://ggplot2.tidyverse.org/
- Wickham, H., Çetinkaya-Rundel, M. and Grolemund, G. (2023) R for Data Science. 2nd edn. Available at: https://r4ds.hadley.nz/