
Last Updated May 28, 2026
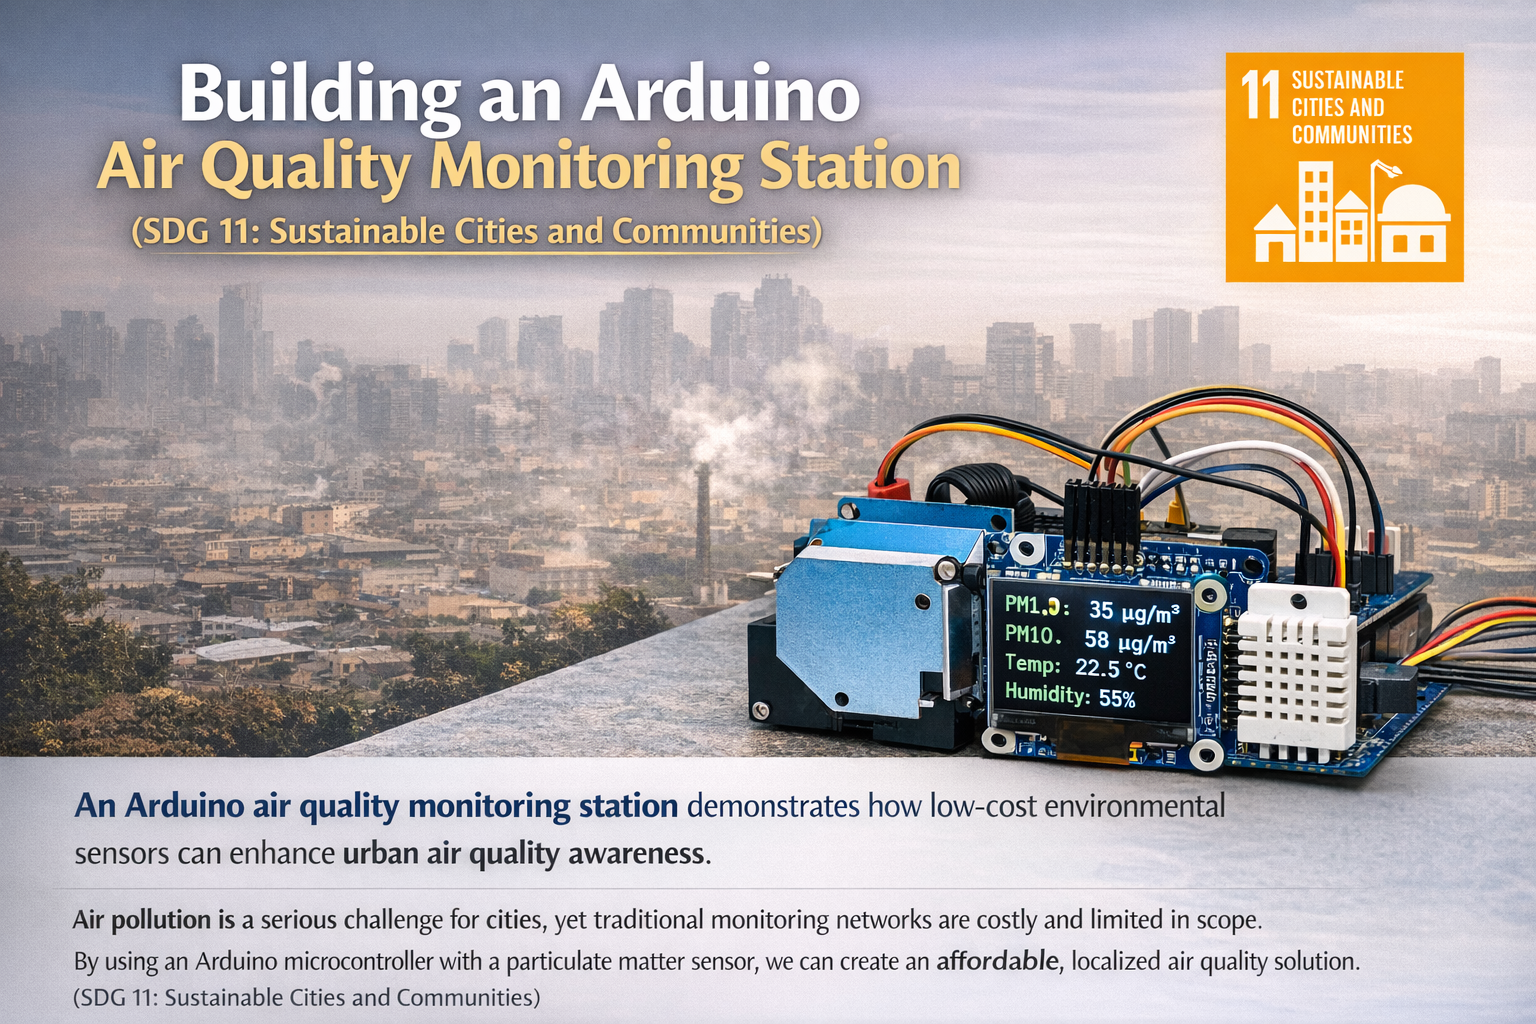
An Arduino air quality monitoring station demonstrates how low-cost environmental sensing can support healthier, more sustainable cities. Air pollution remains one of the most consequential environmental risks worldwide, yet official monitoring infrastructure is often sparse, expensive, and unevenly distributed across neighborhoods, campuses, industrial corridors, transport corridors, and smaller communities.
By combining an Arduino-compatible microcontroller with a particulate matter sensor and atmospheric sensing hardware, it is possible to build a compact monitoring station capable of recording local environmental conditions at relatively low cost. This project is not a substitute for certified regulatory instrumentation, medical advice, or official air-quality reporting. Instead, it illustrates an important systems principle: distributed environmental sensing can improve urban environmental awareness, neighborhood-scale monitoring capacity, and data-informed learning about the conditions people breathe every day.
The deeper lesson is not simply that an Arduino can display particulate readings. The deeper lesson is that sustainable cities require feedback systems. Air quality is shaped by transport, industry, buildings, heating systems, wildfires, construction, weather, and land-use patterns. When those conditions are measured more locally, they become easier to discuss, compare, investigate, and improve.
Main Library
Publications
Project Series
Arduino SDG Projects
Related Topic
Environmental Monitoring
Related Topic
Infrastructure Systems
Related Topic
Atmospheric Aerosols
This project also connects to broader site areas, including Environmental Monitoring Systems, Intelligent Infrastructure Systems, Atmospheric Aerosol Loading and Regional Planetary Risk, Climate Change as a Planetary Boundary, Sustainable Development Goals Within Planetary Boundaries, and Planetary Boundaries. In that wider context, this air quality monitor is not only a maker project. It is a small prototype of the sensing, feedback, calibration, and public-awareness infrastructure needed for healthier cities, environmental accountability, and more responsive urban systems.
Abstract
This project presents a prototype Arduino air quality monitoring station built around a particulate matter sensor, a temperature and humidity sensor, and a microcontroller-based data acquisition loop. The station measures airborne particulate concentrations and environmental conditions, then reports the readings through the Serial Monitor for interpretation and later expansion.
From an engineering perspective, the system demonstrates a distributed environmental sensing architecture: air enters a sensor chamber, optical measurements are converted into particulate estimates, structured data frames are parsed by firmware, and readings are reported as telemetry. From an urban sustainability perspective, the project shows how low-cost monitoring systems can expand neighborhood-scale environmental awareness and support more resilient city infrastructure.
The project is intentionally educational. It should be used to understand sensing, calibration, placement, uncertainty, trend detection, and data interpretation. It should not be used as a certified regulatory monitor, medical exposure device, or sole basis for enforcement decisions.
SDG Alignment: Cities, Health, Infrastructure, Climate, and Environmental Justice
This project connects most directly to SDG 11: Sustainable Cities and Communities, especially the goal of reducing the adverse environmental impact of cities with attention to air quality. Air pollution is not only an atmospheric condition; it is a social, infrastructural, and public-health issue shaped by transport systems, industrial activity, building energy use, land-use decisions, urban density, and environmental governance.
The project also connects strongly to public health because fine particulate pollution is associated with respiratory and cardiovascular risks. Low-cost monitoring cannot replace official monitoring networks, but it can help students, residents, educators, and community groups observe how local conditions change across streets, times of day, weather conditions, seasons, indoor-outdoor transitions, and pollution events.
| Sustainable Development Goal | How the Project Relates | Project-Level Mechanism |
|---|---|---|
| SDG 11: Sustainable Cities and Communities | Supports awareness of urban environmental conditions and local air-quality variation. | Neighborhood-scale PM monitoring, temperature-humidity context, and distributed sensing. |
| SDG 3: Good Health and Well-Being | Connects to respiratory and cardiovascular health risks associated with air pollution exposure. | PM2.5 and PM10 readings that make particulate exposure conditions more visible. |
| SDG 9: Industry, Innovation and Infrastructure | Demonstrates low-cost environmental instrumentation and distributed urban sensing infrastructure. | Sensor hardware, serial data parsing, telemetry, calibration, and reproducible documentation. |
| SDG 12: Responsible Consumption and Production | Increases visibility into pollution-generating systems, material activity, combustion, dust, and waste-related air impacts. | Comparative readings across activities, locations, and conditions that reveal particulate sources and patterns. |
| SDG 13: Climate Action | Connects to combustion systems, transport emissions, wildfire smoke, and climate-linked air-quality events. | Local monitoring of particulate episodes that may be linked to energy use, traffic, heating, fires, and atmospheric conditions. |
The strongest SDG connection is SDG 11. Cities become more sustainable when environmental conditions are visible enough to support better decisions. A monitoring station does not solve air pollution by itself, but it can help reveal when and where air conditions change. That visibility matters for schools, neighborhoods, public buildings, transit corridors, community science, and environmental education.
The connection to SDG 3 is direct but must be framed carefully. This project does not measure personal health outcomes and should not be used for medical advice. Its value is that it makes particulate conditions more observable. That can support public-health literacy by helping readers understand why PM2.5, PM10, ventilation, combustion, dust, smoke, and urban activity matter.
The connection to SDG 9 comes through instrumentation and infrastructure. The project combines sensing hardware, firmware, serial communication, measurement interpretation, calibration, and documentation into a reproducible prototype. Sustainable infrastructure is not only roads, pipes, and power lines. It also includes sensor networks, data systems, monitoring stations, and public feedback loops that help cities understand the conditions they create.
The connection to SDG 12 appears through pollution visibility. Production, consumption, transport, heating, cooking, construction, demolition, waste handling, and material movement can all affect local particulate levels. A sensor station cannot identify every source by itself, but it can help reveal when activities generate measurable environmental signals.
The connection to SDG 13 is indirect but important. Greenhouse gases and particulate pollution are different problems, but they often share infrastructure roots in fossil-fuel combustion, transport, heating, industry, and wildfire risk. Monitoring particulate matter can help make some climate-adjacent air-quality conditions more tangible, especially during smoke, heat, stagnation, and combustion-related events.
The environmental justice dimension is also important. Air pollution exposure is often unevenly distributed. Communities near highways, freight corridors, industrial zones, ports, waste facilities, and poorly ventilated buildings may experience different air-quality conditions from communities with cleaner infrastructure and lower exposure burdens. Low-cost monitoring does not automatically correct that inequality, and poor-quality data can even mislead if interpreted irresponsibly. But carefully validated community monitoring can help make unequal environmental burdens more visible.
Because the Sustainable Development Goals are broad public frameworks, it is important not to overclaim. This project is not a certified urban air-monitoring network, not a regulatory instrument, and not a substitute for public-health agencies or environmental regulators. Its contribution is narrower and still valuable: it teaches the measurement logic behind air-quality monitoring and shows how low-cost prototypes can make SDG concepts tangible through sensors, calibration, data logging, placement decisions, and responsible interpretation.
Connections to Other Site Areas
This air quality monitoring station belongs to a wider body of work on sensing, environmental data, and urban infrastructure. It connects directly to Environmental Monitoring Systems, where air sensors, field data, remote sensing, and monitoring networks become tools for understanding ecological and public-health conditions.
It also connects to Intelligent Infrastructure Systems. Cities increasingly need infrastructure that can sense environmental conditions, report changes, support early warning, and inform decisions about transport, zoning, building systems, public health, and neighborhood resilience.
At the planetary-boundary level, the project relates to Atmospheric Aerosol Loading and Regional Planetary Risk. Particulate pollution is not only a local air-quality issue. It also intersects with atmospheric chemistry, cloud processes, regional climate effects, monsoon dynamics, visibility, ecosystem effects, and human health.
The project also connects to Climate Change as a Planetary Boundary because many particulate pollution sources are linked to combustion-based energy, transport, and industrial systems. Although greenhouse gases and particulate pollution are not the same problem, they often share infrastructure roots in fossil-fuel-dependent systems.
System Architecture
The monitoring station functions as a simple environmental sensing pipeline:
- Sensor layer: particulate sensor and atmospheric sensor measure local environmental conditions.
- Acquisition layer: the Arduino reads sensor data from serial and digital interfaces.
- Processing layer: firmware parses frames, checks basic validity, and formats telemetry.
- Output layer: values are reported through the Serial Monitor and can later be displayed, logged, transmitted, or visualized.
Air → PM Sensor + DHT22 → Arduino → Parsing + Telemetry → Display / LoggingThis mirrors the architecture of professional environmental monitoring systems, albeit at a smaller educational scale. In practical deployments, similar systems can be distributed across schools, streets, rooftops, libraries, community centers, or neighborhoods to create denser urban air-quality datasets.
For this prototype, the architecture is intentionally transparent. The purpose is not to hide measurement behind a black box, but to help readers see how physical air movement, optical sensing, serial communication, firmware parsing, environmental context, and interpretation work together.
System Requirements
A useful air-quality monitoring prototype needs more than a sensor and a display. It needs stable power, reliable data parsing, airflow, context, validation, and clear limits on interpretation.
| Requirement | Design Target | Reason |
|---|---|---|
| Particulate sensing | Measure PM1.0, PM2.5, and PM10 values | Supports local observation of airborne particulate conditions |
| Environmental context | Record temperature and humidity | Helps interpret sensor behavior and local conditions |
| Stable power | Provide reliable 5V supply for sensor and microcontroller | Prevents false readings, resets, and serial communication errors |
| Serial parsing | Detect valid sensor frames and reconstruct PM values | Improves data integrity before readings are interpreted |
| Airflow | Keep sensor inlet and outlet unobstructed | Particulate readings depend on air reaching the sensing chamber |
| Validation | Compare readings against known events or nearby reference data when possible | Improves confidence in trend interpretation |
| Deployment scope | Use for education, trend detection, and prototype monitoring | Clarifies that the station is not a certified regulatory instrument |
These requirements can guide future air-sensing projects in the series. Each environmental monitoring build should state not only what it measures, but what conditions must be controlled for those measurements to be meaningful.
Why an Arduino Air Quality Monitoring Station Matters
Government air monitoring stations provide highly accurate data, but they are expensive and geographically sparse. Low-cost sensor stations provide a complementary approach by enabling denser environmental observation at neighborhood, campus, classroom, or household scale.
An Arduino monitoring station demonstrates the core logic behind distributed environmental sensing:
- measure environmental conditions locally
- convert sensor signals into interpretable values
- observe variation across time and location
- support better environmental awareness and urban decision-making
This approach is especially valuable in educational environments, citizen-science initiatives, sustainability laboratories, and community monitoring projects. For urban systems, the ability to observe localized air-quality variation can help make environmental inequality, infrastructure stress, and neighborhood exposure patterns more visible.
Air pollution is often experienced locally before it is understood statistically. A person may smell smoke, notice dust, cough near a roadway, or observe haze before they see a formal air-quality report. Low-cost monitoring helps connect lived environmental experience to measurable signals, while also teaching why careful calibration and interpretation are necessary.
What This Project Measures
- PM1.0: very small airborne particles, often associated with combustion and fine aerosol sources.
- PM2.5: fine particles strongly associated with respiratory and cardiovascular risk.
- PM10: coarse inhalable particles from sources such as dust, construction, roadways, and mechanical disturbance.
- Temperature: environmental context affecting sensor behavior, comfort, urban conditions, and atmospheric interpretation.
- Humidity: environmental context that can influence optical particulate readings and human comfort.
These values provide a contextual picture of local air conditions. In urban environments, particulate readings can help identify episodes associated with traffic congestion, construction activity, industrial operations, wildfire smoke, seasonal heating, cooking, cleaning, or ventilation conditions.
Bill of Materials
- Arduino Mega, Uno, Nano, or compatible microcontroller
- PMS5003 particulate sensor or similar laser-scattering PM sensor
- DHT22 temperature and humidity sensor
- optional OLED or LCD display
- optional microSD module
- breadboard or soldered prototype board
- jumper wires
- stable 5V power supply
- ventilated enclosure for sheltered deployment
- optional real-time clock module for timestamped data logging
Boards with multiple hardware serial interfaces, such as an Arduino Mega, simplify communication with particulate sensors. If using an Arduino Uno or Nano, a software serial interface may be needed, but hardware serial is generally preferable for more reliable sensor communication.
For longer tests, a breadboard should be treated as temporary. Loose wiring, weak USB power, blocked airflow, and unstable enclosures can degrade data quality even when the firmware is correct.
Engineering Specifications
| Parameter | Reference Design |
|---|---|
| Microcontroller | Arduino Mega preferred; Uno or Nano possible with serial adaptation |
| Particulate sensor | PMS5003 or similar serial PM sensor |
| Atmospheric sensor | DHT22 temperature and humidity sensor |
| PM outputs | PM1.0, PM2.5, PM10 |
| Serial baud rate | 9600 baud for PMS5003-style communication |
| Reporting interval | 5 seconds in the reference firmware |
| Power supply | Stable 5V supply recommended |
| Deployment scope | Indoor, sheltered outdoor, classroom, laboratory, or community-science prototype |
| Interpretation scope | Education, trend detection, local comparison, and exploratory monitoring |
Measurement Principle: Optical Particle Sensing
Low-cost particulate sensors typically use laser scattering. Air flows through a sensing chamber where particles scatter light from a laser. The scattered signal is detected by a photodiode and converted into particle concentration estimates.
This method provides useful approximations of particulate concentration but is not equivalent to certified regulatory measurement instruments. Its value lies in trend detection, comparative local monitoring, education, and exploratory environmental analysis rather than legal or regulatory compliance.
Temperature, humidity, airflow, sensor aging, and particle composition can all affect readings. Hygroscopic particles can absorb water under high humidity, changing their optical properties and apparent size. Dust, smoke, soot, pollen, and aerosols may scatter light differently. That is why low-cost air-quality data should be interpreted carefully, especially when making comparisons across locations, seasons, sensor models, or weather conditions.
The most responsible interpretation is comparative and contextual: What changed? When did it change? Was the sensor placement stable? Was humidity high? Was there traffic, cooking, smoke, construction, or ventilation change nearby? Without that context, a number alone can mislead.
Mathematical Lens: From Particle Signal to Interpretable Readings
The air-quality station can be understood as a measurement and interpretation system. The particulate sensor estimates particle concentration, firmware reconstructs values from serial data, repeated readings can be averaged, and logged data can be used to compare local air conditions across time or location.
C=\frac{m}{V}
\]
Interpretation: Particulate concentration is commonly expressed as mass \(m\) of particles per volume \(V\) of air, typically in micrograms per cubic meter.
Low-cost optical sensors estimate this concentration indirectly from scattered light and internal algorithms. The sensor does not weigh particles directly; it infers particulate concentration from optical response and assumed particle properties.
\bar{C}_{2.5}=\frac{1}{n}\sum_{i=1}^{n}C_{2.5,i}
\]
Interpretation: Averaging \(n\) PM2.5 readings can reduce short-term noise and make trend interpretation more stable.
A single reading may be affected by turbulence, sensor noise, serial timing, or short-lived particle events. A rolling average can help reveal persistent conditions without overreacting to every spike.
x = 256h + l
\]
Interpretation: Many particulate sensors encode values as two bytes; the high byte \(h\) and low byte \(l\) must be recombined correctly to recover the measurement.
This is the mathematical logic behind multi-byte reconstruction in the firmware. If the byte order is wrong, the readings will be wrong even if the sensor itself is functioning.
E \approx C \times t
\]
Interpretation: A simple exposure proxy can be estimated by multiplying concentration \(C\) by time \(t\), though real exposure assessment is much more complex.
This equation should not be treated as a medical exposure model. It is a teaching approximation showing why both concentration and duration matter. A short spike and a long period of moderately elevated particulate concentration may have different implications.
\Delta C = C_{\mathrm{event}} – C_{\mathrm{baseline}}
\]
Interpretation: Comparing an event reading with a baseline can help identify how much local particulate conditions changed.
This difference-based view is often the most useful for educational monitoring. Instead of overinterpreting one absolute number, the reader can compare conditions before, during, and after traffic peaks, cooking, cleaning, wildfire-smoke episodes, construction activity, or ventilation changes.
Sensor Communication and Data Frames
The PMS5003 transmits structured serial frames containing particulate measurements. Firmware must detect frame boundaries, parse byte sequences, and reconstruct values correctly.
PM values are encoded as multi-byte integers that must be combined correctly in firmware. A defensible implementation therefore requires at least basic frame validation, clear parsing logic, and readable telemetry output.
A more advanced implementation would add checksum validation, timestamps, rolling averages, data-quality flags, and sensor status indicators so that readings can be logged and interpreted more reliably over time.
For educational purposes, this is one of the strongest parts of the project. It teaches that environmental monitoring is not only about attaching a sensor. It is also about data structure, byte order, validation, error handling, and interpretation.
Circuit Logic, Serial Communication, and Power Stability
The circuit has three core jobs: power the sensors, move data reliably, and protect measurement quality. The particulate sensor contains internal electronics and a small fan, so it requires stable power. Weak USB power, loose wiring, or voltage instability can produce unreliable behavior.
The Arduino reads the particulate sensor through serial communication and reads the DHT22 through a digital data pin. Because serial particulate frames must arrive intact, boards with multiple hardware serial ports are preferable. Arduino Mega boards are convenient because they allow the USB Serial Monitor and sensor serial interface to operate separately.
The station should also be designed around airflow. A sealed enclosure will protect electronics but may block the sensor from the air it is supposed to measure. A useful enclosure must protect the electronics from rain and damage while still allowing representative airflow through the particulate sensor path.
This is a key engineering tradeoff: environmental monitors must be protected from the environment while still being exposed enough to measure it.
Design Assumptions and Constraints
This prototype assumes:
- moderate indoor or sheltered outdoor deployment
- adequate airflow around the sensor inlet and outlet
- stable 5V power supply
- educational, prototype, community-science, or experimental use
- careful interpretation rather than regulatory reporting
- basic telemetry rather than fully validated exposure assessment
This monitoring station is best understood as an urban environmental sensing platform that helps make local air conditions more visible. It is not a certified air-quality instrument and should not be used as the sole basis for medical, regulatory, or enforcement decisions.
The station also assumes that placement is documented. A reading without placement context is difficult to interpret. A sensor near a window, road, kitchen, vent, candle, classroom, workshop, or construction site may be measuring a highly specific local condition.
Wiring Overview
PMS5003 Particulate Sensor
- PMS5003 TX → Arduino RX or Serial1 RX
- PMS5003 RX → Arduino TX or Serial1 TX
- PMS5003 VCC → Arduino 5V
- PMS5003 GND → Arduino GND
DHT22 Temperature and Humidity Sensor
- DHT22 VCC → Arduino 5V
- DHT22 DATA → Arduino D2
- DHT22 GND → Arduino GND
Particulate sensors contain small internal fans and require stable power delivery. If power fluctuates, data quality may degrade and false readings may appear. Use secure wiring, avoid loose breadboard connections for longer tests, and provide airflow around the sensor inlet and outlet.
If using an Arduino Uno or Nano, adjust the firmware for SoftwareSerial or an alternate serial connection. If using an Arduino Mega, Serial1 can communicate with the particulate sensor while Serial remains available for the Serial Monitor.
Electrical and Deployment Considerations
Proper placement improves measurement quality. For better results:
- ensure unobstructed airflow around the particulate sensor
- avoid direct proximity to heat sources unless that source is the object of study
- avoid high-moisture zones or condensation exposure
- allow sensor warm-up time before interpreting readings
- avoid blocking the sensor inlet or outlet inside an enclosure
- record placement conditions so readings can be interpreted later
- keep electronics protected from rain, splashes, dust accumulation, and physical impact
Outdoor stations should be protected from rain while still allowing airflow. In urban monitoring contexts, placement strongly affects representativeness: a sensor mounted near a roadway may capture traffic conditions, while a rooftop sensor may reflect broader atmospheric background conditions.
A careful deployment log should include date, time, location, height above ground, indoor or outdoor context, distance from roads or vents, weather, known local activity, enclosure type, and power source. Without those details, data can easily be misinterpreted.
Firmware Design Goals
The firmware should:
- parse structured particulate frames correctly
- combine sensor measurements into readable telemetry
- handle invalid readings gracefully
- report environmental conditions clearly and consistently
- create a foundation for future logging, dashboards, or alerts
- make calibration and validation easier by printing consistent outputs
These goals improve the reliability, interpretability, and extensibility of the monitoring station.
Basic vs. Advanced Firmware
A minimal version of this project could simply read bytes from the particulate sensor and print values. That approach may be enough for a demonstration, but it is not ideal for a serious educational article because it hides too many engineering concerns.
The advanced version used here adds frame detection, basic length checking, structured data handling, DHT22 error handling, readable telemetry, and comments for extension. These additions make the project easier to validate and easier to adapt for data logging, display output, wireless telemetry, or multi-node monitoring.
For the rest of the Arduino sustainability project series, this distinction should remain consistent. The goal is not to make every project overly complex. The goal is to make each project rigorous enough to teach responsible measurement and interpretation.
Advanced Arduino Code
The firmware below reads particulate data from a PMS5003-style sensor and combines it with temperature and humidity readings from a DHT22. It includes frame detection, basic length checking, DHT error handling, readable telemetry, and comments for later extension.
/*
  Arduino Air Quality Monitoring Station

  Measures:
  - PM1.0, PM2.5, and PM10 using a PMS5003 particulate matter sensor
  - Temperature and humidity using a DHT22 sensor

  Notes:
  - This is prototype firmware for education and experimental monitoring.
  - Low-cost particulate sensors are useful for trends and comparisons,
    but they are not certified regulatory instruments.
  - Sensor placement, airflow, humidity, and calibration strongly affect results.
*/

#include <DHT.h>

// DHT22 configuration.
#define DHTPIN 2
#define DHTTYPE DHT22

DHT dht(DHTPIN, DHTTYPE);

// PMS5003 data frame size after the two-byte header.
const int framePayloadLength = 30;

// Buffer for PMS5003 frame payload.
byte frameBuffer[framePayloadLength];

// PM data structure for cleaner handling.
struct ParticulateReading {
  int pm1;
  int pm25;
  int pm10;
};

bool readPMSFrame(ParticulateReading &reading) {
  /*
    PMS5003 frames typically begin with:
    0x42 0x4D

    This function looks for that header, reads the remaining payload,
    checks the expected frame length bytes, and reconstructs particulate
    values from paired high/low bytes.
  */

  // Wait until enough bytes are available for a complete frame.
  if (Serial1.available() < 32) {
    return false;
  }

  // Check first header byte.
  if (Serial1.read() != 0x42) {
    return false;
  }

  // Check second header byte.
  if (Serial1.read() != 0x4D) {
    return false;
  }

  // Read the remaining 30 bytes into the frame buffer.
  Serial1.readBytes(frameBuffer, framePayloadLength);

  // Basic frame-length check. PMS5003 commonly reports length 28.
  int frameLength = frameBuffer[0] * 256 + frameBuffer[1];

  if (frameLength != 28) {
    return false;
  }

  /*
    Extract particulate concentration values.

    Byte positions depend on sensor frame format. These positions follow
    the common PMS5003 frame structure for atmospheric particulate readings.
  */
  reading.pm1 = frameBuffer[4] * 256 + frameBuffer[5];
  reading.pm25 = frameBuffer[6] * 256 + frameBuffer[7];
  reading.pm10 = frameBuffer[8] * 256 + frameBuffer[9];

  return true;
}

void printTelemetry(
  const ParticulateReading &reading,
  float temperatureC,
  float humidityPercent
) {
  // Print one readable telemetry line for logging or Serial Monitor review.
  Serial.print("PM1.0: ");
  Serial.print(reading.pm1);
  Serial.print(" ug/m3 | PM2.5: ");
  Serial.print(reading.pm25);
  Serial.print(" ug/m3 | PM10: ");
  Serial.print(reading.pm10);
  Serial.print(" ug/m3 | Temp: ");
  Serial.print(temperatureC);
  Serial.print(" C | Humidity: ");
  Serial.print(humidityPercent);
  Serial.println(" %");
}

void setup() {
  // Serial Monitor output.
  Serial.begin(9600);

  /*
    Serial1 is available on boards such as Arduino Mega.
    For Arduino Uno or Nano, use SoftwareSerial or a compatible serial adapter.
  */
  Serial1.begin(9600);

  // Initialize DHT22 sensor.
  dht.begin();

  Serial.println("Arduino Air Quality Monitoring Station");
  Serial.println("Monitoring PM1.0, PM2.5, PM10, temperature, and humidity.");
  Serial.println("----------------------------------------------------------------");
}

void loop() {
  ParticulateReading reading = {0, 0, 0};

  // Read atmospheric context from the DHT22.
  float humidity = dht.readHumidity();
  float temperature = dht.readTemperature();

  // Validate DHT22 readings before reporting telemetry.
  if (isnan(humidity) || isnan(temperature)) {
    Serial.println("DHT22 sensor error: invalid temperature or humidity reading.");
    delay(5000);
    return;
  }

  // Read and parse particulate frame.
  if (readPMSFrame(reading)) {
    printTelemetry(reading, temperature, humidity);
  } else {
    Serial.println("Waiting for valid PMS5003 particulate frame...");
  }

  delay(5000);
}GitHub Repository
The article body includes the core firmware and design explanation so the build remains readable. The full repository expands the project into a reproducible prototype package, including firmware, setup documentation, calibration notes, deployment guidance, bill of materials, example particulate readings, wiring notes, and data-logging materials.
Complete Code Repository
The full code distribution for this project, including Arduino monitoring firmware, setup documentation, calibration notes, deployment guidance, bill of materials, and example particulate readings, is available on GitHub.
The repository contains the complete prototype build materials:
- Arduino monitoring firmware
- bill of materials
- setup guide
- calibration notes
- deployment notes
- example particulate readings
- wiring and data-logging guidance
Repository Structure
arduino-air-quality-monitor/

README.md
LICENSE

BOM.csv

firmware/
  air_quality_monitor.ino

docs/
  setup_guide.md
  calibration.md
  deployment_notes.md
  data_dictionary.md

data/
  example_particulate_readings.csv

hardware/
Engineers can clone the repository, fork the design, or download the complete project using GitHub’s Download ZIP feature. All materials are released under the MIT License to support reuse in research, education, community science, and prototype engineering work.
Code Review and Engineering Notes
- Frame start detection: checking the PMS5003 header helps ensure that readings are parsed from the correct byte sequence.
- Multi-byte reconstruction: particulate values are encoded across high and low bytes and must be reconstructed correctly.
- Length checking: a basic frame-length check improves parsing reliability before interpreting values.
- Environmental context: temperature and humidity readings help interpret sensor behavior and local conditions.
- Telemetry clarity: consistent serial output makes readings easier to log, compare, or feed into dashboards.
- Board choice: using an Arduino Mega avoids conflicts between the USB Serial Monitor and the particulate sensor’s serial interface.
For more advanced implementations, the station could add checksum validation, moving averages, timestamped logging, AQI conversion, OLED display output, wireless telemetry, data-quality flags, or threshold-based alerts.
The code should be understood as a clear educational reference implementation. It improves on a minimal sketch by making the measurement pipeline explicit, but it still remains simple enough for students, educators, and makers to adapt.
Interpreting PM Measurements
Particulate concentrations are typically reported in micrograms per cubic meter. In plain terms:
- PM1.0 describes very small airborne particles often associated with combustion and fine aerosol sources.
- PM2.5 describes fine particles that can penetrate deeply into the respiratory system and are especially important for public-health interpretation.
- PM10 describes larger inhalable particles such as dust, road particles, construction debris, pollen, and mechanically generated aerosols.
PM2.5 is generally the most relevant public-health indicator in urban air-quality discussions. In sustainability work, these measurements help make air-quality variation visible across neighborhoods, land uses, transport corridors, building conditions, and weather patterns.
Because low-cost optical sensors are affected by humidity, airflow, particle composition, and sensor drift, readings should be interpreted as indicative rather than regulatory. The most useful approach is to compare trends over time, observe changes after known events, and validate readings against nearby reference data when possible.
One isolated number should not be overinterpreted. A better practice is to compare readings across time and context: baseline conditions, traffic periods, cooking events, cleaning activity, ventilation changes, wildfire-smoke days, construction dust, and weather shifts.
Failure Modes and Practical Risks
A useful air-monitoring prototype should explain how the system can fail. Low-cost air sensors operate in variable environments, and their readings can be affected by physical placement, humidity, airflow, sensor aging, power stability, and incorrect parsing.
- Humidity interference: high humidity can affect optical particle readings and may inflate apparent particulate values.
- Blocked airflow: an obstructed inlet or outlet can prevent representative air from reaching the sensing chamber.
- Poor placement: readings near windows, vents, kitchens, roads, or enclosed spaces may reflect highly local conditions.
- Sensor drift: long-term use may shift response, especially with dust accumulation or aging.
- Power instability: weak USB power or loose wiring can cause malformed readings or sensor resets.
- Serial parsing errors: incorrect frame alignment or byte reconstruction can produce meaningless values.
- Overinterpretation: low-cost sensors can support trends and comparisons, but they should not be treated as certified regulatory instruments.
- False precision: decimal-like or exact-looking values may appear more accurate than the sensor can support.
- Environmental contamination: dust buildup, insects, moisture, or enclosure debris can change sensor behavior.
These failure modes do not make the project unusable. They define the discipline required to use it responsibly. A good monitoring station must be placed carefully, powered reliably, validated repeatedly, and interpreted with humility.
Calibration and Validation
Low-cost sensors should be validated carefully. A practical validation process can include:
- run baseline tests indoors under stable conditions
- place the sensor near outdoor air intake or a sheltered outdoor location and observe changes
- compare readings before, during, and after known environmental events such as heavy traffic, cooking, cleaning, construction dust, or wildfire-smoke days
- compare readings against nearby public reference monitors when available
- observe whether temperature and humidity affect sensor behavior
- record placement conditions so future readings can be interpreted in context
Validation does not turn the sensor into a regulatory instrument, but it does improve confidence in how the system responds to changing environmental conditions.
Example Validation Record
| Test Condition | Expected Pattern | What to Record |
|---|---|---|
| Stable indoor baseline | Readings remain relatively stable after warm-up | PM values, temperature, humidity, room activity, time |
| Outdoor sheltered location | Readings reflect changing ambient conditions | Weather, wind, nearby roads, sensor height, enclosure |
| Known particulate event | Readings rise during the event and fall afterward | Event type, start time, end time, peak values |
| Reference comparison | Trends broadly align with nearby official or trusted data | Time alignment, distance to reference monitor, differences |
| Humidity variation | Possible reading shifts under high humidity | Humidity level, PM values, condensation risk, weather context |
A validation record like this turns the project from a simple display into a learning instrument. It teaches readers to treat data as evidence that must be contextualized rather than as an automatic truth.
Suggested Performance Metrics
For a more rigorous evaluation, the station can be assessed against several simple metrics:
- Reading stability: whether values remain reasonably stable under steady environmental conditions.
- Response sensitivity: whether readings change when nearby particulate conditions change.
- Environmental repeatability: whether similar conditions produce similar readings across multiple tests.
- Telemetry integrity: whether the system avoids malformed or clearly impossible values.
- Placement sensitivity: how readings change when the station is moved near roads, windows, vents, or enclosed spaces.
- Reference agreement: whether broad trends align with nearby reference monitors when comparison is possible.
- Data completeness: how often readings are missing, malformed, or interrupted during longer tests.
Even basic evaluation of these metrics improves the engineering credibility of the monitoring station. The goal is not to claim regulatory accuracy. The goal is to make the prototype’s behavior visible enough to interpret responsibly.
Data Logging Extension
The station becomes much more useful when PM readings, temperature, humidity, placement conditions, and timestamps are logged over time. Even a simple CSV file can help reveal daily cycles, traffic patterns, indoor events, ventilation changes, smoke episodes, or sensor instability.
| Field | Example | Purpose |
|---|---|---|
| timestamp | 2026-05-28 09:15:00 | Records when the measurement occurred |
| pm1_ug_m3 | 8 | Stores PM1.0 concentration estimate |
| pm25_ug_m3 | 14 | Stores PM2.5 concentration estimate |
| pm10_ug_m3 | 27 | Stores PM10 concentration estimate |
| temperature_c | 24.8 | Records environmental temperature context |
| humidity_percent | 52.1 | Records humidity context for interpreting optical readings |
| location_note | Classroom window, third floor | Documents placement for later interpretation |
| event_note | Nearby construction | Records possible sources or conditions affecting readings |
For a more advanced version, the Arduino can write to an SD card, an ESP32 can transmit values wirelessly, or a dashboard can visualize readings over time. The important point is methodological: logging transforms the project from a momentary sensor display into an environmental time series.
Build Steps
- Wire the PMS5003 and DHT22 sensors according to the wiring map.
- Upload the firmware to the Arduino-compatible board.
- Open the Serial Monitor and confirm environmental readings.
- Confirm particulate frame parsing by waiting for valid PM values.
- Allow the particulate sensor to warm up before interpreting readings.
- Observe environmental variation over time in a stable location.
- Compare trends across different locations or environmental conditions.
- Record placement, humidity, and known local events during tests.
The build should be tested first in a stable indoor environment before being used for any comparative monitoring. This helps establish whether wiring, power, and firmware are working before environmental variation is introduced.
Limitations
This air quality monitoring station is a prototype rather than a certified regulatory instrument.
- optical sensors are sensitive to humidity and particle composition
- airflow strongly affects readings
- long-term drift may occur
- sensor placement affects representativeness
- results are indicative rather than regulatory
- the system does not measure gases such as ozone, nitrogen dioxide, sulfur dioxide, or carbon monoxide
- the baseline design does not include GPS, timestamps, SD logging, wireless transmission, or reference calibration
- the prototype should not be used as the sole basis for health, regulatory, enforcement, or emergency decisions
These limitations do not make the system unhelpful. They define the appropriate scope of interpretation and use. The strongest use case is education, trend detection, comparative local monitoring, exploratory research, and community awareness.
Possible Upgrades
Add Data Logging
An SD card module can record particulate readings, temperature, humidity, and timestamps for later analysis.
Add Wireless Telemetry
An ESP32 could transmit measurements to a local dashboard, database, or cloud service.
Add AQI Conversion
Firmware could calculate an approximate air-quality category for educational display, while clearly noting that official AQI reporting requires validated methods and appropriate averaging periods.
Add a Display
An OLED or LCD display can turn the station into a standalone classroom or community monitor.
Create a Multi-Node Network
Multiple stations could be deployed across classrooms, streets, homes, or community buildings to compare local air-quality variation.
Add GPS Tagging
GPS can support mobile monitoring, but mobile readings require careful interpretation because speed, airflow, and placement change constantly.
Improve the Enclosure
A weather-resistant ventilated enclosure can improve deployment quality while protecting the sensor and electronics from rain and debris.
Add Gas Sensors
Additional sensors can broaden the monitoring scope, but gas sensors introduce their own calibration, cross-sensitivity, and interpretation challenges.
A networked version of this project could support community-based urban air monitoring across multiple neighborhoods, schools, libraries, public buildings, or field sites.
Responsible Deployment
This prototype is appropriate for classrooms, makerspaces, sustainability labs, community-science demonstrations, and exploratory environmental monitoring. It should not be used as a certified regulatory monitor, medical exposure monitor, emergency-warning device, or sole basis for enforcement decisions without additional validation and institutional oversight.
Responsible deployment means matching the device to the consequence of error. A classroom comparison between indoor and outdoor air is a low-stakes learning activity. A public dashboard that could influence health decisions, school operations, or community concern requires much stronger validation, documentation, and communication standards.
A responsible deployment should include placement records, sensor warm-up, stable power, humidity context, calibration notes, data-quality flags, and plain-language explanation of uncertainty. The station should invite better questions, not false confidence.
For community monitoring, responsible use also means communicating with care. Air-quality data can reveal unequal burdens, but it can also create anxiety or conflict if presented without context. Transparency about limitations, methods, and uncertainty is part of the ethics of environmental sensing.
Why This Matters for Sustainable Development
Air pollution is simultaneously a public-health challenge, an infrastructure challenge, and an urban governance challenge. It is shaped by transport systems, industrial activity, building energy use, heating systems, land-use patterns, wildfire smoke, construction, and broader atmospheric conditions.
Distributed sensing systems translate environmental conditions into interpretable data. This makes environmental risks more visible and helps communities respond more effectively.
This Arduino monitoring station illustrates that principle in miniature: measure conditions locally, interpret the results carefully, and use environmental feedback to inform better urban sustainability decisions.
In that sense, the system contributes directly to the logic of SDG 11: Sustainable Cities and Communities. Cities become more resilient when environmental conditions are measured clearly enough to support smarter planning, healthier neighborhoods, and more transparent public understanding.
The project also shows why sustainable development is not only a matter of high-level policy. It also depends on material systems of observation: sensors, power, firmware, metadata, calibration, placement, validation, data storage, public communication, and responsible interpretation. Without those systems, environmental problems remain abstract. With them, communities can begin to see patterns, ask sharper questions, and demand better infrastructure.
Reproducibility
All firmware, documentation, and supporting build materials necessary to reproduce the prototype are included in the project repository. The design intentionally relies on widely available educational and hobbyist hardware so that it can be rebuilt in classrooms, labs, makerspaces, schools, and community monitoring projects.
The system is intended as a reference implementation rather than a certified air-quality monitoring instrument. Engineers adapting it for more demanding or longer-term use should validate sensor behavior, enclosure design, airflow, placement, humidity sensitivity, power stability, and long-duration environmental exposure under real operating conditions.
For the rest of this project series, reproducibility should mean more than making code available. Each article should include a clear bill of materials, wiring logic, calibration notes, failure modes, test procedure, data interpretation guidance, and a realistic statement of appropriate use.
Conclusion
An Arduino air quality monitoring station demonstrates how embedded sensing systems can support more sustainable cities, stronger environmental awareness, and better local monitoring capacity.
By combining particulate sensing with atmospheric telemetry, the system provides a technically credible introduction to distributed environmental monitoring. It teaches readers how air becomes data, how sensor readings require context, and why calibration, placement, humidity, airflow, and interpretation matter.
More importantly, it illustrates a core principle of sustainable development: communities need reliable feedback systems capable of observing environmental change clearly enough to support informed decision-making.
The deeper lesson is not that a low-cost sensor can replace official monitoring. It cannot. The deeper lesson is that environmental knowledge depends on measurement systems. When those systems are transparent, calibrated, carefully interpreted, and responsibly deployed, even small prototypes can help people understand the air they breathe and the infrastructure that shapes it.
Related Articles
- Arduino Projects for Sustainable Development: 10 SDG-Aligned Builds
- Environmental Monitoring Systems
- Intelligent Infrastructure Systems
- Atmospheric Aerosol Loading and Regional Planetary Risk
- Climate Change as a Planetary Boundary
- Sustainable Development Goals Within Planetary Boundaries
- Planetary Boundaries
Further Reading
- Arduino (n.d.) Serial. Available at: https://docs.arduino.cc/language-reference/en/functions/communication/serial/
- Arduino (n.d.) SoftwareSerial Library. Available at: https://docs.arduino.cc/learn/built-in-libraries/software-serial/
- United Nations (n.d.) Sustainable Development Goal 11: Sustainable Cities and Communities. Available at: https://sdgs.un.org/goals/goal11
- United Nations (n.d.) Sustainable Development Goal 3: Good Health and Well-Being. Available at: https://sdgs.un.org/goals/goal3
- U.S. Environmental Protection Agency (n.d.) Air Sensor Toolbox. Available at: https://www.epa.gov/air-sensor-toolbox
- U.S. Environmental Protection Agency (n.d.) How to Use Air Sensors: Air Sensor Guidebook. Available at: https://www.epa.gov/air-sensor-toolbox/how-use-air-sensors-air-sensor-guidebook
- World Health Organization (n.d.) Air Pollution. Available at: https://www.who.int/health-topics/air-pollution
- World Health Organization (2021) WHO Global Air Quality Guidelines: Particulate Matter (PM2.5 and PM10), Ozone, Nitrogen Dioxide, Sulfur Dioxide and Carbon Monoxide. Available at: https://www.who.int/publications/i/item/9789240034228
References
- Arduino (n.d.) Serial. Available at: https://docs.arduino.cc/language-reference/en/functions/communication/serial/
- Arduino (n.d.) SoftwareSerial Library. Available at: https://docs.arduino.cc/learn/built-in-libraries/software-serial/
- United Nations (n.d.) The 17 Sustainable Development Goals. Available at: https://sdgs.un.org/goals
- United Nations (n.d.) Sustainable Development Goal 3: Good Health and Well-Being. Available at: https://sdgs.un.org/goals/goal3
- United Nations (n.d.) Sustainable Development Goal 9: Industry, Innovation and Infrastructure. Available at: https://sdgs.un.org/goals/goal9
- United Nations (n.d.) Sustainable Development Goal 11: Sustainable Cities and Communities. Available at: https://sdgs.un.org/goals/goal11
- United Nations (n.d.) Sustainable Development Goal 12: Responsible Consumption and Production. Available at: https://sdgs.un.org/goals/goal12
- United Nations (n.d.) Sustainable Development Goal 13: Climate Action. Available at: https://sdgs.un.org/goals/goal13
- U.S. Environmental Protection Agency (n.d.) Air Sensor Toolbox. Available at: https://www.epa.gov/air-sensor-toolbox
- U.S. Environmental Protection Agency (n.d.) How to Use Air Sensors: Air Sensor Guidebook. Available at: https://www.epa.gov/air-sensor-toolbox/how-use-air-sensors-air-sensor-guidebook
- World Health Organization (n.d.) Air Pollution. Available at: https://www.who.int/health-topics/air-pollution
- World Health Organization (2021) WHO Global Air Quality Guidelines: Particulate Matter (PM2.5 and PM10), Ozone, Nitrogen Dioxide, Sulfur Dioxide and Carbon Monoxide. Available at: https://www.who.int/publications/i/item/9789240034228