
Last Updated May 14, 2026
Smart water systems and environmental sensing are cyber-physical knowledge infrastructures that combine distributed sensors, telemetry, metering, online water-quality instruments, analytical models, dashboards, and control systems in order to make water systems more continuously visible, interpretable, and governable in time. They extend conventional monitoring by linking field devices to communications networks, operational platforms, decision workflows, and, in more advanced cases, control logic capable of responding to changing conditions in near real time. In this sense, smart water is not merely the digital embellishment of existing utility practice. It is a reorganization of how water systems become known: a shift from episodic inspection and delayed reporting toward continuous inference, persistent situational awareness, and accountable operational response.
Water systems have historically been difficult to govern because they are spatially distributed, operationally heterogeneous, and only partially visible under conventional modes of observation. Utilities, watersheds, distribution networks, stormwater systems, sewer systems, treatment facilities, storage assets, and source-water environments all contain moving flows, changing quality conditions, infrastructure bottlenecks, energy demands, and failure pathways that can evolve faster than periodic manual inspection or delayed laboratory reporting can fully capture. Smart water systems address this problem by connecting measurement, transmission, interpretation, and response across the physical system so that operators can move from retrospective awareness toward more continuous operational intelligence.
The deeper significance of smart water systems lies in the fact that they blur the boundary between monitoring and management. When sensors, communications systems, analytics, and control logic are integrated, monitoring no longer ends with observation. It becomes part of the infrastructure through which water systems are optimized, stabilized, investigated, and, at times, automatically adjusted. This makes smart water systems more than measurement platforms. They are infrastructures of temporal governance: systems that change what can be detected, how quickly it can be interpreted, who can act on the signal, and whether intervention occurs before loss, contamination, overflow, inefficiency, or infrastructure failure fully materializes.
Main Library
Publications
Article Map
Environmental Monitoring
Related Topic
Intelligent Infrastructure
Related Topic
Data Systems
Related Topic
Risk & Resilience
Smart water is where environmental monitoring becomes operational intelligence. It asks not only whether water conditions can be measured, but whether measurements are transmitted reliably, validated quickly, interpreted in context, connected to thresholds or models, routed to the right people, and translated into action before risk escalates. The central question is not simply whether a water system has sensors, meters, dashboards, or digital models. It is whether those digital and physical components form a trustworthy feedback architecture between water-system behavior and institutional response.
Engineering Problem
The engineering problem is how to design smart water systems that can transform distributed, noisy, latency-sensitive, method-dependent observations into defensible operational intelligence and accountable response. Smart water systems are not simply sensor deployments. They are cyber-physical architectures that connect instruments, meters, telemetry, asset context, hydraulic conditions, water-quality signals, models, alarms, dashboards, operators, field crews, governance rules, and sometimes automated control. Their success depends on whether this chain can preserve enough signal quality, context, interpretability, and institutional capacity to support timely action.
This problem is difficult because water systems change across multiple temporal scales. Pressure transients, pump status, turbidity shifts, rainfall pulses, sewer levels, and distribution anomalies may evolve quickly. Pipe deterioration, leakage patterns, non-revenue water, asset degradation, watershed stress, and demand behavior may accumulate more slowly. Laboratory confirmation, field inspection, maintenance dispatch, and public communication often operate on still different timelines. A smart water system must therefore align sensing frequency, telemetry latency, alert logic, human response, and control action with the actual dynamics of the water process being managed.
Weak smart water systems collect more data without improving response. Strong smart water systems treat monitoring as an operational evidence chain. They ask what the sensor detects, what remains unobserved, how quickly data arrive, whether the signal is validated, how anomalies are interpreted, which threshold or model is being used, who receives the alert, what action is authorized, how outcomes are recorded, and whether automation is safe under sensor error, communications failure, or unmodeled conditions.
| Engineering Tension | Why It Matters | Required Evidence |
|---|---|---|
| Sensing versus operational intelligence | Measurements alone do not create action unless they are validated, contextualized, and linked to workflows. | Sensor registry, alert rules, response workflow, decision log |
| Telemetry visibility versus data quality | Near-real-time streams can hide sensor drift, fouling, stale data, or communications failure. | QA/QC flags, telemetry completeness, maintenance log, plausibility checks |
| Online monitoring versus laboratory confirmation | Real-time instruments improve temporal awareness but may still require validation for regulatory or diagnostic claims. | Validation protocol, sampling trigger, confirmation workflow, uncertainty note |
| Smart metering versus system control | Metering improves demand visibility and leak detection but does not by itself create coordinated operational response. | AMI data model, district water balance, pressure-zone context, leak-response workflow |
| Decision support versus automation | Human-in-the-loop recommendations and autonomous control carry different operational and accountability risks. | Control policy, override rules, fail-safe design, human review record |
| Digital model versus digital twin | A model may be static or scenario-based; a digital twin requires stronger coupling to live operational data and update logic. | Model/twin definition, data feeds, update frequency, calibration and validation record |
| Digital capacity versus institutional capacity | Advanced tools can fail if workforce, maintenance, cybersecurity, field crews, or governance processes are underdeveloped. | Capacity plan, roles, training, maintenance budget, escalation protocol |
The practical question is therefore: does the smart water system improve the timing, reliability, and accountability of action, or does it merely create a more elaborate dashboard for unresolved operational uncertainty?
Reference Architecture
A practical smart water architecture can be understood as a cyber-physical evidence and response system. The exact implementation may include online water-quality instruments, pressure sensors, flow meters, level gauges, pump-status sensors, rain gauges, advanced metering infrastructure, SCADA systems, telemetry networks, hydraulic models, digital twins, anomaly-detection routines, dashboards, alerts, work-order systems, public communication tools, and control interfaces. The responsibilities remain consistent: observe, transmit, validate, contextualize, analyze, decide, act, document, and revise.
| Layer | Engineering Role | Primary Risk | Evidence Artifact |
|---|---|---|---|
| Objective and service layer | Defines the operational purpose: quality surveillance, leak detection, demand visibility, wet-weather control, treatment optimization, or asset protection. | Digital tools are deployed without a clear decision or service objective. | Monitoring objective manifest, service goal, decision-use statement |
| Field sensing layer | Measures water quality, flow, pressure, level, pump status, storage, rainfall, demand, or related environmental conditions. | Instrumentation observes the wrong variables, wrong locations, or wrong frequency. | Sensor registry, calibration record, spatial placement plan |
| Telemetry and communications layer | Moves measurements from distributed assets into operational systems with known latency and completeness. | Gaps, stale data, latency, or outages create false confidence. | Telemetry log, latency report, completeness metric, outage record |
| Data validation layer | Checks plausibility, drift, fouling, stuck values, sensor disagreement, and communications failures. | Bad data become alerts, model inputs, or control signals. | QA/QC rules, validation flags, maintenance and anomaly logs |
| Contextualization layer | Links readings to assets, pressure zones, treatment stages, sewer basins, watersheds, customers, models, and historical baselines. | Signals are interpreted without spatial, hydraulic, operational, or environmental context. | Asset registry, hydraulic zone map, water-quality baseline, system topology |
| Analytics and modeling layer | Uses thresholds, anomaly detection, forecasts, optimization routines, hydraulic models, or digital twins to interpret condition. | Models or thresholds appear authoritative without validation, uncertainty, or domain context. | Model card, threshold registry, uncertainty statement, validation report |
| Decision and response layer | Routes alerts, recommendations, work orders, operational changes, investigations, or public communication. | Detection improves but institutional response remains slow, unclear, or under-resourced. | Escalation protocol, work-order log, response-time metric, public communication plan |
| Control and governance layer | Defines whether and how automated or semi-automated control can adjust pumps, gates, valves, dosing, or treatment processes. | Automation acts on faulty data, brittle assumptions, or unclear accountability. | Control policy, fail-safe plan, override log, governance review |
This architecture makes clear that smart water is not only digital instrumentation. It is the management of a cyber-physical chain from environmental and infrastructure condition to action, accountability, and revision.
Implementation Pattern
A rigorous smart water implementation begins with the operational problem rather than the technology. A utility trying to detect leaks, a watershed manager tracking source-water quality, a stormwater agency managing wet-weather storage, a treatment plant optimizing process control, and a district using advanced metering infrastructure do not require identical architectures. Each purpose implies different sensors, telemetry frequency, validation procedures, thresholds, analytics, response pathways, cybersecurity requirements, and governance responsibilities.
| Artifact | Purpose | Suggested Format |
|---|---|---|
| Smart water objective manifest | Defines service goal, water domain, assets, monitored variables, operational use, and response expectations. | YAML, Markdown, architecture decision record |
| Sensor and asset registry | Tracks sensors, meters, instruments, location, asset linkage, units, maintenance owner, and calibration status. | CSV, SQL table, asset-management export |
| Telemetry and latency log | Records expected and received readings, communications pathway, latency, outages, and missingness. | CSV, time-series database, observability export |
| Water-quality and process observation records | Stores online quality, pressure, flow, level, pump, storage, rainfall, and operational readings. | CSV, Parquet, SQL table, historian export |
| Validation and QA/QC policy | Defines plausibility checks, sensor-drift flags, fouling detection, stale-data handling, and confirmation workflow. | YAML, SQL rules, test scripts |
| Threshold and alert registry | Documents alarms, anomaly rules, escalation levels, response targets, and valid-use limits. | CSV, YAML, monitoring configuration |
| Model or digital twin card | Documents data feeds, update logic, calibration, validation, assumptions, and decision scope. | Markdown, model card, system diagram |
| Response and work-order log | Tracks alerts, investigation, dispatch, operational changes, confirmation samples, and outcomes. | CSV, SQL table, CMMS export |
| Control policy and fail-safe record | Defines automation boundaries, human override, fallback states, and safety constraints. | Markdown, control policy, governance record |
| Public evidence package | Explains system purpose, monitoring limits, validation, privacy, equity, and public communication rules. | Markdown, HTML, PDF, dashboard note |
The implementation goal is to make smart-water decisions reconstructable. A user should be able to move from an alert, optimization recommendation, leak investigation, contamination response, overflow prevention action, or automated control event back to the sensor, data-quality flag, threshold, model, human decision, response pathway, and governance rule that produced it.
Research-Grade Framing: Smart Water as Cyber-Physical Knowledge Infrastructure
A research-grade account of smart water begins by treating it as cyber-physical knowledge infrastructure rather than as utility digitization. Smart water systems determine which parts of a water system become visible, how quickly conditions can be recognized, how anomalies are interpreted, which operational signals are escalated, when human judgment is required, and whether control actions can be triggered safely. They change not merely what is measured, but the timing and architecture of institutional perception.
This role is epistemically demanding because water-system knowledge remains mediated. Smart water systems do not reveal infrastructure directly in total transparency. They produce operational visibility through signals, thresholds, proxies, telemetry, models, alarms, dashboards, and human interpretation. Pressure becomes evidence of possible leakage or hydraulic disturbance. Conductivity or turbidity becomes a clue about changing water condition. Meter patterns become evidence of unusual demand, private leakage, or system loss. Sewer levels and rainfall become evidence for wet-weather risk. Digital knowledge remains inferential; what changes is that the inference becomes more continuous, distributed, and operationally consequential.
This inferential chain is not neutral. What becomes continuously sensed gains operational priority. What remains uninstrumented, under-modeled, or outside the dashboard may become institutionally less visible even if it remains socially or environmentally important. Smart water can therefore improve accountability while also creating new forms of selective visibility. The system must be evaluated not only by how much data it collects, but by whether it strengthens public water stewardship, reduces delayed recognition, supports equitable service, and preserves the capacity for human judgment under uncertainty.
| Limited Pattern | Stronger Pattern | Why the Shift Matters |
|---|---|---|
| Install connected sensors | Design a validated, contextualized, response-linked evidence architecture | Prevents instrumentation from being mistaken for intelligence. |
| Build dashboards | Connect dashboards to alert logic, work orders, field investigation, and outcome review | Prevents visibility from ending at passive display. |
| Use telemetry | Track latency, completeness, stale data, outages, and communications reliability | Prevents near-real-time systems from hiding data-quality failure. |
| Deploy smart meters | Link demand signals to pressure zones, water balance, customer support, and leak response | Prevents metering from remaining only a billing upgrade. |
| Use digital models | Distinguish static models, operational models, and live-data-coupled digital twins | Prevents digital-twin language from obscuring actual model capability. |
| Automate controls | Define fail-safes, override pathways, safety constraints, and governance responsibility | Prevents speed from outrunning accountability. |
The central research question is not “How digital is this water system?” but “What kind of operational knowledge and response capacity does this cyber-physical architecture produce, with what uncertainty, latency, and accountability?”
Formal Model: Signal, Telemetry, Latency, Decision Quality, and Control Readiness
A useful formal model separates sensor coverage, data-quality validity, telemetry completeness, latency, anomaly confidence, response capacity, model readiness, control safety, and governance readiness. Let \(C_s\) represent sensor coverage, \(Q_d\) data-quality validity, \(C_t\) telemetry completeness, \(L_r\) latency readiness, \(A_c\) anomaly confidence, \(R_c\) response capacity, \(M_r\) model or digital-twin readiness, \(S_{\mathrm{control}}\) control safety, and \(G_r\) governance readiness. Smart-water evidence quality depends on these dimensions together, not on digital connectivity alone.
C_{\mathrm{telemetry}} = \frac{N_{\mathrm{received\ readings}}}{N_{\mathrm{expected\ readings}}}
\]
Interpretation: Telemetry completeness measures whether the system is receiving enough expected readings to support operational awareness.
L_{\mathrm{response}} = T_{\mathrm{action}} – T_{\mathrm{detection}}
\]
Interpretation: Response latency measures the time between detecting a condition and taking operational action.
P_{\mathrm{alert}} = f(S_{\mathrm{signal}}, Q_d, B_{\mathrm{baseline}}, H_{\mathrm{history}})
\]
Interpretation: Alert confidence depends on signal strength, data quality, baseline behavior, and historical context.
R_{\mathrm{loss}} = \frac{V_{\mathrm{produced}} – V_{\mathrm{billed}}}{V_{\mathrm{produced}}}
\]
Interpretation: A simplified system-loss ratio compares produced water with billed or accounted water, helping guide non-revenue water review.
Q_{\mathrm{smart\ water}} =
w_1C_s +
w_2Q_d +
w_3C_t +
w_4L_r +
w_5A_c +
w_6R_c +
w_7M_r +
w_8S_{\mathrm{control}} +
w_9G_r
\]
Interpretation: Smart-water quality depends on sensing coverage, data validity, telemetry completeness, latency readiness, anomaly confidence, response capacity, model readiness, control safety, and governance.
This formal structure protects against a common mistake in smart-water planning: treating digital connection as operational intelligence. A sensor stream, dashboard, meter network, or digital twin becomes valuable only when it improves validated awareness, response timing, and accountable intervention.
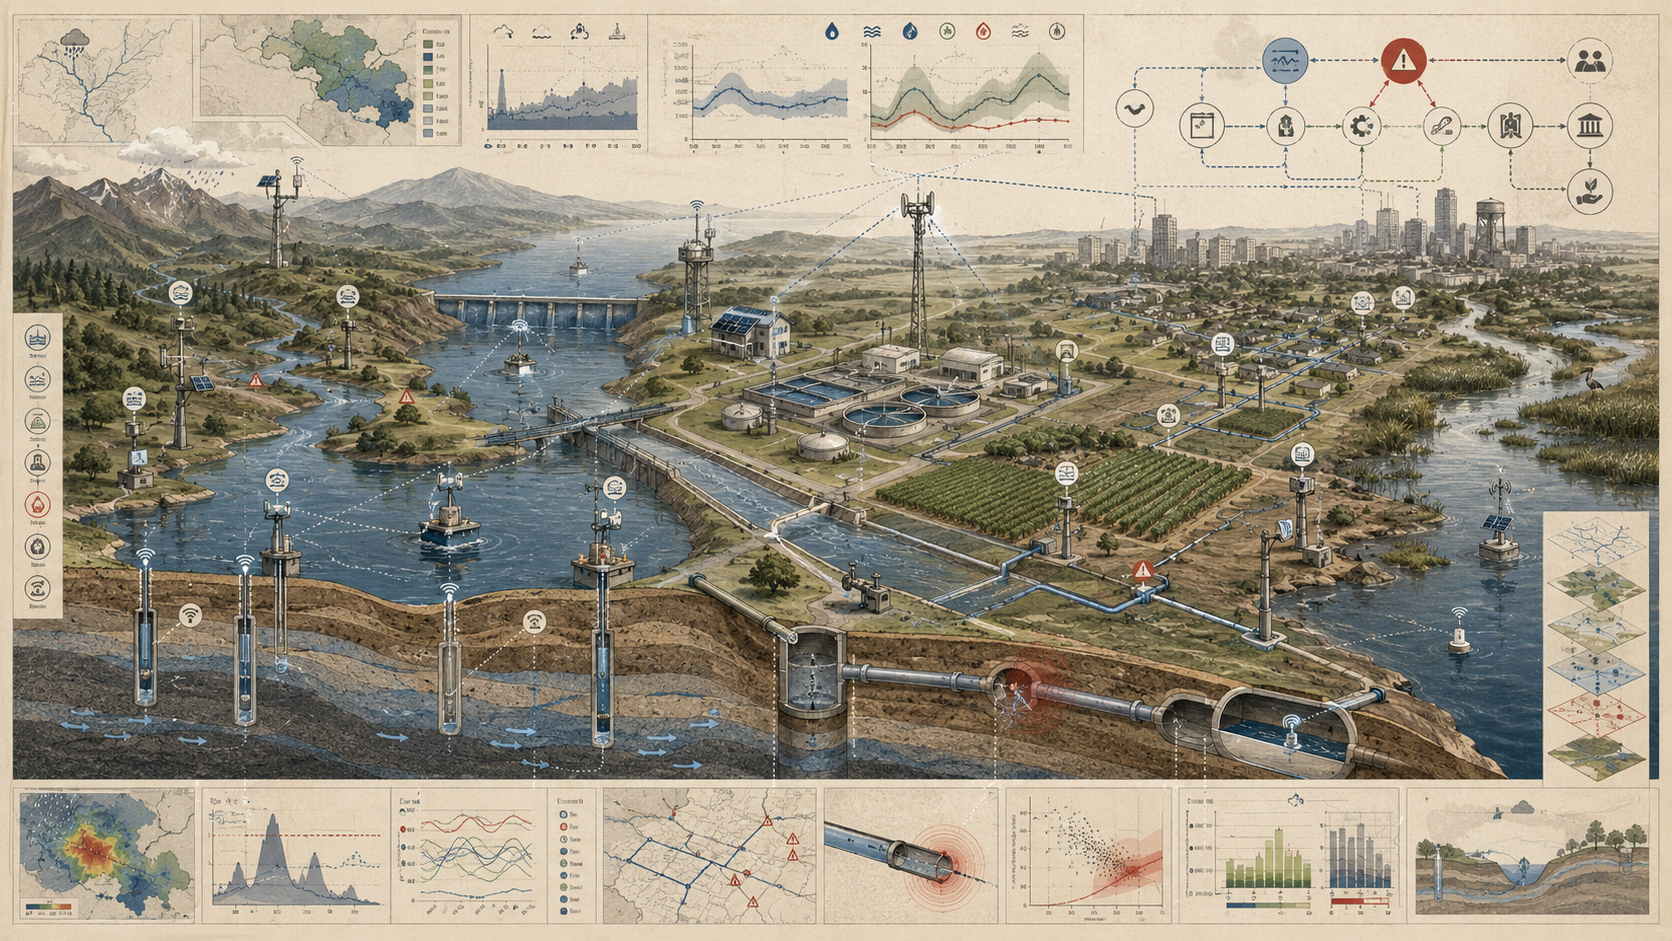
What Are Smart Water Systems and Environmental Sensing?
Smart water systems are digitally connected water infrastructures that use sensing, metering, communications, analytics, and sometimes automated control to improve awareness and management of water resources, water utilities, wastewater systems, stormwater systems, treatment facilities, storage assets, and distribution networks. Environmental sensing is the observational layer within these systems: the field devices and instruments that capture conditions such as flow, pressure, quality, level, storage, demand, rainfall, and infrastructure status.
These systems may include online water-quality monitors in source waters, treatment processes, and distribution systems; flow, level, pressure, pump-status, and storage sensors; advanced metering infrastructure and connected customer meters; telemetry and communications systems linking remote assets to operators; dashboards, alarms, and operational decision-support platforms; real-time models, digital twins, and coordinated control architectures. EPA’s online water-quality monitoring resources emphasize the role of online instruments in real-time water-quality measurement for source waters and distribution systems, while EPA’s advanced metering infrastructure materials describe higher-frequency metering data as a way to improve water-use visibility and management.
The defining feature of smart water is connectedness with operational intent. A sensor by itself is not a smart-water system. Nor is a dashboard that simply accumulates readings. The system becomes “smart” when measurements are transmitted, contextualized, interpreted, and linked to decisions about treatment, maintenance, loss reduction, wet-weather operations, demand management, contamination response, or infrastructure control. Smartness, in this sense, is not a property of the device alone. It is a property of the socio-technical system that turns signals into action.
| System Form | Primary Question | Typical Evidence | Main Risk |
|---|---|---|---|
| Online water-quality monitoring | Are source, treatment, or distribution conditions changing in ways that require attention? | Turbidity, chlorine residual, pH, conductivity, temperature, dissolved oxygen, other online parameters | Online readings are treated as definitive without validation or confirmation workflow. |
| Hydraulic and network sensing | How are pressure, flow, storage, pump operation, and system balance changing? | Pressure sensors, flow meters, pump status, tank levels, district metering | Signals are interpreted without topology, demand, or hydraulic context. |
| Advanced metering infrastructure | How is demand changing across customers, zones, and time? | High-frequency meter reads, consumption patterns, continuous-flow signals | Metering becomes a billing upgrade rather than operational intelligence. |
| Stormwater and sewer intelligence | How are rainfall, levels, flows, storage, and overflow risk evolving? | Rain gauges, level sensors, sewer flow, storage status, control-gate state | Wet-weather data do not connect to response capacity or overflow prevention. |
| Digital twins and operational models | Can live data and models support scenario testing, prediction, or operational optimization? | Hydraulic models, live data feeds, simulations, anomaly detection, forecast outputs | Digital-twin claims exceed actual data coupling, validation, or update frequency. |
| Automated or semi-automated control | Can system state trigger safe adjustment of pumps, valves, gates, dosing, or storage? | Control commands, feedback measurements, override logs, fail-safe states | Automation acts on faulty data, brittle assumptions, or unclear accountability. |
Smart water systems are therefore more than water monitoring. They are connected infrastructures for turning distributed water-system signals into operational intelligence, response, and governance.
Why Smart Water Systems Matter
Smart water systems matter because conventional water management is often governed by delayed visibility. Utilities and watershed managers may rely on periodic sampling, monthly meter reads, manual inspections, scheduled maintenance, or after-the-fact incident reports. These modes remain important, but they can leave leaks, contamination signals, pressure anomalies, infiltration, overflow risk, or treatment inefficiencies underdetected until losses or failures become substantial. Connected sensing changes this temporal structure by making selected conditions more continuously visible.
They also matter because water systems increasingly face simultaneous pressures: aging infrastructure, workforce constraints, contaminant concerns, wet-weather stress, energy costs, climate variability, resilience requirements, cybersecurity risks, public accountability demands, and rising expectations for service reliability. Under these conditions, the problem is rarely lack of isolated measurements. It is lack of integrated awareness. Smart water systems matter because they reduce the lag between condition and recognition, and sometimes between recognition and response.
Their significance is therefore not merely technological. Smart water systems alter the timing of governance. They allow institutions to act on changing conditions closer to the moment when those conditions emerge, which can change whether a leak is found early, whether a contamination signal is investigated quickly, whether a stormwater system is operated dynamically, whether a pump failure is detected before service is lost, or whether treatment processes are tuned before compliance or service problems intensify. What they promise, at their best, is not perfect control, but better temporal alignment between water-system behavior and institutional action.
| Need | Smart Water Contribution | Risk Without Smart-Water Capacity |
|---|---|---|
| Leak and loss detection | Uses flow, pressure, metering, and district balance data to identify abnormal water movement. | Losses accumulate until visible failures, bills, or complaints reveal them. |
| Water-quality surveillance | Supports earlier recognition of changing source, treatment, or distribution conditions. | Quality concerns are discovered only through delayed sampling, complaints, or incidents. |
| Wet-weather and overflow management | Connects rainfall, levels, flows, storage, and controls to support dynamic response. | Sewer or stormwater systems are managed reactively during high-risk events. |
| Treatment optimization | Uses process signals and online monitoring to support operational tuning. | Processes are adjusted after problems emerge or through slower feedback loops. |
| Demand management | Uses higher-frequency metering to reveal patterns, anomalies, and conservation opportunities. | Demand is known mainly through coarse billing cycles. |
| Asset resilience | Links condition, performance, failure signals, and response workflows. | Maintenance remains scheduled or reactive rather than risk-informed. |
| Public accountability | Creates more traceable evidence for decisions, alerts, actions, and investments. | Service and environmental claims are harder to evaluate or contest. |
Smart water systems matter because the timing of knowledge often determines the severity of failure. Earlier recognition does not solve every problem, but delayed recognition makes many water-system problems worse.
Smart Water as Cyber-Physical Knowledge Infrastructure
A rigorous account of smart water requires treating it as cyber-physical knowledge infrastructure. These systems do not merely collect more data. They reorganize how water systems become knowable by linking physical assets to digital representations that can be updated, queried, compared, and acted upon continuously. The result is a new kind of operational epistemology: one in which flow, pressure, quality, demand, and asset condition are no longer known primarily through periodic inspection and retrospective reporting, but through persistent streams of data that support ongoing inference.
This is a major shift. In conventional systems, many operational questions are answered only after effects become evident in customer complaints, billing anomalies, visual inspection, laboratory confirmation, or infrastructure failure. In smart systems, those same questions may be addressed earlier through anomaly detection, threshold alarms, comparative flow balance, online quality monitoring, or model-based prediction. The system is no longer simply recording what happened. It is participating in the anticipation of what may be emerging.
Yet this new visibility is never complete. Smart water systems do not reveal the infrastructure directly in some transparent totality. They produce mediated visibility through proxies, thresholds, telemetry, models, and human interpretation. Digital knowledge remains inferential. What changes is that the inference becomes more continuous, more distributed, and more operationally consequential.
| Monitoring Choice | What Becomes More Visible | What May Remain Less Visible |
|---|---|---|
| Pressure and flow sensing | Hydraulic anomalies, pump behavior, zone imbalance, possible leakage. | Buried asset condition, exact leak location, social impact of service disruption. |
| Online water-quality monitoring | Selected near-real-time quality changes and process conditions. | Unmeasured contaminants, laboratory-confirmed details, causal explanation. |
| Advanced metering infrastructure | Demand patterns, customer-side continuous flow, potential losses. | Household context, affordability concerns, privacy and equity implications. |
| Stormwater and sewer telemetry | Levels, storage state, wet-weather stress, overflow risk. | Unmonitored tributaries, private laterals, downstream ecological consequence. |
| Digital twins | Model-based state estimation, scenarios, prediction, operational planning. | Unmodeled failure modes, uncertain assumptions, stale calibration. |
| Automated control | Fast adjustment, feedback response, operational optimization. | Human judgment, institutional accountability, failure-mode transparency if governance is weak. |
Smart water is powerful because it turns water systems into more continuously observable operational fields. It is risky when mediated visibility is mistaken for total knowledge or when digital control outruns institutional accountability.
A Unified Ecology of Utility, Environmental, and Watershed Sensing
One of the most important conceptual points about smart water is that it should not be reduced to utility digitization alone. Smart water systems increasingly connect domains that were once monitored more separately: source-water observation, treatment-process monitoring, distribution-system sensing, sewer and stormwater operations, customer metering, watershed telemetry, groundwater observation, and environmental condition tracking. What emerges is a more unified ecology of water-system observation in which environmental signals and operational signals increasingly interact.
For example, source-water quality sensing can shape treatment decisions. Distribution pressure and quality sensing can influence infrastructure response. Rainfall, level, and sewer-network data can inform wet-weather control and overflow risk management. Customer metering data can be interpreted alongside network flow and pressure to identify possible leaks or non-revenue water. Watershed conditions may affect reservoir operations, intake quality, and downstream compliance or flood-management choices. The strongest smart-water systems are not merely digital utilities; they are linked observational ecologies spanning natural water, built infrastructure, and institutional operations.
This wider synthesis matters because water systems do not respect the neat boundaries of organizational charts. The distinction between “environmental monitoring” and “utility operations” is analytically useful, but in real systems source conditions, infrastructure behavior, public-service obligations, and downstream ecological consequences are tightly coupled. Smart water systems become more valuable when they reflect that coupling rather than reproducing older observational silos in digital form.
| Domain | Typical Signals | Operational or Environmental Use | Integration Risk |
|---|---|---|---|
| Source water | Turbidity, conductivity, temperature, level, flow, algal indicators, upstream events. | Treatment preparation, intake management, contamination investigation. | Source signals remain disconnected from treatment operations. |
| Treatment facilities | Process variables, dosing, turbidity, residuals, equipment status, alarms. | Process optimization, compliance support, energy and chemical efficiency. | Process data are visible but not linked to outcome review. |
| Distribution networks | Pressure, flow, residuals, tank levels, pump status, valve state. | Leak detection, pressure management, water-quality maintenance, service reliability. | Signals lack hydraulic-zone or asset context. |
| Customer metering | High-frequency consumption, continuous flow, usage anomalies. | Demand visibility, conservation, leak notification, non-revenue water review. | AMI is treated as only billing infrastructure. |
| Sewer and stormwater | Rainfall, levels, flows, storage status, gate position, overflow risk. | Wet-weather operations, overflow prevention, flood-risk response. | Data do not connect to control or field capacity. |
| Watersheds and receiving waters | Streamflow, water quality, rainfall, groundwater, ecological signals. | Environmental compliance, resilience planning, source protection, adaptive management. | Environmental signals remain outside utility decision workflows. |
Smart water becomes more powerful when utility, watershed, and environmental sensing are connected without flattening their different scales, responsibilities, and accountability structures.
Core Components of Smart Water Systems
Smart water systems typically integrate several interdependent components: sensing, communications, data management, analytics, decision support, and control. These layers should not be understood as optional decorations around sensing. Together they form the architecture through which smart water becomes operationally meaningful.
| Component | Role | Evidence Needed | Failure Mode |
|---|---|---|---|
| Sensing | Measures quality, flow, level, pressure, storage, pump status, rainfall, or demand. | Sensor registry, calibration record, placement rationale. | Wrong variable, poor placement, drift, fouling, or unmaintained equipment. |
| Communications | Transmits measurements from remote sites to operational platforms. | Telemetry completeness, latency, outage record, redundancy plan. | Data gaps or latency are hidden from operators. |
| Data management | Stores, synchronizes, quality-checks, visualizes, and links observations to asset context. | Data schema, QA/QC rules, metadata, lineage record. | Values arrive without units, context, or quality flags. |
| Analytics | Uses alarms, thresholds, anomaly detection, forecasts, optimization, or models. | Threshold registry, model card, validation report, uncertainty statement. | False alarms, alert fatigue, brittle models, or opaque recommendations. |
| Decision support | Routes information to operators, field crews, managers, or public communication workflows. | Escalation protocol, response log, work-order linkage. | Alerts are generated but not acted upon or reviewed. |
| Control | Adjusts pumps, gates, valves, storage, dosing, or treatment settings manually or automatically. | Control policy, override rules, fail-safe design, audit log. | Automation acts on bad data or unclear authority. |
A network of sensors without reliable communications, interpretive logic, and response pathways may produce abundant data but limited intelligence. Conversely, even a modest set of sensors can be highly valuable when embedded within strong communications, analysis, governance, and action workflows.
Key Analytical Distinctions
Smart water is not the same as water monitoring. Monitoring becomes smart when it is networked, contextualized, and linked to operational workflows or control logic rather than remaining a standalone measurement exercise.
Telemetry is not the same as intelligence. Transmitting measurements to a dashboard improves visibility, but intelligence emerges only when data are interpreted through thresholds, models, trend logic, or operational response pathways.
Online monitoring is not the same as laboratory confirmation. Real-time instruments improve temporal visibility, but many applications still require validation, investigation, or targeted sampling depending on the decision context.
Smart metering is not the same as smart system control. Metering improves demand visibility, billing accuracy, and leak detection, but a fully smart system may also include treatment optimization, wet-weather control, or coordinated infrastructure actuation.
Decision support is not the same as autonomous control. A dashboard or recommendation engine may inform human operators without directly altering the system. Autonomous or semi-autonomous control exists at a different level of cyber-physical intervention and carries different operational risks.
A digital model is not the same as a digital twin. A conventional engineering model may represent the system analytically, while a digital twin implies a more dynamic coupling between model state and live operational data.
| Distinction | Why It Matters | Design Implication |
|---|---|---|
| Monitoring versus smart water | Monitoring can remain passive; smart water requires operational linkage. | Define decision workflows and response protocols. |
| Telemetry versus validated data | Connected readings can still be wrong, stale, incomplete, or misleading. | Track QA/QC, latency, completeness, and stale-data flags. |
| Online measurement versus confirmed diagnosis | Rapid signals may require lab confirmation, field inspection, or additional context. | Define confirmation and investigation workflows. |
| Smart metering versus system intelligence | AMI data become more powerful when linked to pressure zones, flow, and response. | Integrate metering with hydraulic and customer-support workflows. |
| Decision support versus control | Recommendations and automated actions have different risks and accountability needs. | Separate human-in-the-loop and automated-control policies. |
| Model versus digital twin | Digital-twin claims require live-data coupling, update logic, and validation. | Use model cards and data-coupling documentation. |
These distinctions prevent smart water from being reduced to digital vocabulary. The system is only as smart as the evidence chain, operational response, and governance structure that connect data to action.
System Architecture: From Sensor to Operational Action
Smart water systems operate as layered architectures that connect field measurement to management action. Sensors, meters, and instruments measure conditions in water bodies, treatment systems, assets, or networks. Communications infrastructure moves these measurements into operational systems. Data are checked for plausibility, sensor drift, communications failure, stale values, and other quality concerns. Measurements are linked to location, asset condition, operational thresholds, historical patterns, hydraulic models, or customer and watershed context. Rules, alarms, forecasts, dashboards, optimization routines, or predictive tools interpret system condition. Operators investigate, optimize, dispatch crews, adjust operations, communicate publicly, or in some systems trigger automated responses.
| Stage | Transformation | Failure Risk |
|---|---|---|
| Physical process | Water-system behavior changes through flow, quality, pressure, demand, rainfall, storage, or asset condition. | The monitored signal does not represent the process of concern. |
| Observation | Sensors, meters, and instruments capture selected signals. | Sensor drift, fouling, poor placement, or missing variables. |
| Transmission | Telemetry moves observations into operational platforms. | Latency, missingness, stale data, communications failure. |
| Validation | Readings are checked for plausibility and quality. | Faulty data become alert inputs or control signals. |
| Contextualization | Data are linked to assets, zones, baselines, models, and operating conditions. | Signals are interpreted without hydraulic, environmental, or asset context. |
| Analysis | Algorithms, rules, dashboards, forecasts, or models generate operational meaning. | False positives, false negatives, opaque recommendations, alert fatigue. |
| Action | Operators investigate, adjust, dispatch, notify, confirm, or trigger control. | Detection improves but response remains unclear, slow, or under-resourced. |
| Review | Actions, outcomes, thresholds, and model assumptions are evaluated and revised. | The system learns little from alerts, failures, or near misses. |
This architecture matters because the value of a smart-water device depends on where it sits in the chain. A high-frequency sensor without robust communications, validation, or operational uptake may create data abundance without actionable meaning. A simpler device connected to a strong alerting and response workflow may improve system performance more substantially. Smart water is therefore not just a matter of instrument sophistication. It is a matter of systemic fit between sensing, interpretation, and intervention.
Environmental Sensing, Online Monitoring, and Telemetry
Environmental sensing is the observational core of smart water systems. It encompasses the field devices that detect conditions in source waters, treatment streams, distribution systems, storage assets, sewer networks, stormwater systems, groundwater systems, and other water environments. These devices may monitor quality, flow, level, pressure, storage, pump status, rainfall, demand, or other operationally relevant signals.
Online monitoring extends this observational logic into near-real-time operations. Instead of waiting for intermittent lab or field reports, utilities and operators can observe selected conditions persistently enough to support treatment adjustment, contamination surveillance, distribution management, and remote diagnosis. EPA’s online water-quality monitoring materials emphasize that online instruments can support real-time water-quality measurement in source waters and distribution systems, including treatment optimization, distribution-system operations, and contamination detection.
Telemetry is what transforms local instruments into network infrastructure. Without reliable communications, sensing remains local and fragmented. With it, remote sites become nodes in a larger operational field. Telemetry therefore does more than move data. It enables the spatial expansion of operational awareness across source waters, utilities, remote assets, and environmental systems that would otherwise remain only partially visible.
| Responsibility | Purpose | Failure Mode |
|---|---|---|
| Sensor placement | Ensures signals represent the water process or asset condition of concern. | Signals are precise but operationally irrelevant. |
| Parameter selection | Matches measured variables to treatment, quality, hydraulic, or risk questions. | Important conditions remain invisible because proxies are weak. |
| Calibration and maintenance | Maintains signal reliability over time. | Fouling, drift, or sensor aging produces false confidence. |
| Telemetry continuity | Ensures readings reach operators frequently enough to support decisions. | Missing data or stale readings appear as normal values. |
| QA/QC flagging | Distinguishes valid readings from questionable or failed observations. | Bad data enter dashboards, models, or control logic. |
| Confirmation workflow | Connects online signals to sampling, inspection, or field response when needed. | Online anomaly creates uncertainty without resolution. |
Environmental sensing becomes smart-water intelligence only when the system can explain what a signal means, how much confidence it deserves, and what response should follow.
Smart Metering, Demand Visibility, and System Loss Detection
One of the most influential forms of smart water is advanced metering infrastructure. Higher-frequency metering changes what utilities can know about demand, loss, and system behavior. Consumption patterns that once appeared only as monthly totals can be examined as temporal signals. Unusual nighttime use, persistent flow, district anomalies, abrupt shifts in consumption, or differences between produced and billed water become interpretable in ways that traditional read cycles often obscure.
This matters because customer-side measurements are not merely commercial records. They are part of the epistemic surface of the water system. They can reveal leakage, abnormal consumption, spatial demand dynamics, and inconsistencies between production and billed use. Smart metering therefore expands the meaning of monitoring from billing support to operational visibility.
At the same time, demand visibility is not sufficient on its own. Meter data become most powerful when interpreted alongside pressure zones, network flow, asset condition, customer communication, and local operational context. A usage anomaly is only the beginning of a diagnostic question. Smart metering contributes to system intelligence when it is integrated into a wider architecture of inference rather than treated as a self-sufficient upgrade.
| Use | Signal | Operational Value | Caveat |
|---|---|---|---|
| Customer leak detection | Continuous or abnormal low-flow usage. | Earlier customer notification and water-loss reduction. | Requires customer communication and privacy-aware practice. |
| District water balance | Production, zone flow, and meter totals. | Non-revenue water and loss review. | Requires synchronized data and pressure-zone context. |
| Demand forecasting | Hourly, daily, seasonal, and event-driven consumption patterns. | Operational planning, storage management, conservation targeting. | Forecasts can fail during unusual events or behavior shifts. |
| Equity and affordability review | Usage patterns, conservation response, billing impacts. | Better customer support and program targeting. | Requires careful privacy, context, and non-punitive governance. |
| Operational anomaly detection | Abrupt zone or customer-level consumption changes. | Early investigation of leaks, meter failure, or unusual demand. | Anomalies require field or customer confirmation. |
Smart metering is powerful when it becomes part of system intelligence. It is limited when it remains detached from hydraulic, customer, equity, and operational context.
Decision Support, Feedback Loops, and Control
Smart water systems become truly transformative when data are linked to decision support and control. In their simplest form, these systems provide human operators with richer situational awareness and earlier alerts. In more advanced forms, they enable optimization, coordinated control, or limited autonomous actuation across pumps, valves, gates, storage, or treatment settings.
This creates feedback loops. Sensors detect system state; analytics and models interpret likely meaning; operators or control logic choose a response; the system then measures the effects of that response. Water infrastructure thus becomes, at least partially, self-observing and recursively managed. Monitoring no longer ends at explanation. It becomes part of the loop through which the infrastructure regulates itself or is regulated more intelligently by people.
But feedback-loop sophistication also introduces new design questions. Human-in-the-loop control can preserve judgment, contextual flexibility, and accountability, but may be slower. Automated or semi-automated control can act quickly, but may behave poorly under sensor error, communications failure, unmodeled conditions, or brittle control assumptions. The deepest challenge is not simply to automate more. It is to design feedback systems whose speed, interpretability, and resilience are appropriate to the water process being managed.
| Maturity Level | Description | Example | Governance Need |
|---|---|---|---|
| Passive visibility | Data are displayed for user interpretation. | Dashboard showing pressure, quality, or flow. | Data-quality flags and user training. |
| Alerting | Thresholds or anomaly rules notify staff. | Alarm for low chlorine residual or high sewer level. | Escalation and confirmation workflow. |
| Decision support | Analytics recommend investigation or action. | Leak-priority ranking or treatment-adjustment recommendation. | Human review, rationale, and decision log. |
| Optimization | Models suggest efficient operating strategies. | Pump scheduling, storage balancing, wet-weather routing. | Model validation and operating constraints. |
| Semi-automated control | System proposes or initiates bounded actions with operator oversight. | Gate or valve adjustment under approved conditions. | Override, fail-safe, audit trail. |
| Automated control | System acts directly within defined safety constraints. | Dynamic dosing, pump control, or storage routing. | Safety case, monitoring redundancy, governance review. |
The more direct the control pathway, the stronger the validation, fail-safe, oversight, and accountability requirements must be.
Data-to-Action Limits, Failure Modes, and New Opacities
Smart water systems do not eliminate uncertainty; they redistribute and sometimes amplify it. Sensors can drift, foul, or fail. Communications links can drop. Telemetry may introduce latency. Data streams can generate false positives, alert overload, or inconsistent anomalies that do not translate cleanly into operational meaning. Dashboards can create the illusion of comprehensive visibility even when the system remains only selectively observed. A water system can become data-rich while remaining interpretively weak.
This is one of the central intellectual limits of smart water: remote awareness is not the same as true controllability. Operators may see more of the system without having the staffing, field capacity, maintenance resources, funding, or institutional authority to intervene effectively. A dashboard can reveal deterioration earlier without ensuring that crews, redundancy, public communication, or capital planning systems are in place to respond.
There is also the risk of brittle over-automation. When sensing, models, and controls are tightly linked, system performance depends on the integrity of both physical infrastructure and digital mediation. A faulty sensor can mislead an optimization routine. A communications breakdown can interrupt coordinated response. A model may perform well under typical conditions and poorly under rare or compound conditions. Smart systems therefore create a paradox: they can increase operational visibility and capability while also introducing new forms of dependence and opacity.
| Failure Mode | How It Appears | Why It Matters | Mitigation |
|---|---|---|---|
| Sensor drift or fouling | Gradual shift or false stability in readings. | Bad signals may trigger wrong alerts or suppress real problems. | Calibration, maintenance, cross-sensor checks, field validation. |
| Telemetry gaps | Missing, delayed, or stale values. | Operators may mistake absence of data for absence of risk. | Completeness metrics, stale-data flags, communications redundancy. |
| Alert overload | Too many alarms or low-confidence anomalies. | Operators may ignore or miss high-priority signals. | Alert governance, priority tiers, false-positive review. |
| Dashboard illusion | System appears comprehensively visible. | Uninstrumented assets, communities, or failure modes remain hidden. | Coverage audits and known-blind-spot statements. |
| Model opacity | Recommendations are difficult to interpret or contest. | Decision authority shifts into poorly understood digital systems. | Model cards, explainability, validation, operator training. |
| Automation brittleness | Control logic behaves poorly under unusual conditions. | Fast action can amplify error if fail-safes are weak. | Safety constraints, overrides, simulation, event review. |
| Capacity mismatch | Digital visibility outpaces staff, field crews, or maintenance ability. | Problems are detected but not resolved. | Workforce planning, response protocols, funding alignment. |
Smartness, if weakly integrated, can become a new obscurity rather than a new intelligence. The test is whether digital visibility improves accountable response under real operating conditions.
Governance, Workforce, and Unequal Digital Capacity
Smart water systems are governance infrastructures because they change how institutions perceive, prioritize, and intervene in water systems. Decisions about where sensors are installed, what thresholds trigger alarms, which data are shared, when automation is allowed, how anomalies are escalated, and who is responsible for response all shape how the infrastructure is governed. These are not merely engineering decisions. They are institutional choices about visibility, authority, privacy, service reliability, and acceptable risk.
Workforce capacity is central. Smart systems can help utilities operate with constrained staffing by reducing manual routine tasks and improving remote awareness, but only if people can interpret and act on what the system reveals. A utility with advanced sensing but limited analytical staff, weak maintenance capacity, or unclear response protocols may become data-rich but operationally fragile. In that sense, smart water is as much a labor and organizational challenge as a technology challenge.
There is also an inequality dimension. Better-resourced utilities and jurisdictions are often more capable of implementing richer sensing, AMI, digital twins, real-time analytics, and coordinated control, while smaller or lower-capacity systems may struggle with communications, maintenance, integration, cybersecurity, and capital cost. Operational visibility therefore becomes unevenly distributed. Smart water can widen differences in resilience and responsiveness if digital capacity grows faster in already advantaged systems than in vulnerable ones.
| Governance Responsibility | Question | Evidence |
|---|---|---|
| Sensor governance | Who decides where instrumentation is installed and what remains unobserved? | Coverage plan, placement rationale, blind-spot audit |
| Data-quality governance | How are drift, missingness, stale data, and false alerts handled? | QA/QC policy, anomaly log, maintenance record |
| Alert governance | Which signals trigger alarms, escalation, investigation, or public communication? | Threshold registry, escalation matrix, response-time targets |
| Model governance | How are digital models and twins validated, updated, and explained? | Model card, validation report, update log, uncertainty statement |
| Control governance | When can automated or semi-automated action occur? | Control policy, fail-safe plan, override log, safety review |
| Workforce governance | Do staff have the skills, time, and authority to use smart-water outputs? | Training plan, role definitions, operational runbooks |
| Equity and capacity governance | Are low-capacity systems, vulnerable communities, and less visible assets included? | Capacity assessment, funding plan, coverage equity review |
| Public accountability | Can decisions and claims based on smart systems be explained and contested? | Public evidence package, privacy policy, reporting methodology |
Operational visibility is a form of power. Institutions that can see more of their system, earlier and more coherently, can govern it differently. Where digital visibility is weak, systems remain more exposed to delayed recognition and reactive governance.
Future Directions
The future of smart water lies in deeper coupling across environmental sensing, metering, telemetry, real-time analytics, digital twins, field response, and control. The direction of travel is toward systems that are more continuous, more integrated, more predictive, and more intervention-capable. Source-water observation, treatment optimization, distribution awareness, sewer and stormwater control, and customer-side demand visibility are likely to become more interconnected rather than less.
Artificial intelligence and digital twin systems will likely expand the use of anomaly detection, predictive maintenance, hydraulic forecasting, treatment-process optimization, demand forecasting, sewer overflow prediction, and scenario testing. But these tools will also make governance more important. If models infer system condition from live streams and recommend operational actions, the system must preserve input quality, model version, calibration status, validation results, uncertainty, operator override, and post-event review. Otherwise smart water may intensify automation without strengthening accountability.
The deeper challenge is not simply to instrument more of the water system. It is to build trustworthy, interpretable, and operationally useful infrastructures that improve resilience without producing brittle dependence on poorly integrated digital stacks. Future systems will need stronger data validation, better human-system interfaces, clearer distinctions between decision support and automation, more robust communications, stronger cybersecurity, and more coherent links between sensing and field response.
Smart water systems are therefore not just digital upgrades to conventional utilities or environmental programs. They are infrastructures through which water systems become more continuously observable, more analytically tractable, and in some cases more actively governable. Where they are strong, failures can be detected earlier, operations can be tuned more intelligently, and resilience can be improved before disruption escalates. Where they are weakly integrated, smartness may amount to little more than networked opacity. In that sense, smart water systems are infrastructures of operational visibility, selective automation, unequal capacity, and temporal water governance.
Deployment Readiness Gate
Before a smart water system is used for treatment optimization, water-quality surveillance, leakage detection, advanced metering, wet-weather control, digital twin operation, automated control, public reporting, or resilience planning, it should pass a deployment readiness gate. This gate should test whether the system is technically reliable, operationally meaningful, data-quality aware, workforce-ready, and governance-aligned.
| Readiness Area | Required Question | Pass Evidence |
|---|---|---|
| Purpose readiness | Does the system match the service goal, water domain, decision use, and response expectation? | Objective manifest, use-case statement, service outcome target |
| Coverage readiness | Are the right assets, zones, watersheds, customers, or processes instrumented? | Coverage map, blind-spot audit, placement rationale |
| Telemetry readiness | Are latency, completeness, stale data, and communications outages visible? | Telemetry report, latency thresholds, outage log |
| Data-quality readiness | Are drift, fouling, false values, missing data, and plausibility checks handled? | QA/QC policy, validation flags, calibration and maintenance log |
| Analytics readiness | Are thresholds, anomaly rules, forecasts, and models validated and explainable? | Threshold registry, model card, validation report, uncertainty note |
| Response readiness | Are alerts linked to escalation, work orders, sampling, dispatch, or operational action? | Response protocol, work-order integration, role assignments |
| Control readiness | Are automated or semi-automated actions bounded by safety constraints and overrides? | Control policy, fail-safe design, override log, safety review |
| Workforce readiness | Do staff have the skills, authority, and time to interpret and act on system outputs? | Training plan, runbooks, staffing and maintenance plan |
| Governance readiness | Are public accountability, privacy, equity, cybersecurity, revision, and reporting responsibilities defined? | Governance log, public evidence package, privacy and cybersecurity notes |
This readiness gate prevents smart water from being treated as complete merely because data are streaming. The stronger standard is whether the system can support reliable, timely, accountable response.
Data and Configuration Artifacts
A reproducible smart-water workflow should include explicit artifacts for objectives, sensors, telemetry, observations, QA/QC, thresholds, models, alerts, work orders, control policies, and governance. These artifacts make smart-water decisions auditable rather than hidden inside dashboards, black-box models, or undocumented operational routines.
| Artifact | Purpose | Suggested Path |
|---|---|---|
| Smart water objective manifest | Defines service goal, water domain, monitored variables, decision use, and response expectations. | config/smart_water_objective.yml |
| Sensor and asset registry | Stores sensor ID, asset ID, location, parameter, unit, calibration, owner, and maintenance status. | data/sensor_asset_registry.csv |
| Telemetry status records | Tracks expected readings, received readings, latency, stale data, outages, and completeness. | data/telemetry_status_records.csv |
| Water-system observation records | Stores pressure, flow, level, quality, storage, pump, rainfall, and metering readings. | data/water_observation_records.csv |
| QA/QC and validation policy | Defines plausibility checks, drift flags, fouling detection, confirmation sampling, and stale-data handling. | config/qaqc_validation_policy.yml |
| Threshold and alert registry | Documents alert levels, anomaly rules, response owners, escalation, and valid-use limits. | data/threshold_alert_registry.csv |
| Digital twin or model card | Documents data feeds, update frequency, calibration, validation, assumptions, and decision scope. | model_cards/digital_twin_model_card.md |
| Response and work-order log | Tracks alerts, investigations, operational changes, dispatch, sampling, and outcomes. | data/response_work_order_log.csv |
| Control and fail-safe policy | Defines automation boundaries, human override, fallback state, and safety constraints. | config/control_failsafe_policy.yml |
| Smart-water governance log | Tracks threshold changes, model updates, public caveats, cybersecurity notes, and accountability decisions. | data/smart_water_governance_log.csv |
These artifacts turn smart water into a reproducible cyber-physical evidence system rather than a loose collection of connected devices and dashboards.
Mathematical Lens: Telemetry, Detection, Decision Latency, and Control Readiness
Several simple metrics can help evaluate smart-water readiness. These metrics are not substitutes for engineering judgment, operator expertise, cybersecurity review, field validation, or public governance, but they make operational evidence quality more inspectable.
C_{\mathrm{telemetry}} = \frac{N_{\mathrm{received\ readings}}}{N_{\mathrm{expected\ readings}}}
\]
Interpretation: Telemetry completeness shows whether the system is receiving enough expected readings to support operational awareness.
L_{\mathrm{response}} = T_{\mathrm{action}} – T_{\mathrm{detection}}
\]
Interpretation: Response latency measures the time between detecting a condition and taking operational action.
R_{\mathrm{loss}} = \frac{V_{\mathrm{produced}} – V_{\mathrm{billed}}}{V_{\mathrm{produced}}}
\]
Interpretation: A simplified water-loss ratio compares produced water with billed or accounted water, helping identify non-revenue water review needs.
P_{\mathrm{alert}} = f(S_{\mathrm{signal}}, Q_d, B_{\mathrm{baseline}}, H_{\mathrm{history}})
\]
Interpretation: Alert confidence depends on signal strength, data quality, baseline behavior, and historical context.
Q_{\mathrm{smart\ water}} =
w_1C_s +
w_2Q_d +
w_3C_t +
w_4L_r +
w_5A_c +
w_6R_c +
w_7M_r +
w_8S_{\mathrm{control}} +
w_9G_r
\]
Interpretation: Smart-water quality depends on sensing coverage, data validity, telemetry completeness, latency readiness, anomaly confidence, response capacity, model readiness, control safety, and governance.
These measures evaluate smart water as an operational evidence system. They ask whether connected infrastructure improves validated awareness, response timing, and accountable action rather than simply increasing data volume.
Python Workflow: Smart Water Readiness and Operational Evidence Quality
A Python workflow can demonstrate how smart water systems might be evaluated for sensing coverage, data-quality validity, telemetry completeness, latency readiness, anomaly confidence, response capacity, model readiness, control safety, and governance readiness. The purpose is not to create a universal score, but to make operational evidence-quality dimensions visible.
from dataclasses import dataclass
from typing import List
import pandas as pd

@dataclass
class SmartWaterProgram:
    program_id: str
    water_domain: str
    service_goal: str
    sensing_coverage: float
    data_quality_validity: float
    telemetry_completeness: float
    latency_readiness: float
    anomaly_confidence: float
    response_capacity: float
    model_readiness: float
    control_safety: float
    governance_readiness: float
    high_stakes_use: bool

def smart_water_quality(program: SmartWaterProgram) -> float:
    return (
        0.11 * program.sensing_coverage +
        0.13 * program.data_quality_validity +
        0.12 * program.telemetry_completeness +
        0.10 * program.latency_readiness +
        0.10 * program.anomaly_confidence +
        0.13 * program.response_capacity +
        0.10 * program.model_readiness +
        0.10 * program.control_safety +
        0.11 * program.governance_readiness
    )

def classify_review_priority(program: SmartWaterProgram, score: float) -> str:
    if program.high_stakes_use and program.data_quality_validity < 0.75:
        return "high_stakes_data_quality_review"
    if program.telemetry_completeness < 0.80:
        return "telemetry_completeness_review"
    if program.response_capacity < 0.75:
        return "response_capacity_review"
    if program.control_safety < 0.75:
        return "control_safety_review"
    if program.model_readiness < 0.70:
        return "model_readiness_review"
    if program.governance_readiness < 0.75:
        return "governance_readiness_review"
    if score < 0.75:
        return "smart_water_quality_review"
    return "routine_monitoring"

programs: List[SmartWaterProgram] = [
    SmartWaterProgram(
        "distribution-online-quality",
        "distribution_system",
        "water_quality_surveillance",
        0.78,
        0.82,
        0.91,
        0.86,
        0.78,
        0.80,
        0.72,
        0.76,
        0.84,
        True,
    ),
    SmartWaterProgram(
        "ami-leak-detection",
        "customer_metering",
        "demand_visibility_and_leak_detection",
        0.84,
        0.80,
        0.88,
        0.82,
        0.76,
        0.70,
        0.68,
        0.74,
        0.78,
        True,
    ),
    SmartWaterProgram(
        "wet-weather-smart-sewer",
        "sewer_stormwater",
        "overflow_risk_reduction",
        0.72,
        0.76,
        0.82,
        0.78,
        0.74,
        0.68,
        0.76,
        0.70,
        0.74,
        True,
    ),
    SmartWaterProgram(
        "treatment-digital-twin",
        "treatment_process",
        "process_optimization",
        0.80,
        0.84,
        0.90,
        0.88,
        0.82,
        0.82,
        0.86,
        0.80,
        0.86,
        True,
    ),
]

records = []
for program in programs:
    score = smart_water_quality(program)
    records.append({
        "program_id": program.program_id,
        "water_domain": program.water_domain,
        "service_goal": program.service_goal,
        "sensing_coverage": program.sensing_coverage,
        "data_quality_validity": program.data_quality_validity,
        "telemetry_completeness": program.telemetry_completeness,
        "latency_readiness": program.latency_readiness,
        "anomaly_confidence": program.anomaly_confidence,
        "response_capacity": program.response_capacity,
        "model_readiness": program.model_readiness,
        "control_safety": program.control_safety,
        "governance_readiness": program.governance_readiness,
        "smart_water_quality": round(score, 3),
        "review_priority": classify_review_priority(program, score),
    })

df = pd.DataFrame(records)
print(df.sort_values(["review_priority", "smart_water_quality"]))
This workflow treats smart water programs as evidence and response systems. A program is not ready merely because it has connected sensors, meters, dashboards, or models. It must preserve enough evidence about coverage, data quality, telemetry, latency, anomaly confidence, response capacity, model readiness, control safety, and governance to support the intended operational claim.
R Workflow: Smart Water Monitoring, Response, and Governance Readiness
An R workflow can support smart-water governance by summarizing readiness across water-quality monitoring, AMI, sewer and stormwater control, treatment optimization, and digital twin programs. This is useful for operational audits, public evidence packages, grant planning, and readiness review.
library(dplyr)
library(readr)

smart_water_programs <- tribble(
  ~program_id, ~water_domain, ~service_goal, ~sensing_coverage, ~data_quality_validity, ~telemetry_completeness, ~latency_readiness, ~anomaly_confidence, ~response_capacity, ~model_readiness, ~control_safety, ~governance_readiness, ~high_stakes_use,
  "distribution-online-quality", "distribution_system", "water_quality_surveillance", 0.78, 0.82, 0.91, 0.86, 0.78, 0.80, 0.72, 0.76, 0.84, TRUE,
  "ami-leak-detection", "customer_metering", "demand_visibility_and_leak_detection", 0.84, 0.80, 0.88, 0.82, 0.76, 0.70, 0.68, 0.74, 0.78, TRUE,
  "wet-weather-smart-sewer", "sewer_stormwater", "overflow_risk_reduction", 0.72, 0.76, 0.82, 0.78, 0.74, 0.68, 0.76, 0.70, 0.74, TRUE,
  "treatment-digital-twin", "treatment_process", "process_optimization", 0.80, 0.84, 0.90, 0.88, 0.82, 0.82, 0.86, 0.80, 0.86, TRUE
)

smart_water_summary <- smart_water_programs %>%
  mutate(
    smart_water_quality = round(
      0.11 * sensing_coverage +
      0.13 * data_quality_validity +
      0.12 * telemetry_completeness +
      0.10 * latency_readiness +
      0.10 * anomaly_confidence +
      0.13 * response_capacity +
      0.10 * model_readiness +
      0.10 * control_safety +
      0.11 * governance_readiness,
      3
    ),
    review_priority = case_when(
      high_stakes_use & data_quality_validity < 0.75 ~ "high_stakes_data_quality_review",
      telemetry_completeness < 0.80 ~ "telemetry_completeness_review",
      response_capacity < 0.75 ~ "response_capacity_review",
      control_safety < 0.75 ~ "control_safety_review",
      model_readiness < 0.70 ~ "model_readiness_review",
      governance_readiness < 0.75 ~ "governance_readiness_review",
      smart_water_quality < 0.75 ~ "smart_water_quality_review", TRUE ~ "routine_monitoring" ) ) %>%
  arrange(review_priority, smart_water_quality)

print(smart_water_summary)

write_csv(
  smart_water_summary,
  "outputs/smart_water_readiness_summary.csv"
)
The R workflow emphasizes that smart-water review should account for sensing coverage, data quality, telemetry, latency, response capacity, model readiness, control safety, and governance. These dimensions help prevent digital water programs from being judged by connectivity alone.
Systems Code: Sensors, Telemetry, Digital Twins, Alerts, and Governance Logs
Smart water depends on full-stack cyber-physical systems code. The stack includes sensor registries, telemetry streams, water-observation schemas, AMI data, threshold registries, anomaly detection, digital twin data feeds, work-order integration, control policies, QA/QC rules, dashboards, and governance logs. A serious companion repository should therefore include both analytical workflows and systems-code scaffolding.
| Language / Tool | Role in Companion Repository | Example Use |
|---|---|---|
| Python | Smart-water readiness scoring, anomaly review, telemetry analysis, and uncertainty summaries | Operational evidence-quality scoring and review prioritization |
| R | Monitoring-program summaries, public evidence tables, and governance readiness review | Operational audit outputs and reporting-ready summaries |
| SQL | Sensor registries, telemetry records, observations, alerts, models, response logs, and governance logs | Auditable smart-water database schema |
| GeoJSON | Asset locations, sensor sites, pressure zones, sewersheds, stormwater basins, and monitoring areas | Spatial registry for smart-water infrastructure |
| TypeScript | Dashboard and platform data models | Sensor-status cards, alert panels, digital twin readiness displays |
| Go | Lightweight smart-water program status endpoint | Expose telemetry, validation, alert, response, and control readiness |
| Rust | Safe validation CLI for observation, telemetry, and alert records | Validate required fields, units, timestamps, and quality flags |
| C / C++ | Low-level embedded sensor-record and control-event examples | Demonstrate field-device records and bounded control-event processing |
| Shell scripts | Reproducible directory, validation, and export workflows | One-command scaffold validation and output generation |
This breadth is appropriate because smart water is not only water monitoring. It is evidence infrastructure spanning sensors, telemetry, analytics, operations, cyber-physical control, workforce capacity, and governance.
GitHub Repository
A companion repository for this article should translate the smart-water framework into reproducible technical scaffolding. The repository should include objective manifests, sensor and asset registries, telemetry records, water-observation tables, QA/QC policies, threshold registries, model cards, response logs, control policies, readiness scoring workflows, SQL schemas, dashboard data types, and governance logs.
Testing and Validation
Testing smart water systems requires more than confirming that devices transmit readings. It requires validating sensor placement, calibration, telemetry completeness, latency, data quality, alert logic, model assumptions, response workflows, control boundaries, cybersecurity readiness, and public evidence. A smart water program can appear sophisticated while producing weak operational intelligence if any part of the chain is undocumented or untested.
| Test Type | Purpose | Example Test |
|---|---|---|
| Sensor-placement test | Ensure devices observe the intended process, asset, or risk pathway. | Compare placement against hydraulic zones, source-water locations, treatment stages, or sewersheds. |
| Calibration and maintenance test | Ensure sensor readings remain valid over time. | Review calibration, fouling, drift, cleaning, and maintenance records. |
| Telemetry test | Ensure expected readings arrive with acceptable latency and completeness. | Calculate received versus expected records and stale-data frequency. |
| QA/QC test | Ensure implausible, missing, stale, or failed readings are flagged before use. | Run plausibility, range, drift, flatline, and cross-sensor checks. |
| Alert test | Ensure alarms and anomaly rules match operational priorities and do not overload staff. | Review false positives, false negatives, escalation, and alert fatigue. |
| Model or digital twin test | Ensure model outputs are validated, calibrated, and bounded by known assumptions. | Compare model predictions with observed events and maintain model cards. |
| Response workflow test | Ensure alerts connect to field investigation, work orders, sampling, or operational action. | Trace alert-to-action time and outcome documentation. |
| Control safety test | Ensure automation respects fail-safes, overrides, and safety constraints. | Simulate sensor failure, communications loss, and boundary conditions. |
| Governance test | Ensure public claims, privacy, equity, cybersecurity, and accountability are addressed. | Review public evidence package, governance log, and access rules. |
Validation should test the smart water system as a cyber-physical evidence and response chain. The decisive question is not whether data are streaming, but whether those data can support reliable, accountable operational action.
Operational Signals and Smart-Water Observability
Smart water systems must observe themselves. A system that monitors water but cannot report sensor health, telemetry completeness, stale data, alert performance, model validity, response time, work-order outcomes, control overrides, cybersecurity status, and public caveats is operationally fragile. Monitoring-system observability should track both technical workflow health and operational evidence health.
| Signal | Why It Matters | Failure Indicator |
|---|---|---|
| Sensor health | Determines whether field readings are current, plausible, and valid. | Drift, fouling, flatline, impossible values, stale data. |
| Telemetry completeness | Determines whether operational platforms receive expected readings. | Hidden gaps, delayed records, communications outage. |
| Latency status | Determines whether data arrive quickly enough for the use case. | Alert arrives after actionable window has closed. |
| Alert performance | Determines whether rules detect real issues without overwhelming staff. | Too many false positives, missed events, ignored alarms. |
| Model validity | Determines whether digital models remain calibrated and useful. | Predictions diverge from observed outcomes without review. |
| Response capacity | Determines whether detection leads to field or operational action. | Alerts accumulate without work orders, dispatch, or closure. |
| Control override status | Determines whether automation remains bounded and accountable. | Unexpected control actions, override failures, undocumented manual changes. |
| Cybersecurity and access status | Determines whether connected systems are protected from misuse or disruption. | Untracked access, outdated credentials, weak segmentation, unmanaged devices. |
| Public evidence readiness | Determines whether smart-water claims can be interpreted and contested. | No method note, no caveat, no governance owner, no equity or privacy review. |
Operational observability protects smart water from silent evidence degradation. It helps ensure that digital visibility does not outlast the quality, safety, and accountability of the cyber-physical system beneath it.
Engineer and Researcher Checklist
- Define the water domain, service goal, monitored variables, decision use, and response expectation before selecting sensors or platforms.
- Distinguish water monitoring, telemetry, intelligence, decision support, digital twins, and automated control rather than treating them as interchangeable.
- Document sensor location, asset linkage, parameter, unit, calibration status, maintenance owner, and quality flags.
- Track telemetry completeness, latency, stale data, outages, and communications reliability.
- Use QA/QC rules to flag drift, fouling, impossible values, flatlines, missingness, and sensor disagreement.
- Maintain threshold registries and alert rationales for water-quality, hydraulic, metering, sewer, and stormwater signals.
- Connect alerts to escalation protocols, confirmation sampling, work orders, field response, or operational action.
- Distinguish digital models from digital twins and document data feeds, update frequency, calibration, validation, and assumptions.
- Define control boundaries, human override, fail-safe behavior, and audit trails before enabling semi-automated or automated action.
- Plan for workforce capacity, training, cybersecurity, maintenance, and data stewardship as part of system design.
- Audit which assets, communities, watersheds, or risks remain under-observed.
- Provide public evidence packages that explain methods, limits, privacy, equity, uncertainty, and valid-use boundaries.
Where This Fits in the Series
This article connects Environmental Monitoring Systems to water quality monitoring, river and watershed monitoring, flood monitoring, environmental data platforms, IoT architectures, edge computing, intelligent infrastructure systems, and risk and resilience. It sits at the cyber-physical water layer of the series: the point where environmental sensing, utility operations, telemetry, analytics, and control begin to form a shared architecture of water intelligence.
Within the broader series, this article provides the smart-water framework that supports water quality monitoring systems, river and watershed monitoring networks, flood monitoring systems and hydrological risk detection, environmental data platforms and decision support systems, environmental analytics and monitoring dashboards, IoT architectures for environmental monitoring, edge computing in environmental monitoring, and embedded monitoring devices for field observation. Its role is to show that water-system intelligence does not emerge from sensing alone. It emerges from the relationship among measurement, telemetry, validation, context, response, control, workforce capacity, and governance.
Related articles
- Environmental Monitoring Systems
- Water Quality Monitoring Systems
- River and Watershed Monitoring Networks
- Flood Monitoring Systems and Hydrological Risk Detection
- Environmental Data Platforms and Decision Support Systems
- Environmental Analytics and Monitoring Dashboards
- IoT Architectures for Environmental Monitoring
- Edge Computing in Environmental Monitoring
- Embedded Monitoring Devices for Field Observation
Further reading
- U.S. Environmental Protection Agency (2026) Water Sensors Toolbox. Available at: https://www.epa.gov/water-research/water-sensors-toolbox
- U.S. Environmental Protection Agency (2025) Online Water Quality Monitoring Resources. Available at: https://www.epa.gov/waterresilience/online-water-quality-monitoring-resources
- U.S. Environmental Protection Agency (2024) Intelligent Water Systems. Available at: https://www.epa.gov/system/files/documents/2024-04/cwsrf-intelligent-water-systems.pdf
- U.S. Environmental Protection Agency (2022) Advanced Metering Infrastructure. Available at: https://www.epa.gov/watersense/advanced-metering-infrastructure
- U.S. Environmental Protection Agency (2021) Smart Sewer Systems and Smart Data Infrastructure. Available at: https://www.epa.gov/system/files/documents/2021-11/smart-sewer-webinar.pdf
- U.S. Environmental Protection Agency (2022) Improving Water Management Using Advanced Metering Infrastructure Data: A Guide for Facility Managers. Available at: https://www.epa.gov/system/files/documents/2022-09/ws-commercial-ami-guide-facility-managers.pdf
- American Water Works Association (2026) Intelligent Water Systems. Available at: https://www.awwa.org/intelligent-water-systems/
- American Water Works Association (2026) Digital Twins. Available at: https://www.awwa.org/resource/digital-twins/
- Water Quality Portal (2026) Water Quality Portal. Available at: https://www.waterqualitydata.us/
References
- American Water Works Association (2026) Digital Twins. Available at: https://www.awwa.org/resource/digital-twins/ (Accessed: 14 May 2026).
- American Water Works Association (2026) Intelligent Water Systems. Available at: https://www.awwa.org/intelligent-water-systems/ (Accessed: 14 May 2026).
- U.S. Environmental Protection Agency (2021) Smart Sewer Systems and Smart Data Infrastructure. Available at: https://www.epa.gov/system/files/documents/2021-11/smart-sewer-webinar.pdf (Accessed: 14 May 2026).
- U.S. Environmental Protection Agency (2022) Advanced Metering Infrastructure. Available at: https://www.epa.gov/watersense/advanced-metering-infrastructure (Accessed: 14 May 2026).
- U.S. Environmental Protection Agency (2022) Improving Water Management Using Advanced Metering Infrastructure Data: A Guide for Facility Managers. Available at: https://www.epa.gov/system/files/documents/2022-09/ws-commercial-ami-guide-facility-managers.pdf (Accessed: 14 May 2026).
- U.S. Environmental Protection Agency (2024) Intelligent Water Systems. Available at: https://www.epa.gov/system/files/documents/2024-04/cwsrf-intelligent-water-systems.pdf (Accessed: 14 May 2026).
- U.S. Environmental Protection Agency (2025) Online Water Quality Monitoring Resources. Available at: https://www.epa.gov/waterresilience/online-water-quality-monitoring-resources (Accessed: 14 May 2026).
- U.S. Environmental Protection Agency (2026) Water Sensors Toolbox. Available at: https://www.epa.gov/water-research/water-sensors-toolbox (Accessed: 14 May 2026).
- Water Quality Portal (2026) Water Quality Portal. Available at: https://www.waterqualitydata.us/ (Accessed: 14 May 2026).