
Last Updated June 1, 2026
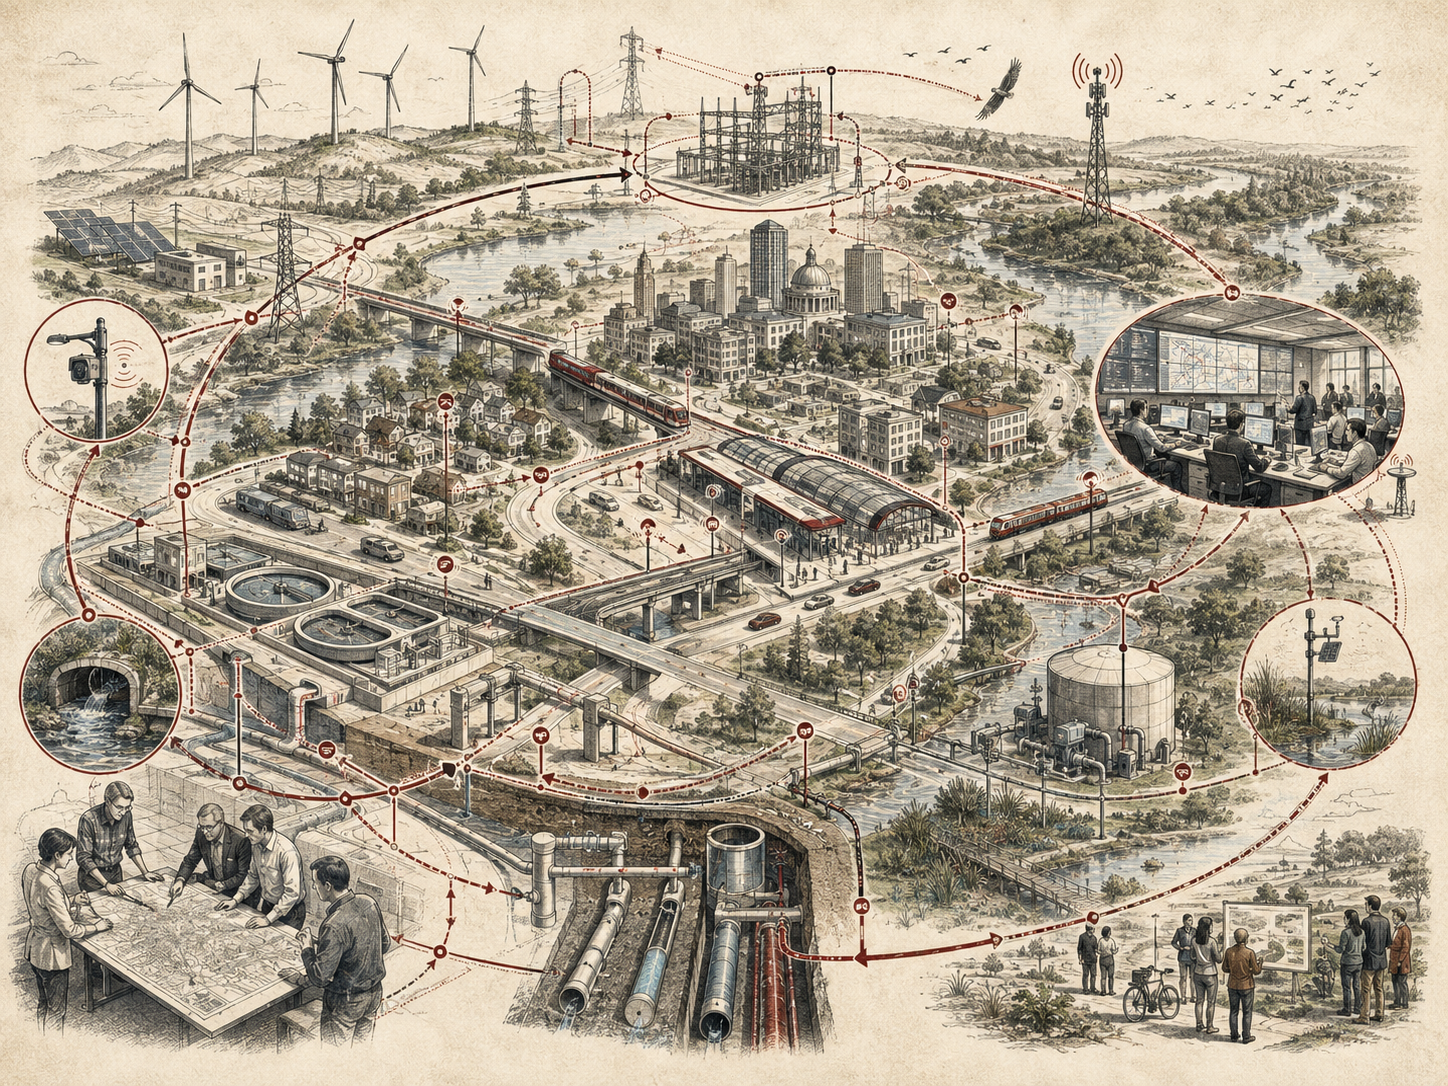
Infrastructure is no longer only concrete, steel, pipes, wires, roads, bridges, pumps, substations, ports, rail corridors, buildings, sensors, and control rooms. Increasingly, infrastructure is becoming intelligent: instrumented, connected, data-producing, algorithmically interpreted, remotely monitored, partially automated, and governed through digital systems. Sensors detect stress. Models predict failure. Digital twins simulate scenarios. Control systems adjust operations. Maintenance teams receive alerts. Public agencies use dashboards. Private vendors manage platforms. Residents experience the consequences when these systems work, fail, exclude, or become unaccountable.
Intelligent Infrastructure as a System examines cyber-physical infrastructure through systems thinking. It asks how roads, bridges, water systems, power grids, transit networks, buildings, ports, environmental monitoring systems, public services, data platforms, artificial intelligence, governance institutions, maintenance regimes, labor, communities, and ecosystems interact. Intelligent infrastructure is not simply infrastructure with sensors attached. It is a sociotechnical system in which physical assets, digital tools, institutional decisions, public trust, environmental conditions, and human consequences are inseparable.
This article explains intelligent infrastructure as a cyber-physical, institutional, and public system. It examines sensing, data pipelines, digital twins, predictive maintenance, asset management, control systems, grid modernization, water infrastructure, transportation networks, environmental monitoring, climate adaptation, cybersecurity, vendor dependency, public governance, labor, equity, and resilience. The central argument is that intelligent infrastructure should not be judged only by technical sophistication. It should be judged by whether it improves safety, reliability, maintenance, public trust, ecological stewardship, climate resilience, democratic accountability, and equitable service over time.
Why Intelligent Infrastructure Matters
Intelligent infrastructure matters because the systems that support everyday life are under increasing stress. Roads, bridges, transit systems, water networks, wastewater systems, ports, airports, energy grids, public buildings, broadband networks, hospitals, schools, stormwater systems, and environmental monitoring systems are aging, overloaded, climate-exposed, fiscally constrained, and increasingly interdependent. At the same time, public expectations for reliability, safety, transparency, and responsiveness are rising.
Digital sensing, data analytics, automation, artificial intelligence, and connected control systems promise better visibility into infrastructure condition. They can help detect stress before failure, schedule maintenance more efficiently, reduce outages, improve energy management, monitor water quality, optimize transit operations, manage traffic flows, detect leaks, track emissions, support emergency response, and simulate future scenarios. Used responsibly, intelligent infrastructure can strengthen public capacity.
But intelligence is not automatic. A sensor does not repair a bridge. A dashboard does not fund maintenance. A predictive model does not guarantee institutional action. A digital twin does not make trade-offs disappear. A control system does not resolve governance fragmentation. A platform does not create public trust by itself. Intelligent infrastructure can improve resilience, but it can also create new dependencies, cybersecurity risks, vendor lock-in, surveillance concerns, data quality problems, maintenance burdens, unequal service, and false confidence.
| Infrastructure challenge | Intelligent-infrastructure promise | Systems-thinking concern |
|---|---|---|
| Aging assets | Predictive maintenance and condition monitoring. | Alerts do not help if maintenance funding, staffing, and procurement are weak. |
| Climate stress | Real-time monitoring, scenario planning, and adaptive operations. | Adaptation must account for vulnerable communities and future hazards, not only asset protection. |
| Service disruption | Early warning, automated control, and faster response. | Automation can fail if dependencies, cybersecurity, and human fallback are weak. |
| Infrastructure interdependence | Integrated dashboards and cross-system modeling. | Shared visibility must be matched by shared authority and accountability. |
| Public distrust | Transparent data and performance reporting. | Data transparency is not enough without reliability, participation, and repair. |
| Resource constraints | Better prioritization and lifecycle cost management. | Optimization can reproduce inequity if public values are poorly defined. |
Systems thinking matters because intelligent infrastructure is not only a technical upgrade. It changes how institutions see, prioritize, intervene, and justify decisions. It changes who has information, who controls systems, who can contest decisions, whose neighborhood is monitored, whose service is optimized, and whose risk remains invisible. Intelligent infrastructure must therefore be judged as public infrastructure, not merely digital innovation.
The central question is not whether infrastructure should become more intelligent. It is what kind of intelligence is being built, for whom, under whose governance, with what safeguards, and toward what public purpose.
Infrastructure as a Sociotechnical System
Infrastructure is sociotechnical because physical systems and social institutions are inseparable. A bridge is not only steel and concrete. It is also inspection regimes, funding structures, engineering standards, maintenance schedules, public procurement, political priorities, traffic patterns, emergency planning, community dependence, and historical investment. A water system is not only pipes and treatment plants. It is watershed governance, utility finance, public health, household affordability, regulation, maintenance crews, data systems, and trust.
Intelligent infrastructure makes this sociotechnical character more visible. Sensors, analytics, control systems, digital twins, and dashboards can expose conditions that were previously hidden. But they also add new layers: data governance, model assumptions, software maintenance, cloud providers, cybersecurity, algorithmic prioritization, vendor contracts, institutional workflows, and public communication. The infrastructure system becomes more connected, but also more dependent on digital systems.
\text{Infrastructure System} = \text{Physical Assets} + \text{Digital Systems} + \text{Institutions} + \text{Labor} + \text{Communities} + \text{Environment}
\]
Interpretation: Infrastructure performance emerges from physical assets, digital tools, institutions, workers, communities, and environmental conditions interacting over time.
Sociotechnical thinking prevents infrastructure intelligence from becoming a narrow technology story. A predictive maintenance system may produce excellent risk rankings, but if procurement delays repairs, if crews are understaffed, if budgets are insufficient, if local knowledge is ignored, or if political pressure overrides risk evidence, the system will not deliver resilience. A data platform may improve visibility, but if data is incomplete, biased toward well-monitored assets, or inaccessible to affected communities, it may reinforce unequal investment.
Infrastructure also carries history. Some communities have reliable service, tree canopy, transit access, safe roads, clean water, and resilient public buildings. Others face highway exposure, flooding, heat, underinvestment, lead pipes, poor transit, and delayed maintenance. Intelligent infrastructure should not treat the existing system as neutral. If historical inequity is treated as baseline data, optimization can reproduce it.
Systems thinking asks how infrastructure decisions are made, what values guide them, who sees the data, who benefits from monitoring, who receives repair, who carries risk, and how digital intelligence changes public responsibility.
From Physical Assets to Cyber-Physical Systems
Intelligent infrastructure is often cyber-physical infrastructure. A cyber-physical system connects physical processes with digital sensing, computation, communication, and control. A smart grid monitors electricity demand and adjusts operations. A water utility detects pressure changes and leaks. A transit agency tracks vehicles, passenger loads, signal priority, and service reliability. A bridge-monitoring system measures vibration, strain, corrosion, temperature, and load. A building automation system manages energy, ventilation, access, and safety.
This integration can improve performance. It can make invisible conditions visible, support faster response, improve asset life, reduce waste, and help institutions plan under uncertainty. But it also changes failure modes. A physical asset may fail because of age or stress. A cyber-physical system may fail because of sensor error, communications outage, software bug, cyberattack, model drift, data pipeline failure, vendor outage, poor interface design, or operator overload.
\text{Cyber-Physical Performance} = f(\text{Asset Condition}, \text{Sensor Quality}, \text{Data Flow}, \text{Model Accuracy}, \text{Control Response}, \text{Human Oversight})
\]
Interpretation: Cyber-physical infrastructure performance depends on asset condition, sensing, data pipelines, models, control systems, and human oversight.
Cyber-physical systems create tighter coupling. A sensor signal may trigger automated response. A dashboard may guide dispatch. A model may prioritize assets. A remote system may control valves, signals, gates, pumps, or grid operations. Tighter coupling can increase speed, but it can reduce time for human judgment if systems are poorly designed. The more real-time the infrastructure system becomes, the more important fallback, explainability, security, and operator training become.
The shift from physical assets to cyber-physical systems also changes governance. Infrastructure agencies must become data stewards, cybersecurity actors, software maintainers, algorithmic decision-makers, vendor managers, and public communicators. Engineering capacity must be joined with institutional, ethical, legal, and community capacity. A technically advanced infrastructure system can still be publicly weak if governance is underdeveloped.
Cyber-physical infrastructure should therefore be designed for reliability, accountability, and graceful failure. It should not become a brittle system that works well only when all digital layers behave perfectly.
Sensing, Data, and Situational Awareness
Sensing is the foundation of intelligent infrastructure. Sensors can measure vibration, strain, pressure, temperature, humidity, flow, voltage, load, traffic volume, air quality, water quality, soil moisture, noise, occupancy, emissions, rainfall, flood depth, pavement condition, structural movement, energy use, and equipment performance. These measurements can improve situational awareness, allowing institutions to see infrastructure condition more clearly and respond before crisis.
But sensing is not neutral. What is sensed becomes visible. What is not sensed may remain neglected. Well-funded systems may be monitored more intensively than underinvested systems. Central assets may receive better instrumentation than peripheral or marginalized communities. Data may be easier to collect on physical assets than on human burden, service quality, accessibility, affordability, or trust. An intelligent infrastructure system can create an illusion of objectivity while hiding what it does not measure.
Data quality matters. Sensors can drift, fail, lose calibration, produce noisy readings, or be placed in unrepresentative locations. Data can be missing, delayed, incompatible, inaccessible, or misinterpreted. A dashboard may present numbers with false precision. A model may treat sensor gaps as normal conditions. A control room may be overloaded by alerts. Situational awareness requires not just data, but reliable data, contextual interpretation, institutional action, and feedback from people who experience the system.
\text{Situational Awareness} = \text{Sensing} + \text{Data Quality} + \text{Context} + \text{Interpretation} + \text{Actionability}
\]
Interpretation: Situational awareness requires more than sensors. It requires trustworthy data, context, interpretation, and the ability to act.
Sensing also creates privacy and governance questions. Traffic sensors, cameras, license-plate systems, mobile-phone data, building occupancy systems, transit cards, and smart meters may reveal patterns about movement, behavior, residence, income, work, association, or vulnerability. Infrastructure sensing must therefore distinguish between asset monitoring and people monitoring. Public-purpose data collection should be proportionate, transparent, accountable, secure, and limited to legitimate uses.
Systems thinking asks what is being sensed, why it is being sensed, who controls the data, who can access it, what decisions it informs, what communities can contest, and what remains invisible. A good infrastructure intelligence system expands public understanding without turning public space into unchecked surveillance.
Predictive Maintenance and Asset Management
Predictive maintenance uses data, models, inspections, sensor readings, historical failure patterns, environmental conditions, and operational loads to estimate when infrastructure assets are likely to fail or require intervention. The goal is to move from reactive maintenance toward planned, risk-informed, lifecycle stewardship. Instead of waiting for a pump, bridge component, rail segment, pipe, transformer, signal, or pavement section to fail, agencies can prioritize preventive repair.
Predictive maintenance can improve safety and reduce cost when it helps institutions intervene early. It can reduce emergency repairs, extend asset life, improve reliability, and allocate limited resources more intelligently. But predictive maintenance is not only a modeling problem. It depends on maintenance crews, budgets, spare parts, procurement systems, inspection standards, institutional trust, governance priorities, and political willingness to fund repair before visible failure.
R_i = f(C_i, A_i, L_i, E_i, H_i, M_i)
\]
Interpretation: Asset risk \(R_i\) can be estimated from condition \(C_i\), age \(A_i\), load \(L_i\), environmental exposure \(E_i\), failure history \(H_i\), and maintenance history \(M_i\).
Asset management should also include consequence. Two assets may have similar failure probability, but very different public consequences. A bridge serving a hospital, a water main serving a vulnerable neighborhood, a transformer supporting cooling centers, or a transit line serving low-income commuters may have higher social criticality than asset condition alone suggests. Intelligent maintenance should combine technical condition with service importance, equity, redundancy, and vulnerability.
| Asset-management factor | What it captures | Systems-thinking concern |
|---|---|---|
| Physical condition | Observed deterioration, wear, stress, defects, or performance decline. | Condition data may be incomplete or uneven across neighborhoods. |
| Failure probability | Likelihood of malfunction, collapse, outage, leak, or service disruption. | Probability alone misses social consequence. |
| Consequence of failure | Impact on safety, service, cost, mobility, health, environment, or economy. | Consequences should include vulnerable populations and essential access. |
| Redundancy | Availability of alternative routes, backup systems, or substitute capacity. | Lack of redundancy can make ordinary failure become systemic disruption. |
| Maintenance feasibility | Staff, budget, procurement, parts, permitting, and scheduling capacity. | Technical prioritization fails without institutional capacity. |
| Equity priority | Exposure of historically underserved or high-vulnerability communities. | Optimization must not reproduce past disinvestment. |
Predictive maintenance should not become a black-box ranking system that hides public values. Communities deserve to know how priorities are set, what data is used, how equity is included, and how decisions can be reviewed. Asset intelligence is public intelligence only when it supports accountable stewardship.
Digital Twins, Simulation, and Scenario Planning
A digital twin is a dynamic digital representation of a physical system, asset, process, or network. In infrastructure, digital twins may represent buildings, bridges, water systems, power grids, transit systems, ports, construction sites, cities, watersheds, or regional infrastructure networks. They can integrate sensor data, engineering models, maps, maintenance records, operational data, environmental data, and scenario assumptions.
Digital twins can support planning and decision-making. Agencies can test maintenance strategies, simulate flood conditions, model traffic disruption, evaluate energy demand, plan evacuation, estimate failure consequences, optimize operations, or compare investment scenarios. Digital twins can make complex systems more legible, especially when infrastructure interdependencies are difficult to see through static documents.
But digital twins are not neutral replicas. They are models. They include some variables and exclude others. They represent some processes with precision and simplify others. They may be strong on physical assets and weak on social vulnerability. They may model traffic flows but not disability access, displacement, public trust, informal routes, household burden, or governance delay. A digital twin is only as responsible as its assumptions, data, uses, and accountability.
\text{Digital Twin} = \text{Asset Model} + \text{Sensor Data} + \text{Operational Rules} + \text{Scenario Assumptions} + \text{Feedback}
\]
Interpretation: A digital twin combines models, data, rules, assumptions, and feedback to represent and test infrastructure behavior.
Scenario planning is essential because infrastructure systems face uncertainty. Climate conditions, population growth, technology, public finance, regulation, migration, energy demand, cyber risk, and political priorities can change. A good digital twin should help institutions compare pathways rather than pretend the future is known. It should support questions such as: What happens under extreme rainfall? What if heat waves intensify? What if a bridge closes? What if power demand rises? What if a supplier fails? What if maintenance funding is delayed? What if vulnerable neighborhoods are prioritized?
Digital twins should also be participatory where public consequences are significant. A model used to plan urban infrastructure should not be available only to technical staff and vendors. Community knowledge can reveal lived constraints, informal dependencies, trust gaps, accessibility barriers, and historical harms that are absent from data layers. Public-facing versions may need simplification, but assumptions and trade-offs should be visible.
A digital twin is useful when it strengthens public reasoning. It is dangerous when it turns contested decisions into apparently objective outputs.
Feedback Loops in Intelligent Infrastructure
Intelligent infrastructure creates feedback loops between physical systems, digital systems, institutions, and users. Sensors detect conditions. Data systems process signals. Models classify risk. Dashboards guide decisions. Agencies dispatch crews, change operations, or update plans. Those actions change asset condition, service quality, public behavior, and future data. The infrastructure system learns or fails to learn through feedback.
Feedback loops can improve infrastructure performance. Leak detection can reduce water loss. Smart signals can adjust traffic flow. Grid sensors can improve outage response. Bridge monitors can trigger inspection. Air-quality sensors can support public-health warnings. Maintenance data can improve future risk models. Public reporting can improve accountability. In these cases, feedback helps the system see, act, and learn.
But feedback loops can also create harm. If monitored areas receive more maintenance because data is richer, unmonitored areas may remain neglected. If algorithms prioritize assets based on economic value, low-income communities may be deprioritized. If automated systems reduce human inspection too much, rare or contextual risks may be missed. If public dashboards show performance without explaining uncertainty, trust may decline after failures. If surveillance tools are justified as infrastructure intelligence, public space may become over-policed.
\text{Condition}_t \rightarrow \text{Sensor Data}_t \rightarrow \text{Decision}_t \rightarrow \text{Maintenance}_{t+1} \rightarrow \text{Condition}_{t+1}
\]
Interpretation: Infrastructure feedback loops connect asset condition, sensing, decision-making, maintenance action, and future condition.
| Feedback loop | Beneficial pattern | Risk pattern |
|---|---|---|
| Condition monitoring loop | Early warning leads to preventive maintenance. | Only instrumented assets receive attention. |
| Traffic optimization loop | Signals adapt to reduce delay and improve safety. | Vehicle throughput is prioritized over pedestrians, transit, or neighborhood life. |
| Grid-response loop | Outages are detected and restored faster. | Automated control increases cyber-physical dependency. |
| Public-dashboard loop | Performance data improves transparency and accountability. | Metrics hide uncertainty, equity, or lived experience. |
| Predictive maintenance loop | Models improve as maintenance outcomes are recorded. | Model priorities become self-reinforcing if neglected areas lack data. |
Infrastructure intelligence should therefore include feedback governance. Institutions need to ask whether feedback is improving public outcomes or reinforcing blind spots. They need mechanisms for residents, workers, engineers, operators, and affected communities to challenge what the data appears to say. Feedback is strongest when machine data and human experience inform one another.
Interdependence, Cascade Risk, and System Resilience
Infrastructure systems are interdependent. Power supports water, healthcare, communications, refrigeration, traffic signals, transit, fuel distribution, and digital systems. Telecommunications support emergency response, remote monitoring, finance, logistics, and public communication. Transportation supports repair crews, supply chains, evacuation, labor access, and healthcare access. Water supports hospitals, buildings, sanitation, industry, cooling, and public health. Digital infrastructure increasingly supports all of them.
Intelligent infrastructure can help institutions see these interdependencies. But it can also deepen them. A water system that depends on remote monitoring, cloud platforms, power, telecommunications, and cybersecurity may become more visible but also more digitally dependent. A transit system that depends on automatic control, real-time data, fare systems, and predictive maintenance may improve reliability but introduce new failure pathways. A smart grid may improve balancing but increase cyber risk.
\text{Cascade Risk} = f(\text{Dependency}, \text{Coupling}, \text{Redundancy}^{-1}, \text{Detection Delay}, \text{Recovery Capacity}^{-1})
\]
Interpretation: Cascade risk increases when dependencies and tight coupling grow while redundancy, early detection, and recovery capacity are weak.
System resilience requires more than smart monitoring. It requires redundancy, diversity, modularity, emergency protocols, backup power, offline procedures, trained personnel, spare parts, mutual aid, local knowledge, cybersecurity, maintenance funding, and public communication. A system that detects failure but cannot repair it is not resilient. A system that automates response but cannot explain or override it is brittle. A system that optimizes normal operations but lacks crisis capacity is fragile.
Intelligent infrastructure should be designed to fail safely. This includes manual fallback, graceful degradation, segmented control systems, independent backups, security monitoring, emergency drills, transparent incident reporting, and recovery planning. It also includes social resilience: trusted communication, community preparedness, accessible warnings, and protection for people who cannot easily evacuate, relocate, or absorb service disruptions.
Systems thinking asks whether intelligent infrastructure reduces cascade risk or merely makes cascade risk more technologically sophisticated.
Climate Adaptation and Environmental Monitoring
Climate change is transforming infrastructure risk. Heat waves, floods, droughts, wildfires, storms, sea-level rise, extreme precipitation, freeze-thaw cycles, soil movement, coastal erosion, and ecosystem disruption affect infrastructure performance. Historical design standards are increasingly insufficient. Intelligent infrastructure can support climate adaptation by monitoring conditions, forecasting stress, modeling scenarios, and guiding preventive investment.
Environmental monitoring can track rainfall, streamflow, groundwater, soil moisture, air quality, heat, emissions, urban tree canopy, stormwater, water quality, wildfire smoke, coastal conditions, and ecosystem indicators. These data streams can support early warning, public-health communication, emergency response, watershed management, infrastructure planning, and ecological restoration. They can also reveal environmental injustice when certain communities face higher exposure to pollution, flooding, heat, or service failure.
Climate adaptation requires connecting environmental data to infrastructure decisions. A heat sensor network matters if it leads to shade, cooling centers, housing retrofits, grid reliability, worker protections, and emergency outreach. Flood monitoring matters if it leads to stormwater redesign, wetland restoration, floodplain management, drainage investment, housing protection, and evacuation planning. Air-quality monitoring matters if it informs emissions policy, public-health protections, and environmental enforcement.
\text{Climate Infrastructure Risk} = \text{Hazard} \times \text{Exposure} \times \text{Vulnerability} \div \text{Adaptive Capacity}
\]
Interpretation: Climate-related infrastructure risk depends on hazards, exposed assets and communities, vulnerability, and adaptive capacity.
Intelligent infrastructure can also create adaptation blind spots. If climate models focus on asset protection but not displacement, affordability, disability access, energy burden, or public health, adaptation may protect infrastructure while leaving people vulnerable. If resilience investments raise land values without anti-displacement protections, climate adaptation can become climate gentrification. If sensors are deployed mainly in wealthy or commercially important districts, environmental intelligence will be uneven.
Climate-intelligent infrastructure should therefore combine engineering data with equity, ecology, public health, and community knowledge. Adaptation is not only technical survival. It is the protection of life, dignity, ecological function, and public responsibility under changing conditions.
Cybersecurity, Vendor Dependency, and Digital Fragility
Intelligent infrastructure depends on digital systems, which means it also depends on cybersecurity, software maintenance, vendor reliability, data governance, network connectivity, identity management, and operational technology security. As infrastructure becomes more connected, the boundary between digital failure and physical failure becomes thinner. A cyberattack can disrupt water treatment, grid operations, transit systems, hospitals, ports, traffic management, or public services. A software outage can become an infrastructure outage.
Vendor dependency is a major systems issue. Public agencies may depend on proprietary platforms, cloud providers, sensor vendors, analytics tools, digital twin software, maintenance systems, cybersecurity contractors, or AI vendors. Vendor relationships can provide expertise and capacity, but they can also create lock-in, data access limits, cost escalation, opaque algorithms, weak interoperability, and reduced public control. Critical infrastructure should not become unintelligible to the public institutions responsible for it.
Digital fragility can also emerge through complexity. More sensors, platforms, APIs, dashboards, integrations, and automated controls can improve visibility but increase failure points. A system may become harder to maintain because too many components depend on specialized vendors, undocumented interfaces, or legacy systems. Technical sophistication can become institutional vulnerability if agencies lack internal capacity.
\text{Digital Fragility} = f(\text{Connectivity}, \text{Complexity}, \text{Vendor Lock-in}, \text{Cyber Exposure}, \text{Internal Capacity}^{-1})
\]
Interpretation: Digital fragility grows when connectivity, complexity, lock-in, and cyber exposure rise while internal institutional capacity is weak.
Responsible intelligent infrastructure requires cybersecurity by design, not as an afterthought. It also requires procurement standards, interoperability requirements, data rights, audit access, incident response, offline fallback, system documentation, staff training, and public accountability. Agencies should understand what their systems do, how they fail, who can access them, what data they produce, and how control can be restored during crisis.
The goal is not to avoid digital infrastructure. The goal is to ensure that digital intelligence strengthens public capacity rather than replacing it with opaque dependency.
Labor, Maintenance, and Institutional Capacity
Infrastructure intelligence depends on workers. Engineers, inspectors, maintenance crews, operators, dispatchers, electricians, plumbers, data analysts, cybersecurity staff, procurement specialists, planners, emergency managers, call-center workers, field technicians, and community liaisons all shape whether intelligent infrastructure works in practice. Technology may change their work, but it does not eliminate the need for institutional capacity.
Predictive maintenance systems can generate alerts, but people must inspect, prioritize, schedule, repair, document, and learn. Digital twins can simulate scenarios, but planners and decision-makers must interpret trade-offs. Sensors can detect anomalies, but field workers often know contextual causes. Dashboards can display performance, but agencies must have authority and resources to act. Intelligent infrastructure without maintenance capacity becomes a warning system for decline.
Digital systems can also intensify work. Operators may face alert fatigue. Maintenance crews may be pressured by automated rankings. Workers may be monitored more closely. Expertise may be devalued if model outputs are treated as superior to field judgment. Procurement staff may manage more complex vendor contracts. Cybersecurity responsibilities may grow without sufficient staffing. Public agencies may be expected to become digital organizations without receiving resources to build that capacity.
Institutional capacity includes technical skill, public governance, documentation, procurement competence, workforce development, maintenance funding, interagency coordination, cybersecurity readiness, data stewardship, community engagement, and long-term planning. Intelligent infrastructure should be an institutional learning system, not only a technology layer.
Systems thinking asks whether technology strengthens workers and public institutions or shifts burden onto them. A responsible intelligent infrastructure strategy should invest in people as much as sensors.
Equity, Public Trust, and Accountability
Infrastructure is not distributed equally. Some communities have strong transit, safe roads, reliable water, resilient grids, high-quality public buildings, parks, cooling, broadband, and well-maintained systems. Others experience disinvestment, pollution, unsafe streets, lead exposure, flooding, heat, unreliable service, poor transit, and delayed repair. Intelligent infrastructure can either help correct these patterns or make them more efficient to ignore.
Equity requires asking where sensors are placed, what assets are monitored, whose service disruptions count, what data is missing, how risk is weighted, and how repair priorities are set. If risk models prioritize economic value or traffic volume alone, vulnerable communities may be deprioritized. If digital services replace in-person access, people without reliable broadband, devices, language access, or digital literacy may be excluded. If smart-city tools increase surveillance in marginalized neighborhoods, infrastructure intelligence can become social control.
Public trust depends on reliability, transparency, participation, and repair. Communities are more likely to trust infrastructure systems when agencies provide accurate information, acknowledge uncertainty, respond to complaints, repair visible harm, protect privacy, and include residents in decision-making. Trust is not built by dashboards alone. It is built by dependable public action.
\text{Public Trust} = f(\text{Reliability}, \text{Transparency}, \text{Participation}, \text{Privacy}, \text{Repair})
\]
Interpretation: Public trust in intelligent infrastructure depends on reliable service, transparency, participation, privacy protection, and visible repair.
Accountability requires that intelligent infrastructure decisions can be explained and contested. If a model determines repair priority, people should be able to understand the criteria. If a sensor network triggers enforcement, people should know what data is collected and how it is used. If a vendor system shapes public service, public agencies should retain oversight. If communities are affected by deployment, they should have voice before systems are installed.
Intelligent infrastructure should make public systems more accountable, not less. It should illuminate unequal risk, not hide it behind technical language.
Ethics: Surveillance, Safety, Public Value, and the Right to Reliable Systems
Intelligent infrastructure raises ethical questions because it sits at the boundary between public service, digital power, environmental risk, physical safety, and everyday life. Infrastructure systems decide whether people can move, drink water, breathe clean air, stay cool, reach work, access care, communicate during emergencies, and trust public institutions. When these systems become intelligent, the ethical stakes include both physical reliability and digital governance.
Safety is a central ethical obligation. Bridges should not collapse. Water should be safe. Power should be reliable. Transit should be accessible. Roads should not be designed only for vehicle throughput while endangering pedestrians. Buildings should support health. Environmental monitoring should lead to protection. Intelligent infrastructure should strengthen these obligations by helping institutions prevent harm before it becomes visible crisis.
Surveillance is a central risk. Cameras, sensors, smart meters, location data, license-plate readers, building systems, transit cards, and mobility data can support operations, but they can also monitor people. The ethical question is not only whether data can improve service, but whether data collection is proportionate, transparent, rights-protecting, and limited. Public infrastructure should not become a pretext for unchecked behavioral surveillance.
Ethical intelligent infrastructure asks:
- What public purpose does the system serve?
- What data is collected, and what data is inferred?
- Who controls the data, model, dashboard, or control system?
- Who benefits from improved visibility?
- Who is exposed to surveillance, error, or exclusion?
- How are maintenance and repair priorities determined?
- Can affected communities understand and contest decisions?
- What happens if the system fails, is hacked, or becomes unavailable?
- Does the system reduce inequality or reproduce it?
- Does digital intelligence strengthen public capacity or outsource it?
There is also a right-to-reliable-systems dimension. People should not have to live with unsafe water, failing transit, collapsing bridges, uncooled homes, unreliable power, inaccessible public buildings, or preventable environmental exposure while institutions celebrate digital innovation. Intelligence should not become a substitute for maintenance, justice, and repair.
Ethical intelligent infrastructure protects people before it optimizes systems. It uses data to deepen public responsibility, not to replace it.
Examples Across Intelligent Infrastructure Systems
Intelligent infrastructure appears across transportation, water, energy, buildings, climate adaptation, public safety, environmental monitoring, and public services. The examples below show how cyber-physical systems can strengthen resilience while creating new governance responsibilities.
Smart grids
Smart grids use sensors, communications, and control systems to monitor demand, integrate distributed energy, detect outages, and improve reliability. They also increase cyber-physical dependency and require strong security, redundancy, and public oversight.
Water-system monitoring
Pressure sensors, water-quality monitoring, leak detection, and digital asset records can reduce loss and improve safety. The system must also protect affordability, public health, data integrity, and equitable repair.
Bridge and structural health monitoring
Vibration, strain, corrosion, and load sensors can support early warning and preventive maintenance. But alerts require inspection capacity, repair funding, engineering judgment, and accountable prioritization.
Intelligent transportation systems
Traffic signals, transit priority, vehicle detection, fare systems, and real-time operations can improve mobility. They can also over-prioritize vehicle throughput unless safety, transit, walking, cycling, disability access, and equity are included.
Building automation
Smart buildings can manage energy, ventilation, occupancy, security, and comfort. They must protect privacy, indoor air quality, accessibility, worker wellbeing, cybersecurity, and manual fallback.
Flood and stormwater systems
Rain gauges, stream sensors, flood models, and stormwater controls can support early warning and adaptive management. The system must also address land use, wetlands, housing vulnerability, drainage equity, and climate change.
Environmental monitoring networks
Air-quality, heat, water, soil, and emissions sensors can reveal exposure patterns. Their public value depends on enforcement, health protection, community access, and action, not monitoring alone.
Digital twins for cities
Urban digital twins can simulate infrastructure scenarios, but they must make assumptions visible and include social vulnerability, public participation, and governance consequences.
Across these examples, the central systems question is not whether infrastructure can generate more data. It is whether data improves public safety, resilience, justice, maintenance, ecological stewardship, and accountable governance.
Mathematics, Computation, and Modeling
Intelligent infrastructure can be modeled through asset-condition models, failure probability, consequence analysis, lifecycle cost models, digital twins, network dependency analysis, sensor reliability, anomaly detection, risk scoring, climate exposure modeling, maintenance optimization, resilience indices, and scenario analysis. These tools can support better decisions when assumptions are transparent and public values are explicit.
A basic asset risk score can be represented as:
Risk_i = P(F_i) \times C(F_i)
\]
Interpretation: Risk for asset \(i\) can be represented as the probability of failure \(P(F_i)\) multiplied by the consequence of failure \(C(F_i)\).
A maintenance priority score can include condition, consequence, redundancy, and equity:
Priority_i = w_cC_i + w_rR_i + w_sS_i + w_eE_i – w_dD_i
\]
Interpretation: A maintenance priority score can combine condition, risk, service criticality, equity priority, and redundancy. The weights reflect public values.
Sensor reliability can be represented conceptually as:
Reliability_s = 1 – P(\text{false alarm}) – P(\text{missed detection}) – P(\text{data loss})
\]
Interpretation: Sensor reliability declines when false alarms, missed detections, and data loss increase.
An infrastructure resilience index can be represented as:
RI = w_mM + w_rR + w_bB + w_aA + w_gG + w_eE
\]
Interpretation: A resilience index can combine maintenance capacity, redundancy, buffers, adaptive capacity, governance readiness, and equity performance.
A cyber-physical dependency score can be represented as:
D_{cp} = f(\text{Connectivity}, \text{Vendor Reliance}, \text{Control Coupling}, \text{Fallback Capacity}^{-1})
\]
Interpretation: Cyber-physical dependency grows with connectivity, vendor reliance, and tight control coupling, especially when fallback capacity is weak.
| Modeling task | Infrastructure systems question | Example output |
|---|---|---|
| Asset-condition modeling | Which assets are deteriorating, and how quickly? | Condition scores, deterioration curves, inspection priorities. |
| Failure consequence analysis | What happens if this asset fails? | Service disruption, safety risk, equity impact, cascade pathways. |
| Predictive maintenance | When should preventive repair occur? | Maintenance schedule, expected failure reduction, lifecycle cost. |
| Digital twin simulation | How does the system behave under scenarios? | Flood response, traffic disruption, grid stress, repair sequencing. |
| Cyber-physical risk analysis | What digital dependencies could cause physical disruption? | Vendor, cloud, control, cybersecurity, and fallback risk scores. |
| Equity and resilience scoring | Who benefits from repair, monitoring, or adaptation? | Vulnerability-weighted priorities and public accountability metrics. |
Infrastructure models should never hide public values behind technical scoring. The choice to prioritize traffic volume, economic value, vulnerable populations, climate exposure, redundancy, or lifecycle cost is not merely technical. It is a public decision. Systems thinking helps make those choices visible.
Python Workflow: Intelligent Infrastructure Risk, Maintenance, and Resilience Scenarios
The Python workflow for this article models intelligent infrastructure through synthetic assets, sensor reliability, failure probability, maintenance capacity, cyber-physical dependency, climate stress, equity priority, and resilience scoring. It uses only the Python standard library so it can run without external dependencies. The workflow compares four scenarios: reactive maintenance, sensor-rich but underfunded, predictive maintenance, and accountable resilient infrastructure.
# intelligent_infrastructure_system_model.py
# Dependency-light professional workflow for intelligent infrastructure systems analysis.
# Purpose: model asset risk, sensor reliability, maintenance capacity, cyber-physical dependency, equity, and resilience.
# Uses only Python standard library.

from dataclasses import dataclass
import csv
import os
from statistics import mean

OUTPUT_TABLES = "outputs/tables"

@dataclass
class InfrastructureScenario:
    name: str
    years: int
    sensor_coverage: float
    sensor_reliability: float
    maintenance_funding: float
    workforce_capacity: float
    predictive_model_quality: float
    cyber_security_readiness: float
    vendor_dependency: float
    climate_stress: float
    equity_weight: float
    public_accountability: float

@dataclass
class Asset:
    asset_id: str
    category: str
    condition: float
    age: float
    service_criticality: float
    redundancy: float
    equity_priority: float
    climate_exposure: float
    cyber_dependency: float

def ensure_outputs() -> None:
    os.makedirs(OUTPUT_TABLES, exist_ok=True)

def clamp(value: float, low: float = 0.0, high: float = 100.0) -> float:
    return max(low, min(high, value))

def build_assets() -> list[Asset]:
    return [
        Asset("bridge_north", "transport", 64.0, 42.0, 78.0, 35.0, 62.0, 44.0, 28.0),
        Asset("water_main_east", "water", 58.0, 55.0, 86.0, 25.0, 82.0, 52.0, 34.0),
        Asset("substation_7", "power", 70.0, 38.0, 92.0, 42.0, 70.0, 48.0, 66.0),
        Asset("transit_signal_core", "transport", 72.0, 24.0, 74.0, 48.0, 58.0, 36.0, 72.0),
        Asset("stormwater_pump_south", "stormwater", 54.0, 47.0, 88.0, 30.0, 76.0, 78.0, 44.0),
        Asset("cooling_center_grid_node", "public_facility", 68.0, 31.0, 80.0, 38.0, 88.0, 70.0, 52.0),
        Asset("air_quality_sensor_cluster", "environmental", 82.0, 12.0, 58.0, 55.0, 74.0, 62.0, 40.0),
        Asset("wastewater_lift_station", "wastewater", 60.0, 49.0, 84.0, 32.0, 68.0, 55.0, 46.0),
        Asset("public_broadband_hub", "digital", 76.0, 18.0, 72.0, 40.0, 80.0, 32.0, 84.0),
        Asset("hospital_access_corridor", "transport", 62.0, 36.0, 90.0, 28.0, 86.0, 46.0, 30.0)
    ]

def asset_failure_probability(asset: Asset, scenario: InfrastructureScenario) -> float:
    deterioration_pressure = (
        (100.0 - asset.condition) * 0.38
        + asset.age * 0.22
        + asset.climate_exposure * scenario.climate_stress * 0.18
        + asset.cyber_dependency * scenario.vendor_dependency * 0.08
    )

    intelligence_offset = (
        scenario.sensor_coverage * scenario.sensor_reliability * 16.0
        + scenario.predictive_model_quality * 10.0
        + scenario.maintenance_funding * 8.0
    )

    return clamp(deterioration_pressure - intelligence_offset, 0.0, 100.0)

def asset_consequence(asset: Asset, scenario: InfrastructureScenario) -> float:
    return clamp(
        asset.service_criticality * 0.38
        + (100.0 - asset.redundancy) * 0.24
        + asset.equity_priority * scenario.equity_weight * 0.22
        + asset.climate_exposure * scenario.climate_stress * 0.16
    )

def cyber_physical_dependency(asset: Asset, scenario: InfrastructureScenario) -> float:
    return clamp(
        asset.cyber_dependency * 0.50
        + scenario.vendor_dependency * 35.0
        + scenario.sensor_coverage * 12.0
        - scenario.cyber_security_readiness * 28.0
    )

def maintenance_action_score(asset: Asset, scenario: InfrastructureScenario, risk_score: float) -> float:
    capacity = scenario.maintenance_funding * 42.0 + scenario.workforce_capacity * 36.0
    decision_quality = scenario.predictive_model_quality * 18.0 + scenario.public_accountability * 14.0
    priority_signal = risk_score * 0.52 + asset.equity_priority * scenario.equity_weight * 0.18
    return clamp((capacity + decision_quality + priority_signal) / 2.2)

def run_scenario(scenario: InfrastructureScenario) -> list[dict]:
    assets = build_assets()
    rows = []

    for year in range(scenario.years + 1):
        for asset in assets:
            failure_probability = asset_failure_probability(asset, scenario)
            consequence = asset_consequence(asset, scenario)
            cyber_dependency = cyber_physical_dependency(asset, scenario)
            risk_score = clamp(failure_probability * 0.55 + consequence * 0.35 + cyber_dependency * 0.10)
            maintenance_score = maintenance_action_score(asset, scenario, risk_score)

            resilience_score = clamp(
                asset.condition * 0.22
                + asset.redundancy * 0.16
                + scenario.maintenance_funding * 18.0
                + scenario.workforce_capacity * 14.0
                + scenario.cyber_security_readiness * 12.0
                + scenario.public_accountability * 10.0
                - failure_probability * 0.14
                - cyber_dependency * 0.08
            )

            rows.append({
                "year": year,
                "scenario": scenario.name,
                "asset_id": asset.asset_id,
                "category": asset.category,
                "condition": round(asset.condition, 3),
                "failure_probability": round(failure_probability, 3),
                "failure_consequence": round(consequence, 3),
                "cyber_physical_dependency": round(cyber_dependency, 3),
                "risk_score": round(risk_score, 3),
                "maintenance_action_score": round(maintenance_score, 3),
                "resilience_score": round(resilience_score, 3),
                "equity_priority": round(asset.equity_priority, 3),
                "redundancy": round(asset.redundancy, 3)
            })

            # Annual condition update: deterioration minus maintenance improvement.
            deterioration = 2.2 + scenario.climate_stress * asset.climate_exposure * 0.018
            improvement = maintenance_score * 0.045 + scenario.predictive_model_quality * 0.55
            asset.condition = clamp(asset.condition - deterioration + improvement)

    return rows

def write_csv(path: str, rows: list[dict]) -> None:
    if not rows:
        return
    with open(path, "w", newline="", encoding="utf-8") as handle:
        writer = csv.DictWriter(handle, fieldnames=list(rows[0].keys()))
        writer.writeheader()
        writer.writerows(rows)

def summarize(rows: list[dict]) -> list[dict]:
    scenarios = sorted(set(row["scenario"] for row in rows))
    summary = []

    for scenario_name in scenarios:
        subset = [row for row in rows if row["scenario"] == scenario_name]
        final_year = max(row["year"] for row in subset)
        final_rows = [row for row in subset if row["year"] == final_year]

        avg_risk = mean(row["risk_score"] for row in final_rows)
        avg_resilience = mean(row["resilience_score"] for row in final_rows)
        max_cyber_dependency = max(row["cyber_physical_dependency"] for row in final_rows)
        high_risk_assets = sum(1 for row in final_rows if row["risk_score"] >= 55)
        low_resilience_assets = sum(1 for row in final_rows if row["resilience_score"] <= 45)

        summary.append({
            "scenario": scenario_name,
            "final_average_risk_score": round(avg_risk, 3),
            "final_average_resilience_score": round(avg_resilience, 3),
            "maximum_cyber_physical_dependency": round(max_cyber_dependency, 3),
            "high_risk_asset_count": high_risk_assets,
            "low_resilience_asset_count": low_resilience_assets,
            "diagnostic": (
                "high infrastructure fragility" if high_risk_assets >= 4 or avg_resilience < 42 else
                "moderate risk requiring governance and maintenance redesign" if avg_risk >= 42 or max_cyber_dependency >= 60 else
                "comparatively resilient intelligent infrastructure pathway"
            )
        })

    return summary

def validate(rows: list[dict]) -> list[str]:
    errors = []
    bounded_fields = [
        "condition",
        "failure_probability",
        "failure_consequence",
        "cyber_physical_dependency",
        "risk_score",
        "maintenance_action_score",
        "resilience_score",
        "equity_priority",
        "redundancy"
    ]

    for row in rows:
        for field in bounded_fields:
            if row[field] < -0.001 or row[field] > 100.001:
                errors.append(f"{field} outside 0-100 range in {row['scenario']} {row['asset_id']} year {row['year']}.")

    return errors

def main() -> None:
    ensure_outputs()

    scenarios = [
        InfrastructureScenario(
            name="Reactive maintenance baseline",
            years=20,
            sensor_coverage=0.22,
            sensor_reliability=0.58,
            maintenance_funding=0.28,
            workforce_capacity=0.35,
            predictive_model_quality=0.16,
            cyber_security_readiness=0.32,
            vendor_dependency=0.42,
            climate_stress=0.48,
            equity_weight=0.35,
            public_accountability=0.30
        ),
        InfrastructureScenario(
            name="Sensor-rich but underfunded",
            years=20,
            sensor_coverage=0.78,
            sensor_reliability=0.70,
            maintenance_funding=0.26,
            workforce_capacity=0.34,
            predictive_model_quality=0.54,
            cyber_security_readiness=0.36,
            vendor_dependency=0.72,
            climate_stress=0.50,
            equity_weight=0.38,
            public_accountability=0.34
        ),
        InfrastructureScenario(
            name="Predictive maintenance strategy",
            years=20,
            sensor_coverage=0.72,
            sensor_reliability=0.78,
            maintenance_funding=0.64,
            workforce_capacity=0.62,
            predictive_model_quality=0.72,
            cyber_security_readiness=0.60,
            vendor_dependency=0.46,
            climate_stress=0.42,
            equity_weight=0.58,
            public_accountability=0.58
        ),
        InfrastructureScenario(
            name="Accountable resilient infrastructure",
            years=20,
            sensor_coverage=0.70,
            sensor_reliability=0.82,
            maintenance_funding=0.76,
            workforce_capacity=0.74,
            predictive_model_quality=0.76,
            cyber_security_readiness=0.78,
            vendor_dependency=0.26,
            climate_stress=0.36,
            equity_weight=0.78,
            public_accountability=0.82
        )
    ]

    all_rows = []
    for scenario in scenarios:
        all_rows.extend(run_scenario(scenario))

    validation_errors = validate(all_rows)
    if validation_errors:
        raise ValueError("Validation failed:\n" + "\n".join(validation_errors))

    summary_rows = summarize(all_rows)

    write_csv(os.path.join(OUTPUT_TABLES, "intelligent_infrastructure_timeseries.csv"), all_rows)
    write_csv(os.path.join(OUTPUT_TABLES, "intelligent_infrastructure_summary.csv"), summary_rows)

    with open(os.path.join(OUTPUT_TABLES, "validation_report.txt"), "w", encoding="utf-8") as handle:
        handle.write("Validation passed.\n")
        handle.write("Bounded indicators, infrastructure risk scores, cyber-physical dependency, and resilience outputs completed.\n")

    print("\nIntelligent infrastructure scenario summary:")
    for row in summary_rows:
        print(
            f"{row['scenario']}: avg risk={row['final_average_risk_score']}, "
            f"avg resilience={row['final_average_resilience_score']}, "
            f"diagnostic={row['diagnostic']}"
        )

if __name__ == "__main__":
    main()
This workflow shows why intelligent infrastructure is not only a sensing problem. A sensor-rich system can remain fragile if maintenance funding, workforce capacity, cybersecurity, public accountability, and equity are weak. A predictive maintenance system performs better when digital intelligence is connected to institutional capacity. The most resilient pathway combines sensing, maintenance, workforce investment, cybersecurity, reduced vendor dependency, equity weighting, and public accountability.
A fuller repository version can add optional pandas and matplotlib workflows for richer dashboards, Excel workbooks, risk heatmaps, asset-level ranking, climate stress testing, cyber-physical dependency analysis, and resilience scorecards while preserving this standard-library script as the default smoke-tested workflow.
R Workflow: Infrastructure Indicators, Risk Tables, and Resilience Visualization
The R workflow for this article uses base R so it can run without additional package dependencies. It reads the Python-generated intelligent infrastructure outputs, creates scenario summaries, exports diagnostic tables, and produces plots for risk score, resilience score, cyber-physical dependency, asset condition, maintenance action, and high-risk asset counts.
# intelligent_infrastructure_system_diagnostics.R
# Base R workflow for intelligent infrastructure systems.
# Purpose: summarize infrastructure risk, maintenance, cyber-physical dependency, equity, and resilience scenarios.

tables_dir <- "outputs/tables"
figures_dir <- "outputs/figures"

if (!dir.exists(figures_dir)) {
  dir.create(figures_dir, recursive = TRUE)
}

timeseries_path <- file.path(tables_dir, "intelligent_infrastructure_timeseries.csv")
summary_path <- file.path(tables_dir, "intelligent_infrastructure_summary.csv")

if (!file.exists(timeseries_path)) {
  stop("Missing intelligent_infrastructure_timeseries.csv. Run the Python workflow first.")
}

infra <- read.csv(timeseries_path, stringsAsFactors = FALSE)

final_year <- max(infra$year)
final_rows <- infra[infra$year == final_year, ]

avg_risk <- aggregate(risk_score ~ scenario, data = final_rows, FUN = mean)
avg_resilience <- aggregate(resilience_score ~ scenario, data = final_rows, FUN = mean)
max_cyber <- aggregate(cyber_physical_dependency ~ scenario, data = final_rows, FUN = max)
high_risk <- aggregate(risk_score ~ scenario, data = final_rows, FUN = function(x) sum(x >= 55))
low_resilience <- aggregate(resilience_score ~ scenario, data = final_rows, FUN = function(x) sum(x <= 45))

names(avg_risk)[2] <- "final_average_risk_score"
names(avg_resilience)[2] <- "final_average_resilience_score"
names(max_cyber)[2] <- "maximum_cyber_physical_dependency"
names(high_risk)[2] <- "high_risk_asset_count"
names(low_resilience)[2] <- "low_resilience_asset_count"

diagnostics <- Reduce(
  function(x, y) merge(x, y, by = "scenario"),
  list(avg_risk, avg_resilience, max_cyber, high_risk, low_resilience)
)

diagnostics$diagnostic <- ifelse(
  diagnostics$high_risk_asset_count >= 4 |
    diagnostics$final_average_resilience_score < 42,
  "high infrastructure fragility",
  ifelse(
    diagnostics$final_average_risk_score >= 42 |
      diagnostics$maximum_cyber_physical_dependency >= 60,
    "moderate risk requiring governance and maintenance redesign",
    "comparatively resilient intelligent infrastructure pathway"
  )
)

write.csv(diagnostics, summary_path, row.names = FALSE)
print(diagnostics)

plot_metric <- function(metric, y_label, title, output_name) {
  yearly <- aggregate(infra[[metric]], by = list(year = infra$year, scenario = infra$scenario), FUN = mean)
  names(yearly)[3] <- metric

  png(file.path(figures_dir, output_name), width = 1200, height = 700)
  scenarios <- unique(yearly$scenario)
  plot(
    NA,
    xlim = range(yearly$year),
    ylim = range(yearly[[metric]], na.rm = TRUE),
    xlab = "Year",
    ylab = y_label,
    main = title
  )
  for (scenario_name in scenarios) {
    subset_data <- yearly[yearly$scenario == scenario_name, ]
    lines(subset_data$year, subset_data[[metric]], lwd = 2)
  }
  legend("topleft", legend = scenarios, lwd = 2, cex = 0.8, bty = "n")
  grid()
  dev.off()
}

plot_metric(
  metric = "risk_score",
  y_label = "Average risk score",
  title = "Infrastructure Risk by Scenario",
  output_name = "infrastructure_risk_trajectories.png"
)

plot_metric(
  metric = "resilience_score",
  y_label = "Average resilience score",
  title = "Infrastructure Resilience by Scenario",
  output_name = "infrastructure_resilience_trajectories.png"
)

plot_metric(
  metric = "cyber_physical_dependency",
  y_label = "Average cyber-physical dependency",
  title = "Cyber-Physical Dependency by Scenario",
  output_name = "cyber_physical_dependency_trajectories.png"
)

plot_metric(
  metric = "condition",
  y_label = "Average asset condition",
  title = "Asset Condition by Scenario",
  output_name = "asset_condition_trajectories.png"
)

plot_metric(
  metric = "maintenance_action_score",
  y_label = "Average maintenance action score",
  title = "Maintenance Action by Scenario",
  output_name = "maintenance_action_trajectories.png"
)

asset_rank <- final_rows[order(-final_rows$risk_score), c(
  "scenario",
  "asset_id",
  "category",
  "condition",
  "risk_score",
  "resilience_score",
  "cyber_physical_dependency",
  "maintenance_action_score",
  "equity_priority"
)]

write.csv(
  asset_rank,
  file.path(tables_dir, "intelligent_infrastructure_asset_risk_rank.csv"),
  row.names = FALSE
)

category_summary <- aggregate(
  cbind(risk_score, resilience_score, cyber_physical_dependency, maintenance_action_score) ~ scenario + category,
  data = final_rows,
  FUN = mean
)

write.csv(
  category_summary,
  file.path(tables_dir, "intelligent_infrastructure_category_summary.csv"),
  row.names = FALSE
)

print(asset_rank)
print(category_summary)
This R workflow helps interpret intelligent infrastructure as an evolving system rather than a one-time dashboard. It shows whether risk declines, whether resilience improves, whether cyber-physical dependency becomes excessive, and whether maintenance action keeps pace with deterioration. The default version remains portable and dependency-light.
A fuller version can add package-based dashboards, scenario charts, asset-risk heatmaps, equity-priority plots, maintenance backlog diagnostics, digital dependency matrices, and climate-stress sensitivity analysis through an optional advanced analysis environment. The base R workflow remains the stable reproducible layer.
GitHub Repository
The companion repository for this article should help readers model intelligent infrastructure through asset risk, sensor reliability, predictive maintenance, cyber-physical dependency, digital fragility, climate exposure, equity priority, maintenance capacity, governance readiness, and resilience scoring using synthetic datasets and reproducible workflows.
Complete Code RepositoryCompanion repository for the article, including intelligent infrastructure simulations, asset-risk models, predictive-maintenance diagnostics, cyber-physical dependency analysis, climate-resilience indicators, Python and R workflow scripts, synthetic datasets, documentation assets, and multi-language scaffolds for systems analysis.
articles/intelligent-infrastructure-as-a-system/
├── python/
│   ├── intelligent_infrastructure_system_model.py
│   ├── asset_risk_priority_diagnostics.py
│   ├── predictive_maintenance_scenarios.py
│   ├── cyber_physical_dependency_model.py
│   ├── climate_resilience_indicators.py
│   ├── equity_maintenance_priority.py
│   └── export_infrastructure_outputs.py
├── r/
│   ├── intelligent_infrastructure_system_diagnostics.R
│   ├── infrastructure_risk_visualization.R
│   ├── maintenance_priority_tables.R
│   ├── cyber_dependency_plots.R
│   ├── resilience_category_summary.R
│   └── export_infrastructure_tables.R
├── julia/
│   ├── nonlinear_asset_deterioration_model.jl
│   ├── predictive_maintenance_sensitivity.jl
│   └── cyber_physical_resilience_thresholds.jl
├── sql/
│   ├── schema_assets.sql
│   ├── schema_sensors.sql
│   ├── schema_condition_observations.sql
│   ├── schema_maintenance_events.sql
│   ├── schema_failure_events.sql
│   ├── schema_climate_exposure.sql
│   ├── schema_cyber_dependencies.sql
│   ├── schema_governance_controls.sql
│   ├── schema_model_runs.sql
│   └── schema_outputs.sql
├── rust/
│   └── infrastructure_scenario_validator.rs
├── go/
│   └── infrastructure_resilience_runner.go
├── cpp/
│   ├── efficient_asset_risk_scan.cpp
│   └── maintenance_priority_solver.cpp
├── fortran/
│   └── recurrence_asset_deterioration_model.f90
├── c/
│   └── low_level_infrastructure_risk_kernel.c
├── docs/
│   ├── modeling_principles.md
│   ├── article_notes.md
│   ├── intelligent_infrastructure_framework.md
│   ├── predictive_maintenance_guide.md
│   ├── cyber_physical_dependency_notes.md
│   ├── python_workflow.md
│   ├── r_workflow.md
│   ├── diagnostic_questions.md
│   ├── ethics_and_public_accountability.md
│   ├── assumptions_and_limitations.md
│   └── responsible_use.md
├── data/
│   ├── synthetic_assets.csv
│   ├── synthetic_sensors.csv
│   ├── synthetic_condition_observations.csv
│   ├── synthetic_maintenance_events.csv
│   ├── synthetic_failure_events.csv
│   ├── synthetic_climate_exposure.csv
│   ├── synthetic_cyber_dependencies.csv
│   ├── synthetic_governance_controls.csv
│   ├── synthetic_model_runs.csv
│   └── synthetic_outputs.csv
├── outputs/
│   ├── README.md
│   ├── figures/
│   └── tables/
└── notebooks/
    ├── python_intelligent_infrastructure_walkthrough.ipynb
    └── r_infrastructure_diagnostics_visualization_placeholder.ipynb
This repository structure supports the article’s central argument: intelligent infrastructure must be analyzed through physical condition, digital sensing, maintenance capacity, cyber-physical dependency, climate exposure, equity, labor, governance, and public accountability. The python/ folder supports dependency-light simulation and diagnostics. The r/ folder supports visualization and interpretive summaries. The julia folder supports nonlinear deterioration and resilience thresholds. The sql folder defines schemas for intelligent infrastructure data. The lower-level language folders provide scaffolds for asset-risk scanning, maintenance-priority solving, recurrence modeling, and low-level infrastructure-risk simulation.
A Practical Method for Intelligent Infrastructure Systems Diagnosis
Intelligent infrastructure systems diagnosis requires moving from technology adoption to public-purpose systems analysis. The method below can support infrastructure planning, asset management, climate adaptation, cybersecurity review, digital twin design, public-sector AI governance, and resilience strategy.
1. Define the infrastructure system boundary
Clarify whether the system includes physical assets, sensors, control systems, data platforms, vendors, workers, public agencies, communities, ecosystems, or emergency services.
2. Identify essential public functions
Ask what the system must protect: safety, water, power, mobility, health, communication, sanitation, shelter, cooling, emergency response, or environmental quality.
3. Map physical and digital dependencies
Identify dependencies on electricity, telecommunications, cloud platforms, software, cybersecurity, labor, vendors, spare parts, roads, water, and public institutions.
4. Assess asset condition and consequence
Measure deterioration, failure probability, service criticality, redundancy, equity priority, climate exposure, and public consequence.
5. Evaluate sensing and data quality
Review sensor coverage, calibration, data gaps, false alarms, missed detections, interoperability, ownership, privacy, and accessibility.
6. Analyze feedback loops
Trace how sensing becomes data, data becomes decisions, decisions become maintenance, and maintenance changes future condition and trust.
7. Test cyber-physical resilience
Examine cybersecurity, vendor lock-in, control-system dependency, manual fallback, offline procedures, incident response, and recovery capacity.
8. Include labor and institutional capacity
Assess whether workers, crews, operators, analysts, procurement staff, and public agencies have the resources and authority to act on intelligence.
9. Evaluate equity and public accountability
Ask who is monitored, who receives repair, who can contest decisions, who carries risk, and whether intelligence corrects or reproduces historical disinvestment.
10. Compare governance and investment scenarios
Model reactive maintenance, sensor-heavy underfunding, predictive maintenance, climate adaptation, cyber resilience, and accountable public infrastructure pathways.
Common Pitfalls
Intelligent infrastructure analysis can fail when digital tools are treated as substitutes for public capacity, maintenance, and accountability. Several patterns are especially common.
- Sensors mistaken for solutions: monitoring can reveal problems, but it does not repair assets, fund maintenance, or protect communities by itself.
- Dashboards mistaken for governance: visibility matters only if institutions have authority, resources, and accountability to act.
- Predictive models detached from maintenance capacity: risk rankings fail when crews, procurement, spare parts, and budgets cannot respond.
- Digital sophistication hiding physical decay: smart systems can make infrastructure look modern while underlying assets continue deteriorating.
- Cybersecurity treated as secondary: connected infrastructure can create physical risk when digital systems are insecure or poorly governed.
- Vendor dependency ignored: proprietary platforms can weaken public control, interoperability, auditability, and long-term institutional capacity.
- Equity left out of optimization: models can reproduce past disinvestment if they prioritize volume, revenue, or asset value over vulnerable communities.
- Surveillance framed as intelligence: public infrastructure monitoring should not become unchecked behavioral surveillance of residents.
The deeper mistake is treating intelligent infrastructure as a technology upgrade rather than a public systems transformation involving maintenance, governance, labor, resilience, equity, privacy, and trust.
Why Intelligent Infrastructure Requires Systems Thinking
Intelligent infrastructure requires systems thinking because infrastructure intelligence is never only technical. It emerges from physical assets, sensors, data systems, models, control systems, maintenance workers, public agencies, vendors, communities, ecosystems, and governance. A smart bridge, grid, water system, transit network, building, or city is only as intelligent as the system that interprets signals, acts on evidence, protects people, learns from failure, and remains publicly accountable.
Digital tools can strengthen infrastructure. They can reveal hidden deterioration, support preventive maintenance, improve climate adaptation, reduce outages, detect leaks, optimize operations, and help institutions plan under uncertainty. But they can also create new fragilities: cybersecurity exposure, vendor lock-in, data gaps, over-automation, surveillance, unequal monitoring, and false confidence. A sensor-rich system can still be underfunded. A predictive model can still be ignored. A digital twin can still omit vulnerable communities. A smart city can still be unjust.
Systems thinking changes the question from “How can infrastructure become smarter?” to “How can infrastructure become safer, more reliable, more maintainable, more equitable, more resilient, more transparent, and more accountable?” It asks what feedback loops are created, what dependencies are introduced, what capacities are strengthened or weakened, who benefits from visibility, who receives repair, who can contest decisions, and what happens when the digital layer fails.
The future of infrastructure should not be defined by sensors alone. It should be defined by public stewardship. Intelligent infrastructure is valuable when it helps societies maintain essential systems, protect vulnerable communities, adapt to climate risk, reduce cascade failure, support workers, and deepen public trust. Infrastructure becomes truly intelligent when it serves life, dignity, ecology, and accountable public purpose over time.
Related Articles
- What Is Systems Thinking?
- Systems Thinking in AI and Technology
- Platforms, Feedback Loops, and Digital Systems
- Networks, Dependencies, and Cascade Risk
- Urban Systems: Congestion, Housing, and Infrastructure
- Climate Systems and Feedback Dynamics
- Resilience, Thresholds, and Regime Shifts
- Complex Adaptive Systems and Social Change
Further Reading
- National Academies of Sciences, Engineering, and Medicine. Making Sense of the Future of Smart Infrastructure Systems.
- National Academies of Sciences, Engineering, and Medicine. Critical Infrastructure Resilience and the Cybersecurity Mission.
- Hollnagel, Erik, Woods, David D. and Leveson, Nancy. Resilience Engineering: Concepts and Precepts. Ashgate.
- Perrow, Charles. Normal Accidents: Living with High-Risk Technologies. Princeton University Press.
- Rinaldi, Steven M., Peerenboom, James P. and Kelly, Terrence K. “Identifying, Understanding, and Analyzing Critical Infrastructure Interdependencies.” IEEE Control Systems Magazine.
- International Energy Agency. Digitalisation and Energy.
- OECD. Infrastructure Governance.
- World Bank. Lifelines: The Resilient Infrastructure Opportunity.
- Meadows, Donella H. Thinking in Systems: A Primer. Chelsea Green Publishing.
- Sterman, John D. Business Dynamics: Systems Thinking and Modeling for a Complex World. Irwin/McGraw-Hill.
References
- Hallegatte, S., Rentschler, J. and Rozenberg, J. (2019) Lifelines: The Resilient Infrastructure Opportunity. Washington, DC: World Bank. Available at: https://openknowledge.worldbank.org/entities/publication/7dff9c13-9fef-5a8a-b3c0-9f03093b6f25
- Hollnagel, E., Woods, D.D. and Leveson, N. (eds.) (2006) Resilience Engineering: Concepts and Precepts. Aldershot: Ashgate.
- International Energy Agency (2017) Digitalisation and Energy. Paris: IEA. Available at: https://www.iea.org/reports/digitalisation-and-energy
- Meadows, D.H. (2008) Thinking in Systems: A Primer. White River Junction, VT: Chelsea Green Publishing. Available at: https://www.chelseagreen.com/product/thinking-in-systems/
- National Academies of Sciences, Engineering, and Medicine (2020) Critical Infrastructure Resilience and the Cybersecurity Mission. Washington, DC: National Academies Press. Available at: https://nap.nationalacademies.org/catalog/25888/critical-infrastructure-resilience-and-the-cybersecurity-mission
- OECD (2017) Getting Infrastructure Right: A Framework for Better Governance. Paris: OECD Publishing. Available at: https://www.oecd.org/gov/budgeting/getting-infrastructure-right.pdf
- Perrow, C. (1999) Normal Accidents: Living with High-Risk Technologies. Princeton, NJ: Princeton University Press.
- Rinaldi, S.M., Peerenboom, J.P. and Kelly, T.K. (2001) “Identifying, Understanding, and Analyzing Critical Infrastructure Interdependencies.” IEEE Control Systems Magazine, 21(6), pp. 11–25. Available at: https://doi.org/10.1109/37.969131
- Sterman, J.D. (2000) Business Dynamics: Systems Thinking and Modeling for a Complex World. Boston: Irwin/McGraw-Hill.
- U.S. Cybersecurity and Infrastructure Security Agency (2024) Critical Infrastructure Sectors. Available at: https://www.cisa.gov/topics/critical-infrastructure-security-and-resilience/critical-infrastructure-sectors