
Last Updated May 28, 2026
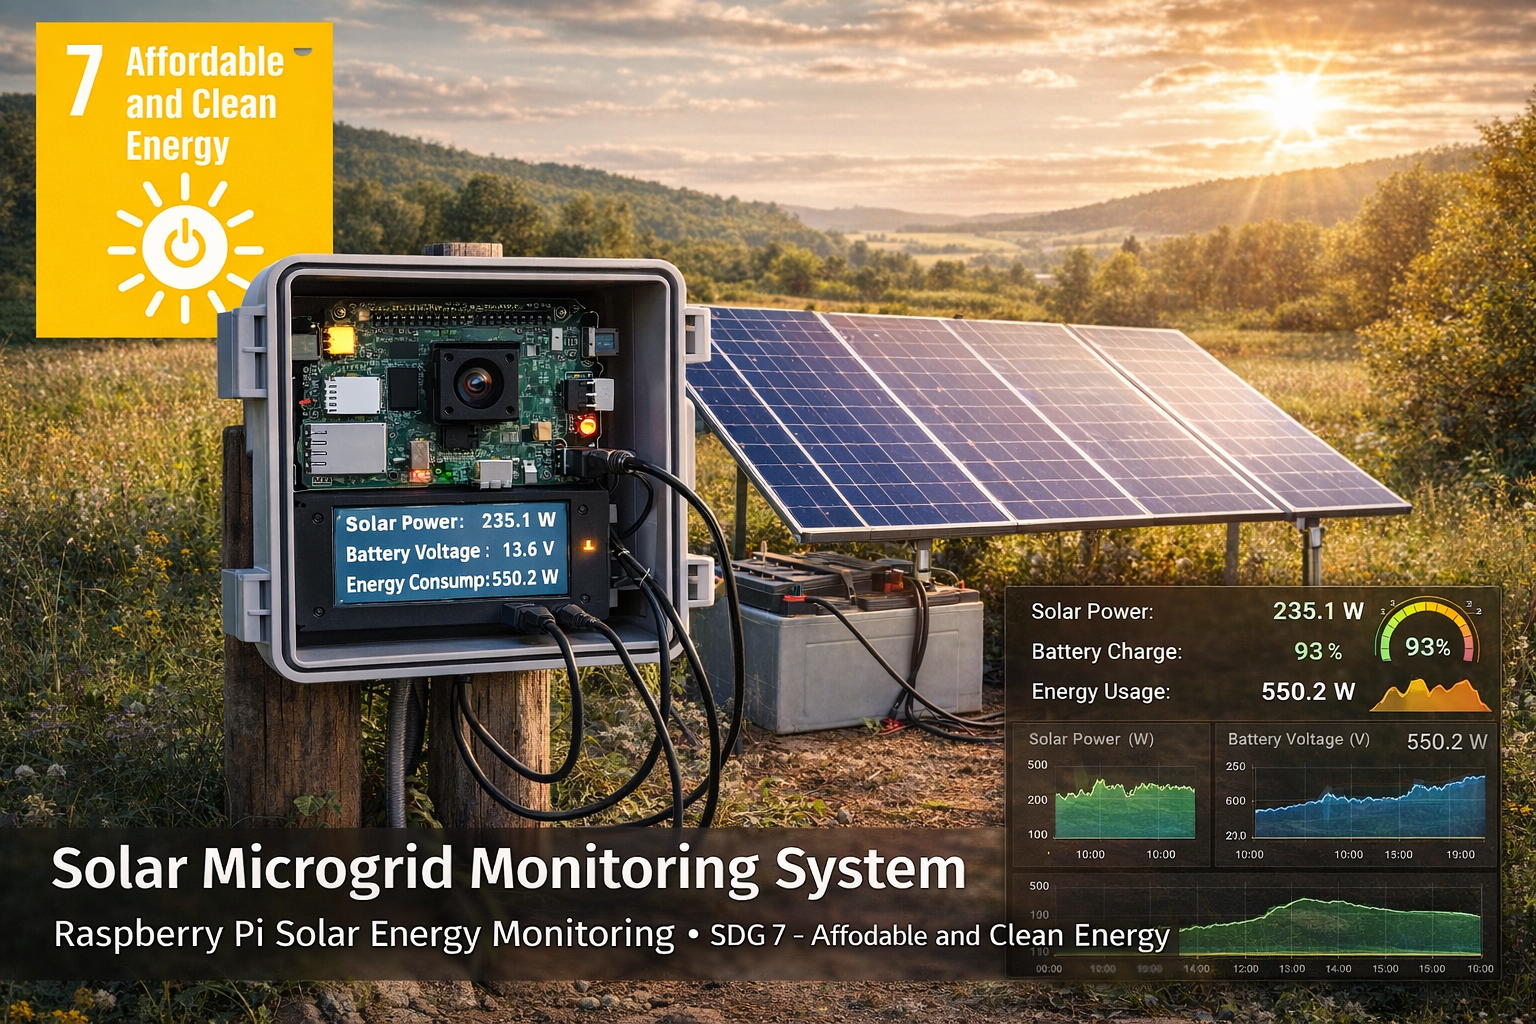
Renewable energy systems increasingly depend on monitoring infrastructure. A Raspberry Pi solar microgrid monitoring system can collect real-time data from solar panels, batteries, charge controllers, and electrical loads, helping communities, researchers, educators, and engineers analyze renewable energy production while supporting SDG 7: Affordable and Clean Energy.
Energy systems are undergoing a structural transition. As solar photovoltaics, distributed storage, local energy management, and resilient microgrids become more common, electricity generation is moving closer to the point of use. Instead of relying only on centralized power plants and long-distance transmission, communities can increasingly generate, store, monitor, and manage energy locally.
This project demonstrates how to build a Raspberry Pi-based solar microgrid monitoring system capable of tracking solar generation, battery-related electrical conditions, and load behavior. While simple, the design reflects a broader sustainability principle: energy systems become more resilient when power flows are measured continuously, transparently, and safely.
The project should not be treated as a certified utility meter, commercial energy-management system, grid-interconnection device, battery-management system, or high-voltage electrical monitoring platform. Its purpose is educational and methodological: to show how low-voltage DC sensing, edge computing, local logging, dashboarding, validation, and responsible electrical-safety practices can work together in a renewable-energy monitoring workflow.
Main Library
Publications
Project Series
Raspberry Pi Projects
Related Topic
Infrastructure Systems
Related Topic
Climate Boundary
Related Topic
SDGs & Boundaries
This project also connects to broader site areas, including Intelligent Infrastructure Systems, Environmental Monitoring Systems, Climate Change as a Planetary Boundary, Sustainable Development Goals Within Planetary Boundaries, and Planetary Boundaries. In that wider context, this Raspberry Pi build is not only a maker project. It is a small prototype of the sensing, logging, and data infrastructure needed for cleaner, more resilient energy systems.
Abstract
This project presents a prototype Raspberry Pi solar microgrid monitoring system built around edge computing, power sensing, local time-series logging, and optional dashboard export. The platform measures solar-panel voltage and current, estimates instantaneous power generation, tracks battery-related electrical conditions, stores observations for later analysis, and supports lightweight anomaly detection.
From an engineering perspective, the system demonstrates a compact renewable-energy monitoring node with sensing, logging, analytics, and visualization layers. From a sustainability perspective, it illustrates how low-cost embedded systems can improve renewable-energy visibility, support energy resilience, and strengthen distributed clean-energy infrastructure.
The system is intentionally limited. It is not a certified energy meter, not a utility interconnection device, not a battery-management system, not a grid-control platform, and not a substitute for qualified electrical design. Its value is educational and methodological: it shows how renewable-energy monitoring systems can translate voltage and current into energy data while requiring validation, safety limits, appropriate sensing hardware, and responsible interpretation.
SDG Alignment: Affordable Clean Energy, Infrastructure, Climate Action, and Resilient Communities
This project aligns most directly with SDG 7: Affordable and Clean Energy, which emphasizes expanding access to reliable, sustainable, affordable, and modern energy systems. Solar microgrid monitoring supports SDG 7 by making clean-energy production, storage behavior, and load demand more visible over time.
The project also connects to SDG 9: Industry, Innovation and Infrastructure, SDG 11: Sustainable Cities and Communities, SDG 12: Responsible Consumption and Production, and SDG 13: Climate Action. Renewable microgrids are increasingly important in regions where traditional electrical infrastructure is unreliable, expensive, unavailable, or vulnerable to climate-related disruption.
| Sustainable Development Goal | How the Project Relates | Project-Level Mechanism |
|---|---|---|
| SDG 7: Affordable and Clean Energy | Supports clean-energy access, renewable generation visibility, local energy management, and microgrid performance awareness. | Voltage, current, power, and estimated energy measurements from solar and battery-linked low-voltage DC systems. |
| SDG 9: Industry, Innovation and Infrastructure | Demonstrates distributed monitoring, renewable-energy telemetry, edge computing, and resilient infrastructure design. | Raspberry Pi node with INA219 sensing, SQLite logging, dashboards, and anomaly detection. |
| SDG 11: Sustainable Cities and Communities | Relates to local resilience for households, public buildings, field stations, emergency systems, and community infrastructure. | Monitoring of solar microgrid behavior that can support backup power planning and maintenance. |
| SDG 12: Responsible Consumption and Production | Supports energy-use visibility, load awareness, and more accountable resource use. | Time-series records of generation, consumption, storage behavior, and operating patterns. |
| SDG 13: Climate Action | Relates to clean-energy transition, emissions reduction, and resilient power under climate stress. | Renewable-energy monitoring infrastructure that helps solar systems remain reliable and maintainable. |
The strongest SDG connection is SDG 7. Renewable energy access requires more than installing solar panels. It requires understanding how much energy is produced, when it is available, how loads behave, whether batteries are being protected, and whether the system is performing as expected.
The connection to SDG 9 comes through infrastructure. A microgrid monitor is not only an electronics project. It is an infrastructure telemetry node that helps reveal system behavior, identify underperformance, and support maintenance.
The connection to SDG 11 matters because energy resilience supports homes, schools, clinics, libraries, emergency centers, field stations, and community infrastructure. Microgrids can provide local power when central systems fail, but their value depends on careful design and monitoring.
The connection to SDG 13 appears because clean electricity, storage, efficiency, and reduced dependence on fossil-fuel generators are central to climate mitigation and adaptation. Monitoring does not replace renewable deployment, but it helps renewable systems operate reliably.
Because the Sustainable Development Goals are broad public frameworks, it is important not to overclaim. This project is not a complete energy-access strategy, not a utility-scale monitoring platform, and not a certified safety system. Its contribution is narrower and still meaningful: it teaches the measurement architecture behind clean-energy visibility and microgrid resilience.
Connections to Other Site Areas
This Raspberry Pi solar microgrid monitor belongs to a wider body of work on sensing, infrastructure, clean energy, and environmental systems. It connects directly to Intelligent Infrastructure Systems because distributed energy systems become more useful when they can sense power flows, detect abnormal behavior, store telemetry, and support decision-making.
It also connects to Environmental Monitoring Systems. Many field stations, air-quality monitors, water-quality systems, biodiversity camera traps, flood sensors, and climate early warning nodes require reliable off-grid or solar-assisted power. Microgrid monitoring helps make that supporting energy layer visible.
At the planetary-boundary level, the project relates most directly to Climate Change as a Planetary Boundary. Clean electricity, storage, energy efficiency, and reduced dependence on fossil-fuel combustion are central to lowering climate risk.
The project also supports the broader development logic explored in Sustainable Development Goals Within Planetary Boundaries. Energy access matters, but energy systems must be designed in ways that improve resilience while reducing pressure on climate and ecological systems.
Energy Access and the Goals of SDG 7
SDG 7 emphasizes the importance of expanding access to reliable, sustainable, affordable, and modern energy systems. This includes electricity access, renewable energy adoption, energy efficiency, and stronger infrastructure for sustainable energy delivery.
Key objectives include:
- expanding access to electricity
- increasing the share of renewable energy
- improving energy efficiency
- strengthening sustainable energy infrastructure
- supporting energy resilience in communities facing unreliable grids or climate-related disruption
Renewable microgrids are increasingly important in achieving these goals, particularly in remote regions, disaster-prone areas, island communities, schools, clinics, research stations, environmental monitoring sites, and field deployments where centralized infrastructure may be limited or fragile.
Monitoring is not a secondary feature of that transition. Energy access that cannot be measured is difficult to maintain. If operators cannot see generation, storage, load, underperformance, and faults, then renewable systems can fail quietly or perform far below expectations.
Why a Raspberry Pi Solar Microgrid Monitoring System Matters
Renewable energy systems do not become reliable simply by generating electricity. They also require visibility into performance. Solar output fluctuates with weather, daylight, shading, dust, panel orientation, panel temperature, wiring losses, battery state, and load behavior. Batteries must be protected from overcharging, deep discharge, and thermal stress. System operators need to understand how energy moves through the microgrid.
A Raspberry Pi-based monitoring node matters because it makes these energy flows observable at low cost. That visibility supports better system maintenance, more informed energy planning, stronger educational experimentation, and improved community resilience.
The platform is not a substitute for industrial-grade energy management infrastructure or certified electrical monitoring equipment. Its value is that it translates the logic of microgrid monitoring into an accessible, reproducible edge-computing system.
The system also teaches a central energy-infrastructure lesson: generation, storage, and demand must be understood together. A solar panel that produces electricity at noon may not meet an evening load. A battery that appears charged may be degrading. A load that seems small may drain the system overnight. Monitoring makes these relationships visible.
What Is a Solar Microgrid?
A solar microgrid is a localized energy system capable of generating, storing, and distributing electricity within a defined area. It may operate independently from the main grid, coordinate with the grid, or provide backup power during outages.
Typical components include:
- solar photovoltaic panels
- charge controllers
- battery storage systems
- DC distribution circuits
- power inverters for AC loads
- electrical loads such as lights, communications equipment, sensors, appliances, pumps, or field systems
Monitoring systems allow operators to observe energy flows and detect potential performance problems before reliability is compromised. In a small prototype, this might mean tracking solar voltage, current, and calculated power. In a larger system, it may include battery state of charge, inverter output, load profiles, weather conditions, fault detection, and control automation.
The term microgrid should not be used loosely for every solar panel and battery. A full microgrid implies coordinated generation, storage, distribution, protection, control, and load management. This project is a small monitoring prototype that teaches part of that architecture: how to observe low-voltage DC power flows safely and usefully.
System Overview
The Raspberry Pi solar microgrid monitor reads voltage and current from a low-voltage DC power path using an INA219 sensor, calculates instantaneous power, stores readings in a local database, and optionally exports observations to dashboards or analytics workflows.
The system can include:
- solar panel voltage monitoring
- solar panel current monitoring
- battery-side voltage observation where appropriate
- load-side current observation where appropriate
- instantaneous power calculation
- estimated energy accumulation over time
- SQLite database logging
- dashboard export
- optional anomaly detection
The key design pattern is energy visibility. The system does not control the microgrid. It observes selected power flows so that system behavior can be understood, analyzed, and improved.
System Requirements
A solar microgrid monitoring system becomes useful only when its requirements are explicit. The system must measure safely, preserve timestamps, store data reliably, remain within sensor limits, and avoid presenting prototype measurements as certified electrical data.
| Requirement | Design Target | Reason |
|---|---|---|
| Low-voltage DC monitoring | Use INA219 or properly rated equivalent only within its voltage and current limits | Prevents unsafe wiring and inaccurate measurement |
| Voltage/current measurement | Record voltage, current, and calculated power | Core signals needed to understand energy production and load behavior |
| Time-series storage | Store readings in SQLite, CSV, InfluxDB, or another consistent data layer | Energy behavior is meaningful over time, not only as single readings |
| Metadata capture | Record sensor ID, location ID, measurement point, units, and quality flags | Clarifies what part of the microgrid is being measured |
| Dashboard readiness | Prepare data for visualization and review | Energy systems are easier to understand through trends and daily profiles |
| Electrical safety | Exclude direct mains, inverter-output, utility, or high-voltage monitoring | Keeps the prototype within educational low-voltage scope |
| Responsible interpretation | Frame outputs as prototype telemetry, not certified metering | Prevents misuse in billing, safety, regulatory, or utility contexts |
These requirements make the project more than a power-sensor demo. They frame it as a small renewable-energy telemetry node with clear operating boundaries.
Solar Microgrid System Architecture
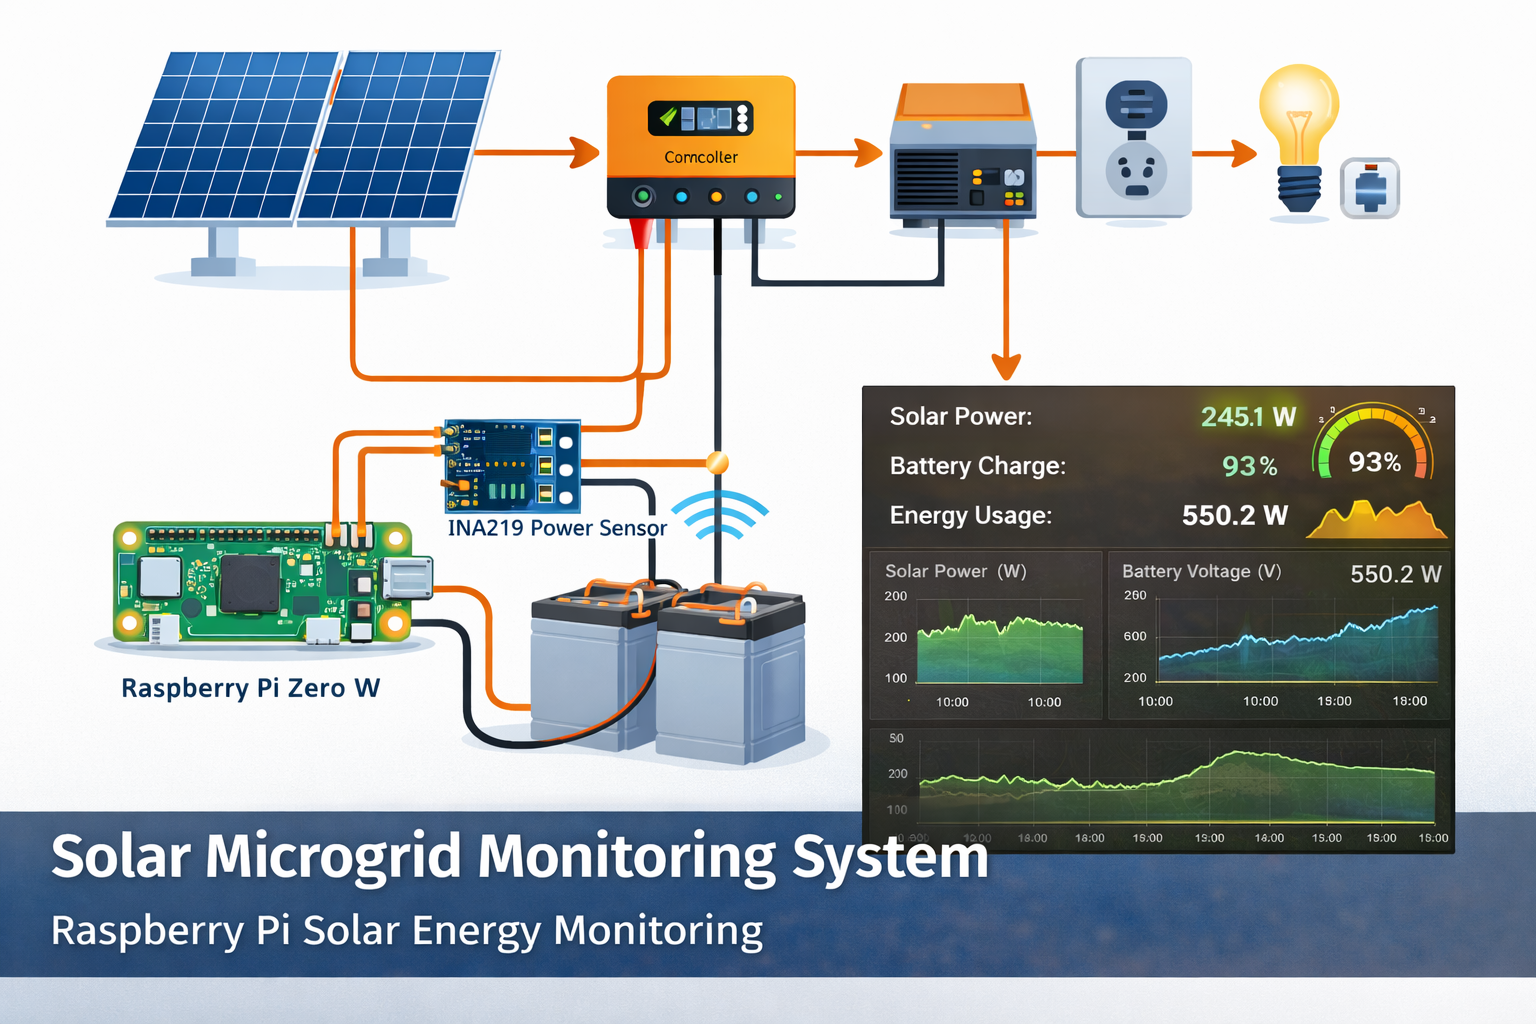
A Raspberry Pi monitoring system can function as the analytical center of a small solar microgrid prototype.
Typical energy architecture:
Solar Panels → Charge Controller → Battery Bank → Inverter / DC Output → Electrical LoadsTypical monitoring architecture:
Power Sensors → Raspberry Pi → Local Database → Dashboard / Analytics → Optional Cloud ExportThe Raspberry Pi connects to sensors that measure:
- solar panel voltage
- solar panel current
- battery voltage
- charge or discharge current
- system power output
- energy consumption over time
Collected data can be stored locally or transmitted to dashboards for visualization. At a systems level, this converts a basic solar setup into an observable energy system.
The architecture also makes clear that monitoring location matters. Measuring panel output, battery charge current, battery discharge current, or load current are different measurement tasks. A single INA219 sensor can observe one selected current path. Multiple measurement points require multiple sensors or more advanced metering hardware.
Bill of Materials
- Raspberry Pi 4, Raspberry Pi 5, or Raspberry Pi Zero 2 W
- INA219 current and voltage sensor for low-voltage DC monitoring
- solar panel or small solar panel array
- solar charge controller
- battery storage system
- DC-AC inverter, if AC loads are included, but not monitored directly by this prototype
- microSD card with adequate endurance for logging
- stable power supply or DC converter for Raspberry Pi
- properly rated wire, connectors, fuses, and disconnects for the low-voltage system
- optional environmental sensor for sunlight, temperature, or enclosure conditions
- weather-resistant enclosure for longer deployments
The INA219 sensor is commonly used for measuring electrical current and voltage in low-voltage DC renewable-energy systems because it provides a compact I2C interface and can support real-time power estimation.
For anything beyond small low-voltage educational systems, sensor rating, fusing, wire gauge, battery chemistry, enclosure design, charge-controller compatibility, and qualified electrical practice become essential.
Engineering Specifications
| Parameter | Reference Design |
|---|---|
| Compute platform | Raspberry Pi 4, Raspberry Pi 5, or Raspberry Pi Zero 2 W |
| Primary sensor | INA219 current and voltage sensor |
| Measured variables | Voltage, current, instantaneous power, estimated energy trends |
| Interface | I2C |
| Storage options | CSV, SQLite, InfluxDB, or dashboard export |
| Output options | Console, local dashboard, optional cloud integration |
| Deployment mode | Microgrid edge-monitoring node |
| Target scope | Educational, prototype, and experimental renewable-energy monitoring |
| Safety scope | Low-voltage DC only; no direct household AC, utility, or high-voltage monitoring |
The reference design is modular. It can begin with one INA219 measurement point, then expand to multiple sensors, dashboarding, battery-side monitoring, load monitoring, environmental context, or more advanced current sensors rated for larger systems.
Measurement Principle: Voltage, Current, Power, Energy, and Battery Context
Solar microgrid monitoring depends on a few basic electrical measurements. Voltage indicates electrical potential. Current indicates the flow of charge. Power indicates the rate at which energy is being produced or consumed. Energy accumulates power over time.
The INA219 measures bus voltage and current through a shunt-based sensing approach. The Raspberry Pi reads the sensor over I2C and calculates or retrieves power estimates. These values can be stored as a time series to show how generation and load behavior change across the day.
Solar output varies strongly with sunlight, shading, cloud cover, panel angle, dust, temperature, charge-controller state, and battery condition. Battery voltage also depends on chemistry, state of charge, load, charging status, temperature, and rest time. Because of that complexity, simple voltage readings should not be overinterpreted as precise state of charge unless a chemistry-appropriate battery model or battery-management system is used.
The measurement principle is therefore: measure selected low-voltage DC power paths, record voltage and current with timestamps, calculate power and estimated energy, preserve metadata about the measurement point, and interpret readings in relation to solar conditions, load demand, and battery context.
Mathematical Lens: From Electrical Readings to Energy Intelligence
The Raspberry Pi solar microgrid monitor can be understood as a time-series energy measurement system. It converts voltage and current readings into power, energy, performance indicators, and review flags.
P = VI
\]
Interpretation: Instantaneous electrical power \(P\) is calculated from voltage \(V\) and current \(I\).
The INA219 may report current in milliamps, so the code converts current to amps before multiplying by voltage.
E \approx \sum_{t=1}^{T} P_t \Delta t
\]
Interpretation: Energy \(E\) can be estimated by accumulating power readings \(P_t\) over time intervals \(\Delta t\).
This provides a basic way to estimate watt-hours produced or consumed over a monitoring period, assuming consistent sampling and appropriate units.
\eta = \frac{E_{\mathrm{useful}}}{E_{\mathrm{available}}}
\]
Interpretation: A simple efficiency ratio compares useful delivered energy with available input energy, though real systems require careful boundary definitions.
Efficiency calculations depend on what is included in the system boundary: panel output, charge-controller output, battery charge/discharge, inverter output, or load-side consumption.
\bar{P}_t=\frac{1}{n}\sum_{i=t-n+1}^{t}P_i
\]
Interpretation: A rolling power average smooths short-term variation and helps reveal generation or load trends.
Rolling averages are useful because solar power fluctuates quickly with passing clouds, shadows, and load changes.
A_t =
\begin{cases}
\text{review}, & P_t < \alpha \bar{P}_t \\
\text{observe}, & P_t \geq \alpha \bar{P}_t
\end{cases}
\]
Interpretation: A simple underperformance flag can mark readings for review when current power falls below a fraction \(\alpha\) of the recent baseline.
The mathematical lens shows why the monitor is more than a sensor display. It creates the basis for energy accounting, underperformance detection, battery/load interpretation, and dashboard-based review.
Connecting the INA219 Power Sensor
The INA219 communicates with the Raspberry Pi through the I2C interface.
Typical Raspberry Pi wiring:
- INA219 VCC → Raspberry Pi 3.3V
- INA219 GND → Raspberry Pi Ground
- INA219 SDA → Raspberry Pi GPIO 2
- INA219 SCL → Raspberry Pi GPIO 3
The INA219 should be placed in the low-voltage DC current path that you intend to monitor. The exact placement depends on whether you want to measure solar-panel output, battery charging current, battery discharge current, or load current.
In practical deployments, wiring quality and current-path design matter significantly for stable readings. Keep leads secure, respect the sensor’s current and voltage limits, verify polarity before energizing the system, and use appropriate fusing and wire gauge for the current involved.
Enable I2C before running the scripts:
sudo raspi-config
# Interface Options → I2C → Enable

sudo apt update
sudo apt install -y i2c-tools
i2cdetect -y 1
The INA219 often appears at address 0x40, though this can vary depending on board configuration.
Electrical Safety and Deployment Scope
This prototype is intended for low-voltage DC monitoring. It should not be connected directly to household AC mains, high-voltage inverter outputs, utility wiring, grid-interconnection equipment, or any circuit outside the rated voltage and current limits of the sensor and associated components.
Solar panels, batteries, charge controllers, and inverters can create real electrical hazards if miswired or overloaded. Battery systems require particular care because short circuits, over-discharge, overcharging, thermal stress, and improper fusing can create fire or equipment-damage risks.
- Do not monitor household AC mains or inverter output with this INA219 prototype.
- Do not exceed the sensor’s voltage or current rating.
- Use properly rated wire, fuses, connectors, and enclosures.
- Verify polarity before energizing the circuit.
- Protect the Raspberry Pi from battery and solar transients through appropriate power regulation.
- Use charge controllers and battery-management systems appropriate to the battery chemistry.
- Use qualified electrical practices for larger systems, unattended installations, or anything connected to buildings.
For larger systems, AC systems, grid-tied systems, or unattended installations, use properly rated equipment, fusing, disconnects, enclosures, wire gauges, charge controllers, battery-management systems, and qualified electrical practices. This project should be treated as an educational and prototype monitoring system, not a certified utility metering device.
Software Environment and Dependencies
The project uses Python because Raspberry Pi systems support I2C sensor libraries, SQLite logging, local dashboards, analytics, and scheduled monitoring workflows in one environment.
sudo apt update
sudo apt install -y python3-pip python3-venv i2c-tools sqlite3

python3 -m venv .venv
source .venv/bin/activate

pip install adafruit-circuitpython-ina219 adafruit-blinka pandas requests
For first testing, read the INA219 on the bench using a small, known low-voltage DC load before integrating with any solar, battery, or microgrid hardware. Once readings are plausible, add logging, dashboard export, and anomaly detection in layers.
For long-running deployments, the monitoring script can later run under systemd, cron, Docker, or another process supervisor. The system should include log rotation, storage monitoring, restart behavior, and safe handling of sensor read errors.
Python Code for Solar Energy Monitoring
The following Python example reads voltage and current from an INA219 sensor and calculates instantaneous power. It uses structured functions and a data class so the same reading can later be logged, exported, analyzed, or displayed in a dashboard.
"""
Raspberry Pi Solar Microgrid Monitor
INA219 Power Sensor Reader

Reads:
- bus voltage in volts
- current in milliamps
- instantaneous power in watts

Notes:
- This code is intended for low-voltage DC prototype monitoring.
- Validate sensor limits, wiring polarity, and current path before use.
- Do not connect this system directly to household AC mains or inverter output.
"""

import time
from dataclasses import dataclass

import board
import busio
from adafruit_ina219 import INA219


@dataclass
class PowerReading:
    """Structured container for one power-system observation."""
    bus_voltage_v: float
    current_ma: float
    power_w: float


def initialize_ina219() -> INA219:
    """Initialize INA219 over the Raspberry Pi I2C bus."""
    i2c_bus = busio.I2C(board.SCL, board.SDA)
    sensor = INA219(i2c_bus)

    return sensor


def read_power(sensor: INA219) -> PowerReading:
    """
    Read voltage and current from the INA219 and calculate power.

    The Adafruit INA219 library reports current in milliamps.
    Convert milliamps to amps before multiplying by voltage.
    """
    bus_voltage_v = sensor.bus_voltage
    current_ma = sensor.current
    current_a = current_ma / 1000.0

    power_w = bus_voltage_v * current_a

    return PowerReading(
        bus_voltage_v=bus_voltage_v,
        current_ma=current_ma,
        power_w=power_w,
    )


def print_power_reading(reading: PowerReading) -> None:
    """Print one formatted power reading."""
    print(
        f"Voltage: {reading.bus_voltage_v:.2f} V | "
        f"Current: {reading.current_ma:.2f} mA | "
        f"Power: {reading.power_w:.3f} W"
    )


def main() -> None:
    """Run the monitoring loop."""
    sensor = initialize_ina219()

    print("Raspberry Pi Solar Microgrid Monitor")
    print("Reading INA219 voltage, current, and power...")
    print("----------------------------------------------")

    while True:
        try:
            reading = read_power(sensor)
            print_power_reading(reading)
        except Exception as exc:
            print(f"INA219 read error: {exc}")

        time.sleep(5)


if __name__ == "__main__":
    main()
This script verifies the sensing layer before adding database logging, energy accumulation, dashboards, or anomaly detection. Use a small known DC load for initial testing.
Logging Energy Production Data
Energy monitoring systems typically store observations for long-term analysis. A lightweight SQLite database is useful because it supports timestamped records, structured queries, metadata, quality flags, and later dashboard integration.
"""
SQLite Logger for Raspberry Pi Solar Microgrid Monitoring

Stores timestamped voltage, current, power, and estimated energy readings.
The resulting time-series dataset can be analyzed with Python, R, SQL,
or dashboard tools.
"""

import sqlite3
from datetime import datetime, timezone
from pathlib import Path


DATABASE_PATH = Path("solar_microgrid.db")


def create_connection(db_path: Path = DATABASE_PATH) -> sqlite3.Connection:
    """Create and return a SQLite database connection."""
    return sqlite3.connect(db_path)


def initialize_database(conn: sqlite3.Connection) -> None:
    """Create the energy_readings table if it does not already exist."""
    cursor = conn.cursor()

    cursor.execute("""
        CREATE TABLE IF NOT EXISTS energy_readings (
            id INTEGER PRIMARY KEY AUTOINCREMENT,
            timestamp_utc TEXT NOT NULL,
            voltage_v REAL NOT NULL,
            current_ma REAL NOT NULL,
            power_w REAL NOT NULL,
            energy_wh REAL,
            measurement_point TEXT DEFAULT 'solar_output',
            sensor_id TEXT DEFAULT 'ina219_01',
            location_id TEXT DEFAULT 'prototype_microgrid',
            quality_flag TEXT DEFAULT 'unchecked',
            notes TEXT DEFAULT ''
        )
    """)

    conn.commit()


def log_energy_reading(
    conn: sqlite3.Connection,
    voltage_v: float,
    current_ma: float,
    power_w: float,
    energy_wh: float | None = None,
    measurement_point: str = "solar_output",
    sensor_id: str = "ina219_01",
    location_id: str = "prototype_microgrid",
    quality_flag: str = "unchecked",
    notes: str = "",
) -> None:
    """Insert one energy observation into SQLite."""
    cursor = conn.cursor()

    timestamp_utc = datetime.now(timezone.utc).isoformat()

    cursor.execute("""
        INSERT INTO energy_readings (
            timestamp_utc,
            voltage_v,
            current_ma,
            power_w,
            energy_wh,
            measurement_point,
            sensor_id,
            location_id,
            quality_flag,
            notes
        )
        VALUES (?, ?, ?, ?, ?, ?, ?, ?, ?, ?)
    """, (
        timestamp_utc,
        voltage_v,
        current_ma,
        power_w,
        energy_wh,
        measurement_point,
        sensor_id,
        location_id,
        quality_flag,
        notes,
    ))

    conn.commit()


def read_recent_observations(conn: sqlite3.Connection, limit: int = 10) -> list[tuple]:
    """Return recent observations for quick inspection."""
    cursor = conn.cursor()

    cursor.execute("""
        SELECT timestamp_utc, voltage_v, current_ma, power_w, energy_wh, measurement_point
        FROM energy_readings
        ORDER BY timestamp_utc DESC
        LIMIT ?
    """, (limit,))

    return cursor.fetchall()


if __name__ == "__main__":
    conn = create_connection()
    initialize_database(conn)

    # Example row. Replace with live INA219 readings.
    log_energy_reading(
        conn=conn,
        voltage_v=18.2,
        current_ma=420.0,
        power_w=7.64,
        energy_wh=0.0,
        measurement_point="solar_output",
        quality_flag="demo",
        notes="example low-voltage reading",
    )

    for row in read_recent_observations(conn):
        print(row)

    conn.close()
Over time, this dataset can reveal patterns in solar energy production, load variability, battery behavior, and system efficiency.
Energy accumulation should be implemented carefully. If readings are taken every five seconds, power in watts can be converted into watt-hours by multiplying by the time interval in hours and adding to a cumulative total.
Solar Microgrid Data Model
Solar microgrid telemetry should preserve not only the measured numbers, but also the measurement point and electrical context. A voltage reading from a panel, battery, load, or charge-controller output may have very different meaning.
| Field | Example | Purpose |
|---|---|---|
| timestamp_utc | 2026-05-28T09:15:00Z | Provides a consistent time reference for energy analysis |
| location_id | field_station_solar_01 | Identifies the system or site |
| sensor_id | ina219_01 | Links readings to specific hardware |
| measurement_point | solar_output | Clarifies whether the reading describes panel, battery, or load behavior |
| voltage_v | 18.2 | Measured voltage |
| current_ma | 420.0 | Measured current |
| power_w | 7.64 | Calculated instantaneous power |
| energy_wh | 42.5 | Estimated accumulated energy |
| quality_flag | valid | Marks readings as valid, suspect, demo, missing, or out-of-range |
| notes | cloud cover increased | Preserves environmental or operating context |
A clear data model prevents confusion. Without a measurement-point field, a dashboard can easily mix panel output, battery charge current, discharge current, and load current as if they were the same signal.
Energy Monitoring Dashboards
Visualization platforms help translate energy measurements into actionable insights. Dashboards can show solar generation, battery-related voltage trends, load behavior, daily production, and warning indicators.
Popular tools include:
- Grafana dashboards
- InfluxDB time-series databases
- SQLite-backed local dashboards
- custom Flask or FastAPI web dashboards
- CSV export for analysis in Python, R, or spreadsheet tools
The following example exports recent SQLite records into JSON-ready dictionaries for use in a dashboard or local web application.
"""
Dashboard Export Example for Solar Microgrid Data

Reads recent SQLite observations and returns JSON-ready dictionaries.
A Flask, FastAPI, or dashboard application could use this as a data source.
"""

import sqlite3
from pathlib import Path


DATABASE_PATH = Path("solar_microgrid.db")


def get_recent_energy_records(limit: int = 100) -> list[dict]:
    """Return recent energy records as dictionaries."""
    conn = sqlite3.connect(DATABASE_PATH)
    conn.row_factory = sqlite3.Row

    cursor = conn.cursor()

    cursor.execute("""
        SELECT
            timestamp_utc,
            voltage_v,
            current_ma,
            power_w,
            energy_wh,
            measurement_point,
            sensor_id,
            location_id,
            quality_flag
        FROM energy_readings
        ORDER BY timestamp_utc DESC
        LIMIT ?
    """, (limit,))

    records = [dict(row) for row in cursor.fetchall()]
    conn.close()

    return records


if __name__ == "__main__":
    for record in get_recent_energy_records(limit=5):
        print(record)
These tools allow operators to track renewable energy production, battery behavior, and electrical load behavior in real time. Dashboards should also show data gaps, sensor status, measurement point, and prototype limitations so the interface does not imply more certainty than the system can support.
AI Applications in Renewable Energy Systems
Machine learning techniques can improve microgrid performance by forecasting generation, detecting abnormal behavior, and helping operators understand changing load patterns.
Possible applications include:
- solar generation forecasting
- battery life optimization
- load demand prediction
- anomaly detection in electrical systems
- fault detection for panels, wiring, or battery behavior
- optimization of charge and discharge schedules
The following lightweight example flags unusually low solar output relative to a rolling local baseline. It is a simple monitoring heuristic rather than a complete diagnostic system.
"""
Simple Solar Output Anomaly Detector

Flags unusually low power output relative to a rolling local baseline.
This can help identify shading, wiring issues, weather changes, or sensor
problems that deserve further inspection.
"""

from collections import deque
from statistics import mean


class SolarPowerAnomalyDetector:
    """Tracks recent power output and flags possible underperformance."""

    def __init__(self, window_size: int = 24, drop_fraction: float = 0.50):
        self.window_size = window_size
        self.drop_fraction = drop_fraction
        self.recent_power_values = deque(maxlen=window_size)

    def add_reading(self, power_w: float) -> dict:
        """
        Add a power reading and return simple anomaly diagnostics.

        If current power is less than a selected fraction of the recent baseline,
        the reading is flagged as possible underperformance.
        """
        if len(self.recent_power_values) == 0:
            baseline_w = power_w
        else:
            baseline_w = mean(self.recent_power_values)

        threshold_w = baseline_w * self.drop_fraction
        possible_underperformance = power_w < threshold_w if baseline_w > 0 else False

        self.recent_power_values.append(power_w)

        return {
            "power_w": power_w,
            "baseline_w": baseline_w,
            "threshold_w": threshold_w,
            "possible_underperformance": possible_underperformance,
        }


if __name__ == "__main__":
    detector = SolarPowerAnomalyDetector(window_size=6, drop_fraction=0.50)

    sample_power_values = [18.1, 18.5, 17.9, 19.0, 18.6, 18.2, 4.5]

    for value in sample_power_values:
        result = detector.add_reading(value)
        print(result)
Edge-based analytics running on Raspberry Pi hardware can analyze energy data locally and provide predictive insights without requiring continuous cloud processing. The key is careful interpretation: anomaly detection can identify unusual behavior, but it does not automatically explain whether the cause is weather, shading, wiring, sensor drift, load change, or equipment failure.
For dashboards, a label such as “review recommended” is safer than “solar fault detected” unless the system has been validated against known operating conditions and reference measurements.
GitHub Repository
The article body includes the core power-sensing, logging, dashboard, and anomaly-detection examples so the build remains readable. The full repository expands the project into a reproducible prototype package, including Python power-monitoring scripts, INA219 sensor examples, SQLite energy logging utilities, dashboard export scaffolding, anomaly detection examples, deployment notes, and sample solar-energy datasets.
Complete Code Repository
The full code distribution for this project, including Python power-monitoring scripts, INA219 sensor examples, SQLite energy logging utilities, dashboard export scaffolding, anomaly detection examples, deployment notes, and sample solar-energy datasets, is available on GitHub.
The repository contains the complete prototype build materials:
- Python monitoring scripts
- sensor integration examples
- energy logging utilities
- dashboard integration notes
- deployment documentation
- sample energy datasets
Repository Structure
raspberry-pi-solar-microgrid-monitoring/

README.md
LICENSE
requirements.txt

src/
  read_power_data.py
  log_energy_data.py
  dashboard_export.py
  anomaly_check.py
  battery_status.py

docs/
  setup_guide.md
  deployment_notes.md
  sensor_notes.md
  data_model.md
  safety_notes.md
  responsible_use.md

data/
  example_solar_energy_readings.csv

hardware/
Engineers can clone the repository, fork the design, or download the complete project using GitHub’s Download ZIP feature. All materials are released under the MIT License to support reuse in research, education, renewable-energy prototyping, and engineering work.
Microgrids and Energy Resilience
Solar microgrids provide important resilience benefits.
Distributed renewable-energy systems can:
- maintain electricity during grid outages
- reduce reliance on fossil-fuel generators
- expand energy access in remote areas
- support disaster-recovery infrastructure
- power environmental monitoring stations and field equipment
- increase community control over energy resources
Monitoring systems help these microgrids operate safely and efficiently. Without monitoring, operators may not detect declining battery health, unstable generation patterns, excessive load, degraded panel performance, or changing system behavior until reliability is already compromised.
Energy resilience is therefore a data problem as well as a hardware problem. A solar panel, battery, and inverter may provide power, but monitoring helps reveal whether the system can keep providing power under real conditions of weather, load variability, maintenance limits, and climate stress.
Engineering Notes
A few technical considerations are especially important in this build:
- Sensor placement: the quality of energy observations depends on where and how current paths are measured.
- Current limits: sensors such as the INA219 are useful for low-voltage DC prototypes, but larger systems require properly rated current sensors or meters.
- Storage realism: long-term energy analysis requires reliable local persistence, timestamps, and consistent units.
- Battery context: generation data is only part of the story; storage behavior matters equally in microgrids.
- Dashboard value: visualization improves operational usefulness significantly.
- Edge resilience: local logging and local analytics reduce dependence on permanent connectivity.
- Thermal and enclosure design: outdoor solar systems require protection from heat, moisture, dust, and mechanical stress.
- Electrical safety: monitoring hardware should remain within low-voltage and current-rated limits.
These considerations make the project more than a simple sensor demonstration. It becomes a prototype renewable-energy data infrastructure node.
Deployment Scope and Data-Quality Considerations
This prototype is designed for educational, experimental, and early-stage renewable-energy monitoring. It should not be treated as a certified utility meter, building electrical monitor, grid-interconnection device, commercial energy-management system, or battery-management system.
Data quality depends on sensor placement, wiring, current-path design, grounding, voltage range, current range, sampling interval, thermal conditions, battery state, charge-controller behavior, and load variability. A measurement taken at the panel side, battery side, or load side may represent different energy flows.
These limitations do not make the system unhelpful. They define the appropriate scope of use: local observation, energy education, prototype analytics, renewable-energy experimentation, and microgrid visibility.
Responsible data use also requires uncertainty. Dashboards should identify measurement point, sensor limits, missing data, quality flags, prototype scope, and whether readings have been compared with a reference meter.
Failure Modes and Practical Risks
A useful solar microgrid monitoring article should explain not only how the system works, but how it can fail. Energy systems involve real electrical hazards and can produce misleading data if the measurement point or sensor limit is misunderstood.
- Sensor overcurrent: current above the sensor rating can damage the sensor or create unsafe conditions.
- Voltage overrange: monitoring circuits outside the sensor’s voltage rating can damage hardware.
- Reversed polarity: incorrect wiring can produce invalid readings or damage components.
- Wrong measurement point: panel, battery, and load measurements describe different parts of the system.
- Loose connections: unstable wiring can cause intermittent readings, heat, voltage drop, or failure.
- Battery misinterpretation: voltage alone may not accurately indicate state of charge under load or charge conditions.
- Thermal stress: outdoor enclosures may overheat Raspberry Pi hardware or power electronics.
- Storage failure: long-term logging can fill storage or corrupt data if unmanaged.
- False diagnostic confidence: anomaly detection may flag weather or shading as a fault.
- Unsafe scaling: small-sensor prototypes should not be scaled to higher power systems without rated equipment.
These risks do not make the project unusable. They make measurement boundaries, safe wiring, validation, and cautious interpretation essential. A monitoring system should make energy behavior clearer without creating electrical hazards or false authority.
Validation and Testing
To bring this project closer to engineering-grade documentation, validation should include:
- verify I2C communication with the INA219
- compare voltage and current readings against a known reference meter where possible
- confirm that calculated power values remain plausible under known load conditions
- test CSV or SQLite logging over repeated intervals
- evaluate dashboard export or local visualization if used
- run extended trials to assess uptime and data retention
- test readings under bright sun, shade, cloud cover, and different load conditions
- verify that timestamps, units, sensor IDs, measurement points, and location metadata remain consistent
- check sensor and wire temperature under expected current levels
- confirm that the sensor is installed only in circuits within its rated limits
If the system behaves inconsistently, the issue may be related to wiring, sensor limits, current-path design, power stability, thermal conditions, charge-controller behavior, battery state, or storage configuration rather than to the monitoring concept itself.
Example Validation Record
| Test | Expected Result | Observed Result | Likely Issue | Action |
|---|---|---|---|---|
| I2C scan | INA219 appears at expected address | Device visible at 0x40 | None | Proceed to low-load test |
| Known DC load | Voltage/current close to reference meter | Current 8% low | Calibration, wiring, or sensor tolerance | Compare with reference and document offset |
| Cloud/shade test | Power drops when panel is shaded | Power drop observed | Expected behavior | Record as functional test |
| Extended logging | No missing records over 24 hours | Database gaps after reboot | Power or service restart issue | Add service restart and improve power stability |
| Thermal inspection | No excessive heat at wiring or sensor | Connector warm under load | Underrated connector or loose connection | Stop test and correct hardware |
A validation record like this helps separate electrical behavior from measurement artifact. That distinction is essential in energy monitoring.
Suggested Performance Metrics
For a more rigorous evaluation, the monitoring system can be assessed using several simple metrics:
- sensor stability: consistency of repeated voltage and current readings under unchanged conditions
- measurement accuracy: agreement between sensor readings and a reference meter
- logging reliability: whether energy observations are stored without loss over long runs
- uptime: how consistently the node continues operating without intervention
- data completeness: whether the expected number of records is captured over time
- operational usefulness: whether monitored data helps explain system behavior under varying sunlight and load
- dashboard usability: whether visualization makes generation, storage, and load behavior easier to understand
- maintenance burden: how often the system requires inspection, rebooting, recalibration, or enclosure adjustment
- safety performance: whether wiring, current paths, and enclosures remain within safe operating limits
Even simple tracking of these metrics improves the project’s value as an experimental microgrid monitoring platform. The goal is not only to produce readings, but to produce readings that are safe, interpretable, and useful for understanding system performance.
Field Deployment, Enclosure, Power, and Maintenance
Field deployment introduces conditions that do not appear on a bench. Solar systems face heat, moisture, dust, wind, vibration, cable movement, shading, insects, corrosion, battery aging, and changing load conditions.
Responsible deployment should address:
- weather-resistant enclosure design
- ventilation and thermal management for Raspberry Pi hardware
- secure strain-relieved wiring
- properly rated fuses, connectors, and disconnects
- safe separation between monitoring electronics and higher-power circuits
- sensor placement documentation
- storage backup and log rotation
- watchdog or service restart behavior
- periodic inspection of wiring and sensor hardware
- cleaning of panels or inspection for shading if energy output changes unexpectedly
Maintenance is part of the measurement system. A loose connector, shaded panel, failing battery, overheated enclosure, or filled storage card can make the data misleading. Monitoring systems should therefore include maintenance logs alongside energy logs.
Renewable Energy Data and the Future of SDG 7
As renewable energy adoption accelerates worldwide, monitoring technologies will become increasingly important.
Energy monitoring networks allow governments, researchers, educators, utilities, cooperatives, field stations, and communities to:
- evaluate renewable energy performance
- optimize microgrid operation
- improve energy planning
- support resilient infrastructure
- identify underperforming systems
- understand battery and load behavior
- support sustainable development policies
Low-cost computing platforms such as Raspberry Pi make it possible for educational institutions, community science initiatives, field stations, and small communities to experiment with renewable-energy monitoring systems. These projects demonstrate how open hardware and open-source software can strengthen energy governance while advancing SDG 7.
The long-term challenge is not merely generating more electricity. It is building clean-energy systems that are observable, reliable, maintainable, affordable, and resilient under real operating conditions.
That future should also be equitable. Clean-energy monitoring should help communities understand and maintain their systems, not create opaque technical dependencies. Energy visibility should support local capacity, responsible maintenance, and accountable infrastructure.
Responsible Deployment
This prototype is appropriate for classrooms, makerspaces, renewable-energy education, field stations, low-voltage solar experiments, and early-stage microgrid monitoring. It should not be used for utility billing, grid interconnection, building electrical systems, high-voltage inverter output, battery protection, or commercial energy management without certified equipment and qualified electrical design.
Responsible deployment means matching the system to the consequence of error. A classroom demonstration can use a small solar panel and low-voltage load. A field station requires weatherproofing, fusing, enclosure management, and power-stability testing. A building-scale or community-scale system requires rated equipment, professional design, and electrical code compliance.
A responsible version should include sensor-limit documentation, measurement-point notes, reference-meter checks, quality flags, maintenance logs, wiring diagrams, clear prototype labeling, and conservative safety boundaries.
The central rule is simple: renewable-energy monitoring should make systems more understandable and maintainable without encouraging unsafe electrical work.
Reproducibility
All code, documentation, and supporting build materials necessary to reproduce the prototype are included in the project repository. The design intentionally relies on widely available Raspberry Pi hardware, open-source Python libraries, and common power-monitoring components so that it can be rebuilt in classrooms, labs, makerspaces, field stations, and independent renewable-energy projects.
The system is intended as a reference implementation rather than a certified utility monitoring node. Engineers adapting it for longer-term deployment should validate power stability, sensor placement, battery integration assumptions, data retention, enclosure resilience, grounding, current-path design, electrical safety, and local operating conditions.
For the rest of this project series, reproducibility should mean more than making code available. Each article should include a clear bill of materials, setup instructions, validation notes, data model, known failure modes, test procedure, responsible-use framing, and realistic statement of appropriate scope.
Conclusion
Building a Raspberry Pi solar microgrid monitoring system demonstrates how embedded sensing and local computation can support stronger renewable-energy infrastructure. By combining power sensors, local logging, dashboard integration, and lightweight analytics, the platform creates a flexible foundation for distributed clean-energy observation.
Although compact, the design reflects a broader sustainability principle: energy resilience depends on energy visibility. When renewable systems can be measured continuously and interpreted effectively, communities are better positioned to optimize performance, expand access, and strengthen clean-energy transitions.
For classrooms, makerspaces, field stations, community energy projects, and early-stage renewable infrastructure experiments, this Raspberry Pi solar microgrid monitor provides a practical foundation for understanding how clean-energy systems can become more observable, reliable, and resilient.
The deeper lesson is not simply that a Raspberry Pi can read voltage and current. The deeper lesson is that clean-energy infrastructure requires feedback: safe electrical design, measurement boundaries, calibrated sensing, power-flow context, time-series logging, dashboard interpretation, maintenance records, and responsible deployment. When those layers are treated seriously, even a small prototype can demonstrate the logic of more resilient renewable-energy systems.
Related Articles and Site Areas
- Raspberry Pi Sustainability Engineering Series
- Raspberry Pi Water Quality Monitoring System
- Raspberry Pi Climate Early Warning System
- Intelligent Infrastructure Systems
- Environmental Monitoring Systems
- Climate Change as a Planetary Boundary
- Sustainable Development Goals Within Planetary Boundaries
- Planetary Boundaries
Further Reading
- Adafruit (n.d.) Adafruit INA219 Current Sensor Breakout. Available at: https://learn.adafruit.com/adafruit-ina219-current-sensor-breakout
- International Energy Agency (n.d.) Renewables. Available at: https://www.iea.org/energy-system/renewables
- International Renewable Energy Agency (n.d.) Solar Energy. Available at: https://www.irena.org/Energy-Transition/Technology/Solar-energy
- National Renewable Energy Laboratory (n.d.) Microgrids. Available at: https://www.nrel.gov/grid/microgrids.html
- Raspberry Pi Foundation (n.d.) Raspberry Pi Documentation. Available at: https://www.raspberrypi.com/documentation/
- United Nations (n.d.) Sustainable Development Goal 7: Affordable and Clean Energy. Available at: https://sdgs.un.org/goals/goal7
- U.S. Department of Energy (n.d.) Solar Energy Technologies Office. Available at: https://www.energy.gov/eere/solar/solar-energy-technologies-office
- U.S. Department of Energy (n.d.) Microgrid Program Strategy. Available at: https://www.energy.gov/oe/microgrid-program-strategy
References
- Adafruit (n.d.) Adafruit INA219 Current Sensor Breakout. Available at: https://learn.adafruit.com/adafruit-ina219-current-sensor-breakout
- International Energy Agency (n.d.) Renewables. Available at: https://www.iea.org/energy-system/renewables
- International Renewable Energy Agency (n.d.) Solar Energy. Available at: https://www.irena.org/Energy-Transition/Technology/Solar-energy
- National Renewable Energy Laboratory (n.d.) Microgrids. Available at: https://www.nrel.gov/grid/microgrids.html
- Raspberry Pi Foundation (n.d.) Raspberry Pi Documentation. Available at: https://www.raspberrypi.com/documentation/
- United Nations (n.d.) The 17 Sustainable Development Goals. Available at: https://sdgs.un.org/goals
- United Nations (n.d.) Sustainable Development Goal 7: Affordable and Clean Energy. Available at: https://sdgs.un.org/goals/goal7
- United Nations (n.d.) Sustainable Development Goal 9: Industry, Innovation and Infrastructure. Available at: https://sdgs.un.org/goals/goal9
- United Nations (n.d.) Sustainable Development Goal 11: Sustainable Cities and Communities. Available at: https://sdgs.un.org/goals/goal11
- United Nations (n.d.) Sustainable Development Goal 12: Responsible Consumption and Production. Available at: https://sdgs.un.org/goals/goal12
- United Nations (n.d.) Sustainable Development Goal 13: Climate Action. Available at: https://sdgs.un.org/goals/goal13
- U.S. Department of Energy (n.d.) Solar Energy Technologies Office. Available at: https://www.energy.gov/eere/solar/solar-energy-technologies-office
- U.S. Department of Energy (n.d.) Microgrid Program Strategy. Available at: https://www.energy.gov/oe/microgrid-program-strategy