
Last Updated August 6, 2026
Energy systems are the linked arrangements through which societies obtain useful energy. They include resources, conversion technologies, fuels, electricity networks, storage assets, end-use devices, markets, public institutions, labor, finance, information systems, environmental consequences, and patterns of demand. Their purpose is not simply to produce energy in the abstract. It is to deliver services: heat, light, motion, cooling, communication, industrial production, water treatment, transportation, food preservation, computation, health care, and the many other capabilities on which modern life depends.
A power plant is therefore not an energy system by itself. Neither is a solar array, battery, pipeline, refinery, transmission line, heat pump, electric vehicle, or market platform. Each becomes meaningful through relationships with resources, infrastructures, operators, users, rules, prices, environments, and other technologies. A generator depends on fuel or renewable flows, maintenance, transmission access, operational coordination, financing, regulation, and demand. A battery depends on charging energy, power electronics, control systems, material supply chains, operating rules, and a service it is expected to provide. Energy systems emerge from these connections.
This systems perspective changes the questions energy analysis asks. Instead of asking only which technology produces electricity most cheaply, it asks when that electricity is available, where it can move, what infrastructure connects it, what materials it requires, which institutions govern it, who pays, who benefits, what risks it introduces, and how it performs under disturbance. Instead of treating pollution, household burden, land conflict, or supply-chain harm as external issues, it places them inside the system boundary.
The result is a broader but more disciplined understanding of energy. Energy systems are physical systems constrained by thermodynamics, engineering, geography, and material limits. They are also institutional systems shaped by law, ownership, planning, markets, political power, public investment, and social legitimacy. Any serious account must hold these dimensions together.
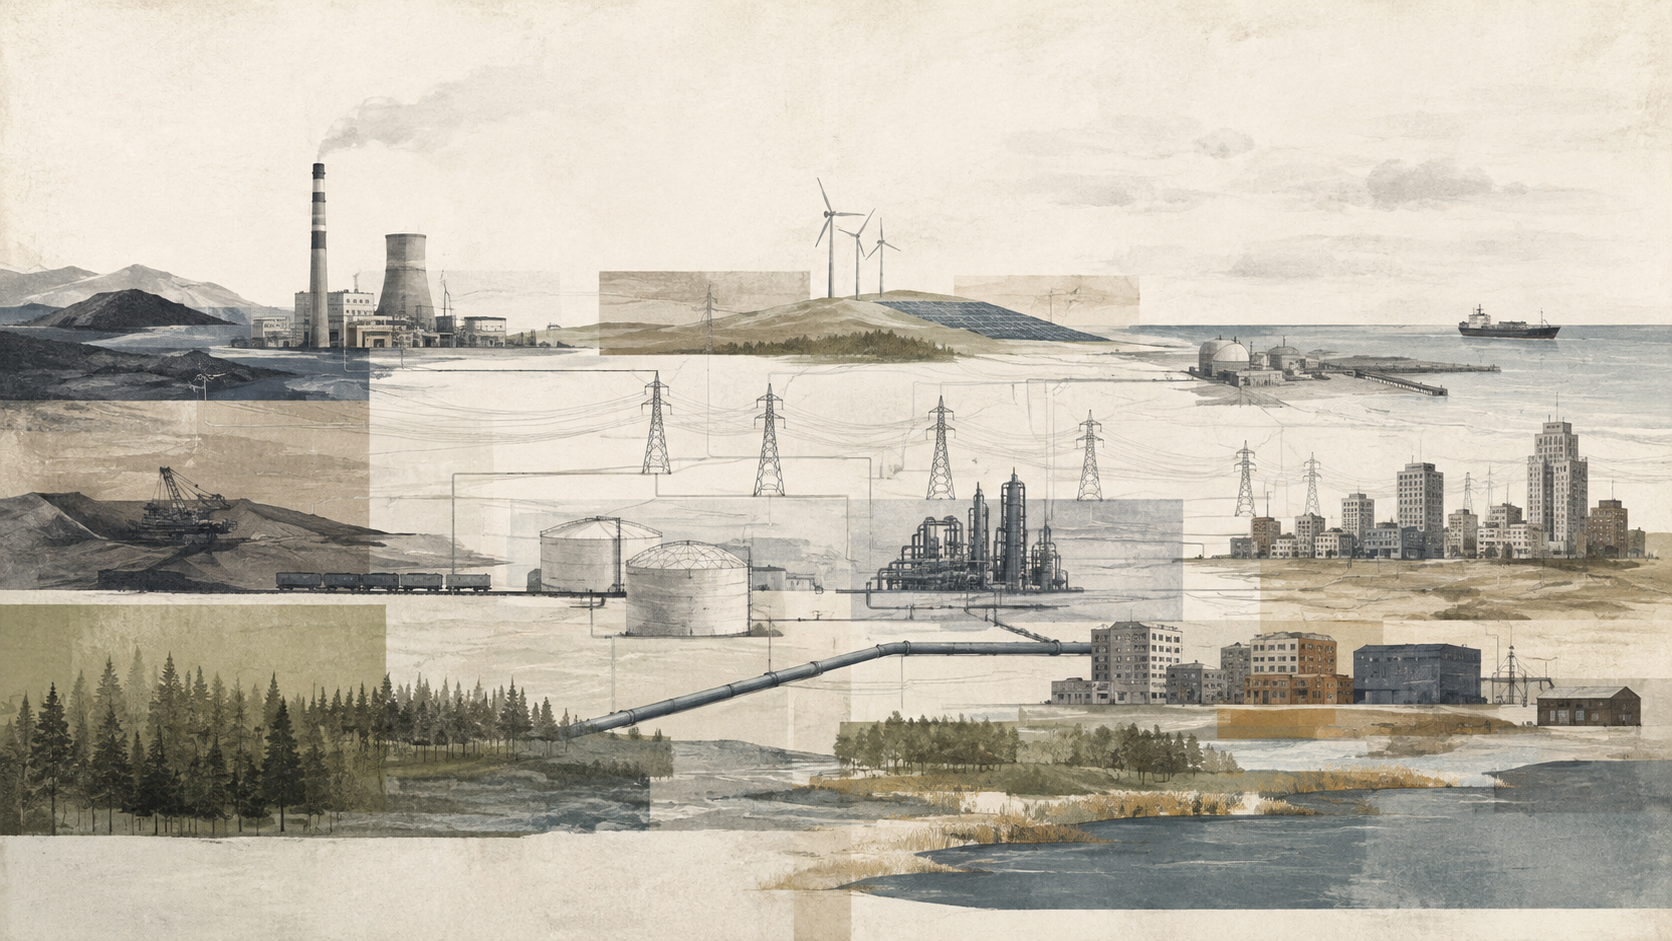
The central argument of this article is that energy is never delivered by technology alone. It is delivered by an architecture of conversion, coordination, maintenance, investment, information, rules, and public responsibility. Understanding that architecture is the first step toward evaluating reliability, affordability, security, resilience, environmental impact, and transition.
Why Energy Systems Matter
Energy systems matter because they are enabling systems. They do not merely support society from the outside; they establish the material conditions under which most social and economic activity can occur. Hospitals require electricity, cooling, sterilization, refrigeration, transportation, communications, and backup power. Water systems require pumping, treatment, monitoring, and distribution. Food systems require fertilizer, machinery, irrigation, processing, refrigeration, and logistics. Digital services require electricity, data centers, networks, cooling, and resilient power supplies. Homes require heating, cooling, cooking, lighting, and appliances. Industry requires process heat, motors, furnaces, compressed air, pumps, feedstocks, and transportation.
Because energy is embedded in these services, failure rarely remains confined to the energy sector. A power outage can interrupt water treatment, telecommunications, health care, transportation, payments, public safety, and food storage. A fuel disruption can affect freight, agriculture, emergency response, aviation, and industrial production. A heat wave can simultaneously increase electricity demand, reduce thermal-plant efficiency, constrain transmission, intensify health risk, and expose unequal access to cooling.
Energy systems also account for a large share of the environmental pressures associated with modern production and consumption. Fossil-fuel extraction and combustion contribute to climate change and air pollution. Hydropower alters rivers and ecosystems. Bioenergy can affect land, water, biodiversity, and food systems. Renewable infrastructure requires land, minerals, manufacturing, transmission, and end-of-life management. Nuclear systems involve fuel cycles, safety institutions, waste, cooling water, and long-term stewardship. No energy source exists outside environmental and material systems.
The design of energy systems therefore influences at least five public outcomes:
- capability — whether people and institutions can obtain the energy services needed for health, mobility, communication, production, and dignity;
- reliability — whether energy is available with the continuity, quality, and timing required by users;
- affordability — whether households, public institutions, and productive sectors can pay for necessary services without excessive burden;
- environmental integrity — whether the system operates within climate, ecological, water, land, pollution, and material constraints;
- legitimacy — whether decisions about infrastructure, pricing, extraction, risk, and transition are accountable and publicly defensible.
Energy policy often treats these outcomes separately. Reliability may be assigned to system operators, affordability to regulators, emissions to environmental agencies, infrastructure to utilities, and industrial capacity to economic ministries. But the outcomes interact. A system can reduce emissions while increasing household burden. It can lower average prices while becoming more vulnerable to extreme events. It can add clean generation while failing to build transmission. It can improve efficiency while stimulating enough additional demand to offset some of the gains. Systems analysis is necessary because fragmented decisions can produce coherent failure.
A Working Definition of an Energy System
An energy system is the linked set of physical, technical, economic, ecological, institutional, and social arrangements through which energy is sourced, converted, transported, stored, distributed, controlled, financed, governed, and used to provide services.
This definition contains several important claims.
First, an energy system includes more than supply. Demand, end-use technologies, behavior, buildings, transportation systems, industrial processes, and service expectations are part of the system. A poorly insulated building does not merely consume energy supplied from elsewhere; its construction helps determine the size and timing of demand. Urban form influences mobility energy. Industrial product standards influence process heat. Appliance efficiency influences grid loads. Demand is produced through infrastructure and institutions, not simply chosen by isolated consumers.
Second, an energy system includes more than physical equipment. Ownership, rate structures, market rules, interconnection procedures, permitting, public investment, maintenance practices, labor capacity, and community consent influence what infrastructure is built and how it operates. Two regions with similar resources can develop very different energy systems because their institutions, histories, capital structures, and political choices differ.
Third, an energy system includes consequences. Pollution, extraction, water use, land change, waste, household burden, labor conditions, and unequal exposure are not external to a complete system description. They may fall outside a company balance sheet or engineering model, but they remain physical and social outputs of the system.
Fourth, an energy system is dynamic. Assets age. Demand changes. Technologies improve. fuels become scarce or politically constrained. Weather varies. Institutions learn or fail to learn. Investment cycles create long-lived commitments. Energy systems must therefore be studied over time rather than as static inventories.
| Dimension | What it includes | Central question |
|---|---|---|
| Physical | Resources, energy flows, infrastructure, equipment, losses, and environmental interactions. | What moves, converts, accumulates, degrades, or constrains operation? |
| Technical | Generation, networks, storage, controls, standards, maintenance, and end-use technologies. | How is useful service produced reliably and safely? |
| Economic | Costs, prices, investment, finance, ownership, trade, and risk allocation. | Who pays, who invests, and what incentives shape behavior? |
| Institutional | Utilities, regulators, system operators, agencies, laws, planning, and public authority. | Who decides, coordinates, monitors, and corrects the system? |
| Ecological | Emissions, extraction, land, water, biodiversity, pollution, waste, and climate exposure. | What environmental systems support or absorb energy activity? |
| Social | Access, burden, labor, health, participation, distribution, culture, and legitimacy. | Whose needs are served, whose risks increase, and who has voice? |
A useful definition must be broad enough to include these dimensions but specific enough to guide analysis. The goal is not to include everything indiscriminately. It is to identify the relationships necessary to explain system behavior and public consequences.
From Resources to Useful Energy Services
Energy systems can be understood as chains that connect natural or stored resources to final services. Sunlight, wind, moving water, geothermal heat, fossil fuels, biomass, and uranium are not useful to society in the same form or location in which they occur. They must be captured, extracted, converted, transported, stored, controlled, and applied through devices.
A simplified chain may be represented as:
\text{Resource}
\rightarrow
\text{Primary Energy}
\rightarrow
\text{Conversion}
\rightarrow
\text{Energy Carrier}
\rightarrow
\text{End Use}
\rightarrow
\text{Useful Service}
\]
Interpretation: Energy systems connect resources to services through multiple stages. Each stage introduces infrastructure requirements, losses, costs, risks, and governance decisions.
Coal may be extracted, transported, burned in a boiler, converted into steam, used to rotate a turbine, converted again into electricity, transmitted through a grid, transformed to a lower voltage, and finally used by a motor. Sunlight may be converted directly into electricity by photovoltaic cells, conditioned through an inverter, delivered through a building circuit, and used to operate a heat pump. Natural gas may be extracted, processed, moved through pipelines, combusted in a furnace, and converted into indoor heat. Electricity may power an electrolyzer, producing hydrogen that is stored, transported, and used as an industrial feedstock.
The service at the end of the chain matters. People generally do not demand kilowatt-hours for their own sake. They demand thermal comfort, mobility, illumination, refrigeration, communication, production, or another outcome. This distinction creates opportunities for system improvement. The same level of thermal comfort may require very different energy input depending on insulation, building design, equipment, climate, and controls. The same mobility service may be provided through different combinations of urban form, public transit, vehicle technology, and travel demand.
Energy analysis that stops at fuel or electricity consumption may therefore miss the most important intervention. A system can reduce primary energy use by improving conversion efficiency, but it can also reduce demand by improving the service-delivery system itself. Better buildings, compact urban form, efficient motors, material efficiency, district energy, shared mobility, and demand management change the amount and timing of energy needed.
System Boundaries and Units of Analysis
Every energy-system analysis begins with a boundary, whether that boundary is stated or not. The boundary determines which resources, technologies, losses, costs, emissions, people, and institutions are included. It also determines what the analyst calls an input, output, efficiency, externality, or responsibility.
A device-level boundary might examine only the conversion efficiency of a motor. A facility boundary might include the motor, drive, electrical distribution, and operating schedule. A utility boundary might include generation, transmission, distribution, and customer demand. A regional boundary might include fuel imports, infrastructure, households, industry, land use, and emissions. A lifecycle boundary might extend upstream to extraction and manufacturing and downstream to decommissioning, recycling, and waste.
Different boundaries answer different questions. None is automatically correct for every purpose. The problem arises when a narrow boundary is used to support a broad claim.
| Boundary | Useful for | What it may omit |
|---|---|---|
| Device | Performance, efficiency, control, and engineering design. | Upstream generation, infrastructure, behavior, and lifecycle effects. |
| Building or facility | Energy management, retrofits, peak demand, and operating cost. | Regional grid constraints, fuel supply, and community consequences. |
| Network | Power flows, losses, congestion, reliability, and coordination. | Upstream materials, household burden, and wider ecological effects. |
| Regional or national | Planning, security, transition, trade, emissions, and public policy. | Local variation, unequal exposure, and global supply-chain impacts. |
| Lifecycle | Extraction, manufacturing, operation, maintenance, and end of life. | Institutional power, distributional effects, and historical context unless added explicitly. |
| Service system | How energy produces mobility, comfort, health, food, or production. | Technical detail when service categories are too aggregated. |
Boundaries are also temporal. A one-hour operating model answers a different question from an annual energy balance. A twenty-year investment model may omit long-term waste or decommissioning. A project appraisal may discount future climate risk. A reliability analysis based on recent weather may not represent future extremes. The time horizon should match the life of the asset, the persistence of the consequence, and the uncertainty relevant to the decision.
Boundary discipline requires analysts to state:
- the geographic area;
- the time interval and resolution;
- the assets, actors, and flows included;
- the upstream and downstream processes included;
- the service or output being evaluated;
- the environmental and social effects measured;
- the exclusions and their likely significance.
A transparent boundary does not eliminate disagreement. It makes disagreement inspectable.
The Physical Architecture of Energy Systems
The physical architecture of an energy system can be organized into linked layers. These layers are analytical distinctions, not isolated compartments. Resource availability affects conversion technology. Conversion choices shape network needs. Networks influence storage and demand. End-use changes alter capacity requirements. Information and control coordinate the whole system.
| Layer | Primary function | Illustrative components |
|---|---|---|
| Resource | Provides primary energy and material inputs. | Sunlight, wind, rivers, geothermal reservoirs, fuels, uranium, biomass, minerals. |
| Conversion | Transforms energy into useful carriers or forms. | Turbines, generators, boilers, reactors, photovoltaic cells, electrolyzers, heat pumps. |
| Transport and networks | Moves electricity, fuels, heat, and materials. | Transmission lines, distribution feeders, pipelines, ports, rail, terminals, district heat. |
| Storage and flexibility | Aligns supply and demand across time. | Batteries, pumped hydro, fuel storage, thermal storage, demand response, reserves. |
| End use | Converts delivered energy into services. | Buildings, vehicles, motors, furnaces, appliances, data centers, industrial processes. |
| Information and control | Measures, forecasts, coordinates, and protects operation. | Meters, sensors, control centers, market software, protection systems, forecasting tools. |
The layers reveal why substitution is rarely simple. Replacing a combustion vehicle with an electric vehicle changes the end-use technology, but it also changes electricity demand, charging infrastructure, distribution loads, fuel supply chains, maintenance, material demand, and potentially urban air pollution. Replacing a coal plant with wind and solar changes generation, but it may also require transmission, storage, flexible demand, market reform, forecasting, and new operational capabilities.
An energy transition is therefore an architectural transformation. It changes multiple layers and the relationships among them.
Resources and Primary Energy
The resource layer includes natural energy flows and stored energy stocks that can be captured or extracted. Solar radiation, wind, hydrological cycles, geothermal heat, biomass growth, fossil fuels, and uranium differ in physical form, spatial distribution, temporal variability, concentration, and environmental consequence.
Resource availability is never purely geological or climatic. It is mediated by land rights, water access, environmental regulation, technology, infrastructure, investment, political authority, and public acceptance. A region may possess excellent wind resources but lack transmission. It may possess fossil resources but prohibit extraction. It may possess solar potential but lack finance, grid access, or institutional capacity. A resource becomes an energy-system input only when a social and technical system can develop it.
Resources also vary in whether they are flows or stocks. Sunlight, wind, and river flow are recurring natural flows that must generally be captured when available. Coal, oil, gas, uranium, and stored biomass are stocks that can be extracted and scheduled, although extraction rates, reserves, infrastructure, and environmental limits constrain their use. This difference affects storage, dispatch, and security.
Resource quality matters. Wind speed, solar irradiance, fuel composition, reservoir temperature, water head, ore grade, and biomass moisture affect the amount of useful energy obtainable from an asset. Resource location matters as well. High-quality renewable resources may be distant from demand. Fuel resources may require pipelines, rail, shipping, ports, processing, and strategic storage.
The resource layer therefore creates geographic advantage, dependency, and conflict. Energy systems are partly maps of where resources exist, who controls them, and how they connect to demand.
Conversion Technologies
Conversion technologies transform energy from one form into another. A turbine converts fluid motion into mechanical rotation. A generator converts mechanical energy into electricity. A photovoltaic cell converts radiant energy into electricity. A battery converts electrical energy into chemical potential and back. A boiler converts chemical energy into heat. A heat pump uses electrical work to move thermal energy. An electrolyzer converts electricity and water into hydrogen.
Conversion is constrained by energy conservation and thermodynamics. Energy is not created by a conversion device. It changes form and crosses boundaries. Some input becomes the intended output; some becomes heat, sound, friction, exhaust, or another less useful form. Efficiency measures the ratio of useful output to input for a stated boundary.
\eta = \frac{E_{\text{useful output}}}{E_{\text{input}}}
\]
Conversion efficiency. Efficiency is meaningful only when the useful output, input, operating condition, and system boundary are defined.
A conversion chain compounds losses. If three stages have efficiencies \(\eta_1\), \(\eta_2\), and \(\eta_3\), the overall efficiency is:
\eta_{\text{overall}} = \eta_1 \eta_2 \eta_3
\]
Chain efficiency. Even high-performing stages can produce substantial total loss when energy passes through several conversions.
Efficiency is not the only criterion. Conversion technologies also differ in capital cost, operating cost, response speed, maintenance, lifetime, safety, emissions, material requirements, land use, water use, scalability, and compatibility with networks and demand. A system may value a less efficient technology because it provides fast response, resilience, portability, high-temperature heat, long-duration storage, or another service not captured by a single efficiency number.
Energy Carriers and Fuel Systems
Energy carriers move energy from one part of the system to another. Electricity, hydrogen, steam, hot water, refined fuels, synthetic fuels, and district heat are examples. They are not all primary resources. Many must be produced through conversion.
Electricity is a particularly important carrier because it can be generated from multiple resources, transmitted rapidly, controlled precisely, and used efficiently in motors, electronics, lighting, and heat pumps. But electricity is difficult to store directly at large scale. It must be balanced continuously or converted into another stored form.
Fuels provide stored chemical energy. Coal, oil products, natural gas, biofuels, hydrogen, ammonia, and synthetic hydrocarbons differ in energy density, handling, safety, emissions, infrastructure, and end-use suitability. Some fuels are also industrial feedstocks. Natural gas is used not only for heat and power but in chemicals and fertilizer. Hydrogen may be used as a feedstock, reductant, fuel, or storage medium.
Fuel systems include extraction or production, processing, refining, compression or liquefaction, transport, storage, terminals, distribution, and end use. The physical properties of the carrier shape the infrastructure. Electricity requires conductors, transformers, protection, and synchronized operation. Natural gas requires pipelines, compressors, storage, and leak management. Hydrogen may require new materials, compression, conversion, and safety practices. District heat requires insulated local networks and suitable urban density.
Carrier choice therefore creates path dependence. Once a region builds extensive infrastructure around a fuel or carrier, industries, buildings, vehicles, labor skills, and institutions adapt around it. Changing the carrier can require coordinated replacement across the whole chain.
Transmission, Transport, and Distribution
Energy must move from where it is available to where it is used. Networks and transport systems perform this function. Electricity travels through transmission and distribution grids. Oil and gas move through pipelines, ships, rail, trucks, terminals, and storage facilities. Coal moves through rail, ports, barges, and conveyors. Heat can move through district-energy networks. Hydrogen and ammonia require specialized production, transport, storage, and conversion systems.
Networks create economies of scale and shared capability, but they also create bottlenecks and interdependence. A new generator may be technically complete but unable to operate because it lacks interconnection. A region may have sufficient annual generation but face local distribution constraints. A fuel system may have adequate global supply but insufficient terminal capacity. A transmission corridor may become a critical point of failure.
Electric networks have distinctive operational requirements. Supply and demand must remain balanced at each moment. Voltage and frequency must remain within acceptable limits. Protection systems must isolate faults. Transmission constraints influence where generation can dispatch. Distribution systems must manage changing loads, rooftop solar, batteries, electric vehicles, and bidirectional flows.
Losses occur in all networks. Electrical resistance produces transmission and distribution loss. Pipelines require compression. Shipping and trucking consume fuel. Stored fuels may evaporate or leak. Heat networks lose thermal energy. Network efficiency should be measured alongside reliability, capacity, congestion, and resilience.
Network expansion is also a governance challenge. Routes cross land and jurisdictions. Costs must be allocated. Benefits may be regional while impacts are local. Permitting, public participation, environmental review, and community consent influence whether projects proceed. Network planning therefore connects technical coordination to public legitimacy.
Storage, Flexibility, and Balancing
Energy systems must align supply and demand across time. Storage and flexibility provide the ability to shift, absorb, release, or avoid energy use.
Storage technologies differ by the form of energy stored, the rate at which they can charge or discharge, the duration they can sustain output, their efficiency, lifetime, location, cost, and operating constraints. Batteries store chemical potential. Pumped hydro stores gravitational potential. Thermal systems store heat or cold. Flywheels store rotational energy. Compressed-air systems store pressure. Fuels store chemical energy. Hydrogen can provide energy storage when produced from electricity and later used, although the conversion chain introduces losses.
Storage is described by both power and energy capacity. Power determines how quickly the system can charge or discharge. Energy capacity determines how long it can sustain that rate.
t_{\text{duration}} = \frac{E_{\text{storage}}}{P_{\text{discharge}}}
\]
Storage duration. A storage asset’s energy capacity divided by discharge power gives an idealized duration before accounting for operating limits and losses.
Flexibility extends beyond storage. It includes dispatchable generation, demand response, flexible industrial loads, controllable electric-vehicle charging, interconnection between regions, reserve capacity, curtailment, forecasting, and operational coordination. A building can pre-cool before a peak. A water heater can shift consumption. An industrial process may adjust timing. A regional grid can import or export power. A generator can ramp output.
The value of flexibility depends on timing and location. A battery in a constrained distribution area may provide more local value than the same battery elsewhere. Long-duration storage may be valuable during prolonged low-renewable periods. Fast-response storage may support frequency control. Thermal storage may reduce building peaks. Storage is not a single service; it is a platform for multiple services that must be defined explicitly.
End Use, Demand, and Energy Services
The end-use layer includes buildings, transportation, industry, agriculture, data centers, appliances, public facilities, and the devices that convert delivered energy into services. It is where energy becomes socially useful, and it is also where much of the system’s demand is created.
Demand is not fixed. It changes with weather, income, prices, technology, behavior, standards, urban form, industrial structure, and public policy. It also varies by time. Electricity demand may peak during hot afternoons or cold mornings. Industrial processes may operate continuously. Transportation fuels may follow commuting and freight patterns. Heating demand may be seasonal.
Demand can be represented as a load profile rather than a single annual number. The shape of the profile influences generation, network, and storage needs. Two users with the same annual consumption can impose different system requirements if one has a sharp peak and the other uses energy steadily.
Energy efficiency reduces the input required for a given service. Conservation reduces or avoids the service or activity itself. Demand response changes timing. Electrification changes the carrier used. Service redesign changes the system that creates demand.
For example:
- insulation reduces the heat required to maintain indoor comfort;
- a heat pump changes both conversion efficiency and electricity demand;
- public transit changes mobility energy by changing the service-delivery system;
- efficient motors reduce industrial electricity demand;
- material efficiency reduces the energy embedded in production;
- smart charging changes when electric vehicles use electricity;
- urban trees and passive design reduce cooling demand before equipment operates.
Treating demand as part of the system expands the design space. The question becomes not only how to supply more energy, but how to deliver services with less input, lower peaks, fewer harms, and greater public benefit.
Information, Sensing, and Control
Modern energy systems depend on information as well as physical energy flows. Sensors, meters, forecasts, communications, control systems, protection devices, market platforms, and operator decisions coordinate assets across time and space.
Electricity grids require continuous measurement of frequency, voltage, power flows, generation, and demand. System operators forecast load and renewable output, schedule resources, procure reserves, and respond to contingencies. Distribution utilities use meters and sensors to identify outages and manage local constraints. Buildings use thermostats and energy-management systems. Industrial facilities use control systems to maintain process conditions. Markets use software to clear bids, settle transactions, and allocate capacity.
Information quality affects system performance. Missing, delayed, incompatible, or biased data can produce poor dispatch, hidden risk, inaccurate billing, weak planning, and unequal service. Cybersecurity is essential because control systems connect digital commands to physical infrastructure. A compromised system can interrupt service or damage equipment.
Digitalization also changes power relationships. Smart meters can improve visibility but raise privacy questions. Automated demand management can reduce peaks but shift control away from users. Proprietary platforms can coordinate distributed resources but obscure decision rules. AI can improve forecasting and optimization but introduce opacity, model risk, and dependence on data quality.
Information should therefore be treated as governed infrastructure. Energy systems need provenance, access controls, auditability, correction procedures, cybersecurity, and clear authority over automated decisions. More data is not automatically better. The information must support legitimate action and protect affected people.
Markets, Finance, and Investment
Energy infrastructure is capital intensive and long lived. Power plants, networks, refineries, pipelines, storage systems, mines, ports, buildings, and industrial equipment require large investments whose costs and risks unfold over decades. Finance therefore shapes the physical system.
Energy markets coordinate some decisions about production, dispatch, trade, and investment. Electricity markets may include energy, capacity, ancillary-service, and transmission components. Fuel markets connect producers, traders, transport, storage, and users. Retail rates translate system costs into customer bills. Contracts allocate price, volume, and performance risk.
Markets do not operate outside institutions. Their rules define eligible participants, pricing methods, settlement intervals, reliability obligations, access to networks, and treatment of external costs. Different market designs can produce different investment and operating behavior even when physical resources are similar.
Finance affects which technologies are built. Capital cost, interest rates, policy stability, revenue certainty, construction risk, fuel-price exposure, and creditworthiness influence project viability. Public guarantees, tax incentives, regulated cost recovery, procurement, and concessional finance can redirect investment. Communities and low-income regions may face higher financing costs even when projects have strong social value.
Energy economics must also account for costs that markets may not price fully: pollution, climate damage, public health, decommissioning, strategic dependency, household burden, and ecological loss. A low private cost may coexist with a high public cost. Conversely, infrastructure with high initial cost may create long-term public value through resilience, access, or avoided harm.
The economic layer is therefore not simply a price signal. It is a system for allocating capital, risk, cost, ownership, and benefit.
Institutions, Governance, and Public Capacity
Energy systems are governed by utilities, regulators, system operators, legislatures, ministries, public agencies, courts, standards bodies, local governments, firms, communities, and international institutions. These actors establish rights, obligations, plans, permits, prices, reliability standards, environmental limits, and processes for public participation.
Institutional capacity determines whether technically plausible pathways can be implemented. A region may have abundant renewable resources but lack the planning authority to build transmission. It may adopt ambitious targets but lack permitting staff, procurement capability, skilled labor, or data systems. It may subsidize new technology without reforming utility incentives. It may build infrastructure without creating maintenance capacity.
Governance performs several functions:
- planning — anticipating demand, infrastructure needs, risks, and transition pathways;
- coordination — aligning generation, networks, storage, end use, land use, and industrial policy;
- regulation — establishing safety, reliability, environmental, pricing, and consumer-protection rules;
- investment — mobilizing public and private capital for long-lived infrastructure;
- monitoring — measuring performance, burden, emissions, service quality, and compliance;
- accountability — enabling review, appeal, correction, and public explanation;
- transition management — addressing workers, communities, stranded assets, affordability, and regional change.
Ownership matters but does not determine outcomes by itself. Investor-owned utilities, public utilities, cooperatives, competitive generators, municipal systems, and community-energy organizations operate under different incentives and accountability structures. Each can perform well or poorly. The critical questions concern goals, authority, competence, transparency, risk allocation, and public obligations.
Institutional fragmentation is a recurring problem. Energy, housing, transportation, environment, industry, labor, and land-use decisions may be made separately even though they shape one system. Effective governance requires coordination across sectors and scales.
Environmental and Social Consequences
Every energy system transforms environments and distributes consequences. These include greenhouse-gas emissions, air pollution, water withdrawal and consumption, land disturbance, habitat change, extraction, waste, noise, safety risk, labor conditions, displacement, and household cost.
The consequences occur across the lifecycle. Upstream extraction affects landscapes, water, labor, and communities. Manufacturing requires materials and energy. Operation produces emissions, waste heat, noise, or other impacts. Networks require corridors and rights of way. Decommissioning creates liabilities and material flows. Recycling can recover value but also introduce its own energy and environmental requirements.
Impacts are unevenly distributed. Communities near mines, refineries, power plants, ports, highways, pipelines, and waste sites may bear concentrated burdens while benefits are distributed elsewhere. Low-income households may face high energy costs because of inefficient housing, old appliances, unstable service, or rate structures. Workers and regions dependent on incumbent industries may face transition risk. Indigenous peoples may experience extraction or infrastructure development on lands central to rights, culture, and identity.
Environmental and social analysis should therefore ask:
- where impacts occur across the lifecycle;
- which populations are exposed;
- who receives benefits and compensation;
- who participates in decisions;
- which harms are cumulative or irreversible;
- what responsibilities persist after an asset closes.
A technology can be low-carbon and still create significant local or supply-chain harm. A transition can reduce average pollution while leaving historically burdened communities behind. A complete system boundary must include both aggregate outcomes and distribution.
Interdependence with Other Critical Systems
Energy systems depend on and support other infrastructures. These relationships create both capability and cascading risk.
Water systems need energy for pumping, treatment, heating, cooling, and distribution. Energy systems need water for extraction, refining, thermal generation, cooling, hydropower, bioenergy, and manufacturing. Transportation moves fuels, materials, workers, and equipment. Telecommunications support grid control, markets, emergency response, and distributed-resource coordination. Digital systems require electricity and cooling. Food systems require energy throughout production and logistics. Health systems depend on reliable electricity, heating, cooling, transportation, and supply chains.
| Connected system | Dependence on energy | Energy-system dependence |
|---|---|---|
| Water | Pumping, treatment, desalination, heating, and distribution. | Cooling, hydropower, extraction, refining, and manufacturing. |
| Transportation | Fuel, electricity, charging, signaling, and logistics. | Fuel delivery, equipment transport, maintenance access, and workforce mobility. |
| Telecommunications | Power for networks, towers, data centers, and devices. | Monitoring, protection, dispatch, markets, and emergency coordination. |
| Food | Fertilizer, machinery, irrigation, processing, refrigeration, and freight. | Bioenergy resources, land competition, and agricultural residues. |
| Health | Clinical equipment, refrigeration, ventilation, heat protection, and emergency services. | Workforce health, public legitimacy, and emergency prioritization. |
| Finance | Electricity and digital infrastructure for transactions and markets. | Capital, insurance, credit, investment, and risk pricing. |
Interdependence means that energy-system resilience cannot be assessed in isolation. Backup generators require fuel delivery. Communications may fail during an outage. Water systems may lose pressure. Roads may be blocked. Extreme heat may increase demand while reducing equipment performance. Compound events can exceed assumptions based on one hazard at a time.
System planning should therefore identify critical dependencies, common-mode failures, minimum service requirements, recovery priorities, and coordination responsibilities before disruption occurs.
Historical Layering, Lock-In, and Path Dependence
Energy systems are historically layered. New technologies enter landscapes already shaped by existing fuels, networks, cities, industries, laws, labor skills, ownership, political commitments, and sunk capital. The system does not begin from a clean design.
Infrastructure lasts for decades. Buildings, roads, pipelines, power plants, transmission lines, industrial facilities, and vehicle fleets create long-lived demand and operating patterns. Institutions adapt around these assets. Regulations assume particular technologies. Workers develop specialized skills. firms protect investments. Communities depend on tax revenue and employment. Consumers purchase compatible equipment.
This creates path dependence: past choices influence current options and costs. A gas-heated building stock makes electrification different from a region already using district heat. A centralized grid creates different institutional habits from a system with strong municipal or cooperative ownership. A port and refinery complex can anchor a regional economy. Automobile-oriented land use increases transportation energy demand beyond the vehicle itself.
Lock-in can be technical, economic, institutional, political, or cultural.
- Technical lock-in: infrastructure is designed around a particular fuel, voltage, standard, or operating model.
- Economic lock-in: capital recovery, contracts, and asset values create incentives to continue operation.
- Institutional lock-in: rules, agencies, and professional practices assume the existing system.
- Political lock-in: firms, workers, regions, and governments organize around incumbent interests.
- Cultural lock-in: expectations about mobility, comfort, ownership, and growth shape demand.
Transition strategy must therefore address more than replacement technology. It must create new infrastructure, retire or repurpose old assets, reform institutions, support workers and communities, manage financial risk, and change demand systems. The speed and justice of transition depend on how these layers are handled.
Reliability, Resilience, and Energy Security
Reliability is the ability of an energy system to deliver service according to accepted standards under expected operating conditions. Resilience is the ability to anticipate, absorb, adapt to, and recover from disruptive events. Energy security concerns the availability of energy and critical inputs under economic, geopolitical, technical, and environmental stress.
These ideas overlap but are not identical. A system can be reliable during normal operation yet fragile under extreme events. It can be resilient locally but dependent on a vulnerable imported fuel. It can possess abundant capacity but lack transmission. It can maintain aggregate supply while failing critical facilities or vulnerable households.
Reliability measures may include outage frequency, outage duration, reserve margin, loss of load, voltage quality, fuel availability, and equipment performance. Resilience analysis extends to high-impact events, cascading failure, restoration, communication, adaptation, and social consequences. Security analysis includes fuel diversity, strategic reserves, trade routes, critical minerals, cyber risk, manufacturing capacity, and geopolitical dependence.
A resilience strategy may include:
- redundancy and diverse supply;
- microgrids and islanding for critical services;
- hardened substations and flood protection;
- black-start and restoration capability;
- spare transformers and repair capacity;
- distributed generation and storage;
- flexible demand and emergency load management;
- weatherization and climate-informed design;
- cybersecurity and fallback communications;
- community-centered emergency planning.
Resilience is not achieved by maximizing every buffer. Redundancy costs money and materials. Centralization can create efficiency but also concentration risk. Decentralization can improve local capability but complicate coordination. The goal is to identify critical services, plausible hazards, system dependencies, and acceptable recovery pathways.
Affordability, Justice, and Public Value
Energy systems produce public value when they enable health, safety, mobility, communication, economic participation, education, and dignified living. Because energy services are necessary, affordability and access are system performance measures rather than secondary social concerns.
Household energy burden is commonly represented as the share of household income spent on energy:
B = \frac{C_{\text{household energy}}}{Y_{\text{household income}}}
\]
Energy burden. The same bill creates different burdens depending on income, housing efficiency, climate, tenure, and access to assistance.
High burden can result from low income, inefficient housing, volatile fuel prices, poor equipment, extreme weather, rate design, or disconnection practices. It can lead households to reduce heating, cooling, food, medicine, or other necessities. Energy insecurity also includes service interruptions, unsafe coping strategies, and inability to maintain adequate indoor conditions.
Energy justice examines distribution, procedure, recognition, and repair.
- Distributional justice asks how costs, benefits, pollution, reliability, and transition burdens are allocated.
- Procedural justice asks who participates meaningfully in planning, siting, regulation, and investment.
- Recognition justice asks whether affected communities and knowledge systems are respected.
- Restorative justice asks how historical harm, exclusion, and underinvestment are addressed.
Justice changes technical analysis. It requires disaggregated data rather than system averages alone. It asks whether a reliability improvement protects critical and vulnerable users. It examines who can access efficiency programs, rooftop solar, electric vehicles, or community energy. It considers workers and regions affected by asset retirement. It evaluates whether participation can influence decisions rather than merely document opposition.
An energy system should not be called successful merely because it is technically functional. It must also be judged by whom it serves and what burdens it reproduces.
Energy Transition and Decarbonization
Energy transition is the long-term transformation of an energy system from one dominant configuration to another. It includes changes in resources, conversion technologies, networks, storage, demand, institutions, markets, labor, materials, and public expectations.
The contemporary transition is driven by climate change, air pollution, technological change, energy security, industrial competition, and ecological constraints. Decarbonization requires reducing greenhouse-gas emissions across power, transportation, buildings, industry, and fuel systems.
Several strategies interact:
- reducing unnecessary demand and improving efficiency;
- expanding low-carbon electricity generation;
- electrifying vehicles, heating, appliances, and some industrial processes;
- building transmission, distribution, storage, and flexible demand;
- changing industrial processes and materials;
- reducing methane and other non-carbon-dioxide emissions;
- developing low-carbon fuels for difficult applications;
- retiring high-emission assets and managing transition impacts;
- protecting households, workers, and communities during change.
Decarbonization is not simply the addition of renewable generation. A renewable project may be delayed by interconnection. Electrification may increase peak demand. New transmission may face siting conflict. Storage may require materials and manufacturing. Industrial change may require new feedstocks, standards, and infrastructure. Climate resilience must be built into new assets.
Transition pathways also involve uncertainty. Technology cost, demand, policy, climate impacts, supply chains, and public acceptance may change. Scenario analysis is useful because it tests several coherent pathways rather than pretending to predict one future precisely.
The quality of transition depends on sequence. Efficiency and demand flexibility can reduce infrastructure needs. Grid investment can enable electrification. Workforce development can reduce implementation bottlenecks. Early community participation can improve legitimacy. Poor sequencing can create shortages, price shocks, stranded assets, or backlash.
Materials, Supply Chains, and Lifecycle Boundaries
Energy infrastructure is material infrastructure. It requires steel, concrete, copper, aluminum, silicon, lithium, nickel, cobalt, graphite, rare earths, uranium, catalysts, polymers, ceramics, and many other inputs. The energy transition changes material demand rather than eliminating extraction.
A lifecycle perspective follows an asset through:
- resource extraction;
- processing and refining;
- component manufacturing;
- construction and installation;
- operation and maintenance;
- repair, refurbishment, or repowering;
- decommissioning;
- reuse, recycling, disposal, and site restoration.
Material requirements can create supply risk, price volatility, environmental harm, labor concerns, and geopolitical dependence. Manufacturing concentration can become a strategic constraint. Large transformers, turbines, cables, batteries, and power electronics may have long lead times. A system can possess financial capital but lack physical production capacity.
Lifecycle assessment measures environmental inputs and outputs across these stages. It can compare technologies more completely than operational emissions alone. But lifecycle analysis still depends on boundaries, data quality, allocation methods, location, and future assumptions. Average values may obscure high-impact mines, factories, or disposal practices.
Circular strategies include longer product life, repair, modular design, reuse, remanufacturing, material substitution, and recycling. They can reduce new extraction but require collection systems, standards, processing capacity, and product designs that support recovery.
Materials connect energy policy to industrial policy. A credible transition pathway must consider not only how many assets are needed, but whether the materials, factories, workforce, logistics, and institutions exist to build and maintain them.
Mathematical Lens
Energy systems require measurement because supply, demand, conversion, capacity, storage, reliability, emissions, cost, and burden must be compared across time and scale.
The foundational relation between power and energy is:
E = \int_{t_0}^{t_1} P(t)\,dt
\]
Energy from power. Total energy is the integral of power over time. When power is constant, the relation simplifies to \(E = Pt\).
An energy balance for a defined system may be written as:
E_{\text{input}} + E_{\text{imports}} + E_{\text{storage discharge}}
=
E_{\text{useful}} + E_{\text{losses}} + E_{\text{exports}} + E_{\text{storage charge}}
\]
System balance. Conservation requires inputs and releases from storage to equal useful output, losses, exports, and additions to storage over the stated boundary and interval.
Capacity factor compares actual generation with maximum theoretical output:
CF = \frac{E_{\text{actual}}}{P_{\text{nameplate}} \Delta t}
\]
Capacity factor. The value reflects resource availability, outages, dispatch, curtailment, demand, and operating constraints.
Emissions intensity can be calculated as:
I = \frac{\sum_i E_i f_i}{\sum_i E_i}
\]
Weighted emissions intensity. Each source \(i\) contributes energy \(E_i\) multiplied by an emissions factor \(f_i\).
A simple reserve margin is:
RM = \frac{C_{\text{available}} – D_{\text{peak}}}{D_{\text{peak}}}
\]
Reserve margin. This is a planning indicator, not a complete measure of probabilistic adequacy or resilience.
These equations are useful because they force clarity about units, time, boundaries, and definitions. They are not complete system models. A single annual energy balance cannot reveal hourly reliability. Capacity factor does not measure value. Emissions intensity depends on accounting conventions. Reserve margin may omit transmission, fuel, weather, and correlated outages. Mathematical indicators should be connected to the mechanism and decision they are intended to represent.
| Indicator | What it measures | What it does not establish alone |
|---|---|---|
| Energy consumption | Total quantity used over an interval. | Peak demand, service quality, or affordability. |
| Peak power | Maximum rate of use or delivery. | Annual energy, duration, or resilience. |
| Efficiency | Useful output relative to input. | Absolute demand, lifecycle impact, or justice. |
| Capacity factor | Actual output relative to theoretical maximum. | Reliability contribution, market value, or environmental impact. |
| Emissions intensity | Emissions per unit of energy or service. | Total emissions when demand changes. |
| Energy burden | Household energy cost relative to income. | Indoor conditions, service quality, or disconnection risk by itself. |
A Practical Energy-System Mapping Method
A system map makes the analytical boundary visible. It should show physical flows, information flows, financial flows, authority, consequences, and feedback.
A practical method can proceed in ten steps.
- Define the service. State what the system is expected to provide: electricity, heat, mobility, process energy, or another capability.
- Choose the boundary. Define geography, time horizon, sectors, lifecycle stages, and populations.
- List resources and imports. Identify primary energy, fuels, electricity, materials, water, and external dependencies.
- Map conversion assets. Identify technologies, capacities, efficiencies, operating constraints, and emissions.
- Map networks and storage. Identify bottlenecks, losses, interconnections, reserves, and critical nodes.
- Describe demand. Use load profiles, service needs, end-use technologies, and vulnerable users.
- Map institutions and rules. Identify owners, operators, regulators, markets, standards, permits, and public obligations.
- Map consequences. Include costs, emissions, health, land, water, extraction, labor, and household burden.
- Identify feedback and risk. Examine price response, investment cycles, demand growth, maintenance, climate stress, and policy resistance.
- Test change. Compare scenarios, distributional effects, failure modes, and sequencing.
The map should distinguish measured data, modeled estimates, assumptions, and judgments. It should also record uncertainty and missing populations. A map that includes only infrastructure may be useful for engineering but incomplete for governance. A map that includes only institutions may miss physical constraints. The purpose determines emphasis, but the omissions should remain explicit.
Worked Example: A Regional Electricity and Heat System
Consider a synthetic region with one million residents, a mixed urban and rural economy, cold winters, growing summer cooling demand, several industrial facilities, and an electricity grid connected to neighboring regions.
The regional system includes:
- natural-gas, wind, solar, hydro, and nuclear generation;
- high-voltage imports and exports;
- urban and rural distribution networks;
- gas pipelines and storage;
- electric resistance heat, heat pumps, gas furnaces, and district heat;
- industrial motors, boilers, furnaces, and process heat;
- batteries, demand response, and emergency generators;
- utilities, a regional system operator, regulators, municipalities, and community organizations.
A narrow supply analysis might ask whether annual generation equals annual electricity demand. Suppose the region generates 35 terawatt-hours and consumes 33 terawatt-hours. The annual balance appears adequate.
A systems analysis asks additional questions:
- Does supply meet the winter evening peak when solar output is low?
- Can transmission deliver imported power during regional cold weather?
- Do gas and electricity systems depend on the same constrained fuel infrastructure?
- Which distribution feeders can support rapid heat-pump and vehicle adoption?
- Can critical facilities operate during an extended outage?
- Which households face high heating burden or unsafe indoor temperatures?
- How does industrial demand respond to prices or emergencies?
- What water, land, emissions, and material impacts accompany each pathway?
Now suppose the region adopts a strategy to electrify half of building heat. Annual electricity demand rises, but the more important change is the winter peak. Heat pumps are efficient, yet their demand increases during cold conditions, and performance can decline at very low temperatures depending on equipment. Distribution upgrades, weatherization, thermal storage, flexible controls, and backup strategies become part of the electrification pathway.
A coordinated pathway might include:
| Intervention | System mechanism | Evidence to monitor |
|---|---|---|
| Building weatherization | Reduces heat demand and peak electricity needs before equipment replacement. | Heating load, indoor temperature, bill savings, participation by income. |
| Cold-climate heat pumps | Replaces combustion with efficient electric heat. | Seasonal performance, peak demand, backup use, installation quality. |
| Distribution upgrades | Expands local capacity for electrified heat and vehicles. | Feeder loading, voltage, outage performance, project cost. |
| Thermal storage and controls | Shifts heating demand away from system peaks. | Load shape, comfort, user override, control reliability. |
| Wind, transmission, and firm capacity | Adds winter energy and resource adequacy. | Availability during stress, congestion, curtailment, imports. |
| Affordability protection | Prevents transition cost from increasing household burden. | Energy burden, arrears, disconnections, access to retrofits. |
The example shows why annual energy, device efficiency, infrastructure, demand shape, institutions, and justice must be analyzed together. The heat pump is part of the transition, but it is not the transition by itself.
Data, Evidence, and Measurement
Energy-system evidence comes from meters, utility records, fuel statistics, market data, equipment telemetry, surveys, remote sensing, environmental monitoring, engineering studies, household data, and administrative systems. These sources differ in resolution, coverage, definitions, and accessibility.
A reliable evidence system should preserve:
- provenance — where the data came from and who produced it;
- units — including prefixes, energy basis, currency, and conversion conventions;
- time — timestamp, interval, timezone, aggregation, and revision history;
- geography — asset, feeder, jurisdiction, region, or market boundary;
- method — observed, estimated, modeled, imputed, or surveyed;
- uncertainty — measurement error, missingness, model range, and sensitivity;
- population coverage — who or what is excluded from the dataset;
- versioning — how values, definitions, and methods change over time.
Energy data frequently contains compatibility problems. One dataset may use gross generation and another net generation. Fuel statistics may use higher or lower heating value. Emissions factors may represent direct combustion or lifecycle impacts. Building data may aggregate weather, occupancy, and equipment differences. Household averages may hide severe burden.
Data should support causal and operational understanding rather than dashboard display alone. Analysts need to connect measurements to mechanisms: why demand changed, why an outage occurred, why a project was curtailed, why a household could not afford service, or why a forecast failed.
Public data also supports accountability. Transparent information about rates, outages, interconnection, pollution, burden, investment, and performance allows communities, regulators, researchers, and decision-makers to evaluate the system. Transparency is valuable only when people can understand the information and use it to challenge or change decisions.
SQL Workflow: Energy-System Registry
A relational schema can connect assets, hourly flows, storage, demand, institutions, and impacts without collapsing them into one table.
Suggested filename:
articles/what-are-energy-systems/sql/schema.sql-- Foundational Energy-System Registry
-- -----------------------------------
-- Stores assets, hourly flows, storage, demand, and system consequences.
CREATE TABLE IF NOT EXISTS energy_assets (
asset_id TEXT PRIMARY KEY,
asset_name TEXT NOT NULL,
asset_type TEXT NOT NULL,
technology TEXT NOT NULL,
region TEXT NOT NULL,
owner TEXT,
nameplate_mw REAL,
commissioning_year INTEGER,
status TEXT NOT NULL
);
CREATE TABLE IF NOT EXISTS hourly_energy_flows (
timestamp_utc TEXT NOT NULL,
asset_id TEXT NOT NULL,
input_mwh REAL DEFAULT 0,
useful_output_mwh REAL DEFAULT 0,
losses_mwh REAL DEFAULT 0,
emissions_kg_co2e REAL DEFAULT 0,
PRIMARY KEY (timestamp_utc, asset_id),
FOREIGN KEY (asset_id) REFERENCES energy_assets(asset_id)
);
CREATE TABLE IF NOT EXISTS storage_state (
timestamp_utc TEXT NOT NULL,
asset_id TEXT NOT NULL,
charge_mwh REAL DEFAULT 0,
discharge_mwh REAL DEFAULT 0,
state_of_charge_mwh REAL NOT NULL,
PRIMARY KEY (timestamp_utc, asset_id),
FOREIGN KEY (asset_id) REFERENCES energy_assets(asset_id)
);
CREATE TABLE IF NOT EXISTS regional_demand (
timestamp_utc TEXT NOT NULL,
region TEXT NOT NULL,
sector TEXT NOT NULL,
demand_mwh REAL NOT NULL,
critical_load_mwh REAL DEFAULT 0,
PRIMARY KEY (timestamp_utc, region, sector)
);
CREATE TABLE IF NOT EXISTS system_impacts (
reporting_period TEXT NOT NULL,
region TEXT NOT NULL,
emissions_tonnes_co2e REAL,
water_withdrawal_m3 REAL,
land_disturbance_hectares REAL,
household_energy_burden_mean REAL,
outage_minutes_mean REAL,
PRIMARY KEY (reporting_period, region)
);The schema separates assets from observations and makes time, region, technology, and system consequences explicit. It can be extended with transmission nodes, market prices, fuel contracts, maintenance events, environmental exposure, and governance records.
A basic balance query can identify whether recorded inputs reconcile with useful output and losses:
SELECT
    substr(timestamp_utc, 1, 10) AS day,
    SUM(input_mwh) AS input_mwh,
    SUM(useful_output_mwh) AS useful_output_mwh,
    SUM(losses_mwh) AS losses_mwh,
    SUM(input_mwh - useful_output_mwh - losses_mwh) AS residual_mwh
FROM hourly_energy_flows
GROUP BY substr(timestamp_utc, 1, 10)
ORDER BY day;
A nonzero residual may indicate missing flows, inconsistent boundaries, measurement error, or data-quality problems. The query does not explain the cause, but it makes the accounting gap visible.
Python Workflow: Energy-System Balance
The following dependency-light Python example evaluates a small system balance, useful energy, losses, emissions intensity, and peak demand.
Suggested filename:
articles/what-are-energy-systems/python/system_balance.pyfrom __future__ import annotations
from dataclasses import dataclass
@dataclass(frozen=True)
class EnergySource:
name: str
generation_mwh: float
emissions_kg_co2e_per_mwh: float
network_loss_fraction: float
def delivered_energy(self) -> float:
return self.generation_mwh * (1.0 - self.network_loss_fraction)
def emissions(self) -> float:
return self.generation_mwh * self.emissions_kg_co2e_per_mwh
def analyze_system(
sources: list[EnergySource],
demand_mwh: list[float],
storage_discharge_mwh: float = 0.0,
storage_charge_mwh: float = 0.0,
) -> dict[str, float]:
generated = sum(source.generation_mwh for source in sources)
delivered = sum(source.delivered_energy() for source in sources)
network_losses = generated - delivered
total_demand = sum(demand_mwh)
available = delivered + storage_discharge_mwh
net_required = total_demand + storage_charge_mwh
balance = available - net_required
emissions = sum(source.emissions() for source in sources)
emissions_intensity = emissions / delivered if delivered else 0.0
return {
"generated_mwh": generated,
"delivered_mwh": delivered,
"network_losses_mwh": network_losses,
"total_demand_mwh": total_demand,
"peak_demand_mw": max(demand_mwh),
"balance_mwh": balance,
"emissions_kg_co2e": emissions,
"delivered_emissions_intensity": emissions_intensity,
}
def main() -> None:
sources = [
EnergySource("wind", 480.0, 12.0, 0.035),
EnergySource("solar", 260.0, 18.0, 0.030),
EnergySource("gas", 310.0, 430.0, 0.025),
]
hourly_demand = [
38.0, 36.0, 35.0, 34.0, 35.0, 39.0,
44.0, 49.0, 52.0, 54.0, 56.0, 58.0,
60.0, 61.0, 62.0, 64.0, 67.0, 72.0,
75.0, 71.0, 63.0, 55.0, 48.0, 42.0,
]
results = analyze_system(
sources=sources,
demand_mwh=hourly_demand,
storage_discharge_mwh=90.0,
storage_charge_mwh=55.0,
)
for key, value in results.items():
print(f"{key},{value:.3f}")
if __name__ == "__main__":
main()The example is intentionally transparent. It distinguishes generated energy from delivered energy, makes network losses visible, includes storage charging and discharging, compares available energy with demand, and calculates emissions intensity. A production model would need timestamps, power limits, unit commitment, storage state, imports, reserves, transmission constraints, weather, uncertainty, and validation against observed data.
The important lesson is methodological: the model must reflect the system boundary and service question. More complexity is useful only when it represents mechanisms relevant to the decision.
GitHub Repository
Complete Code Repository
The Energy Systems companion repository supports reproducible analysis across system balances, hourly demand, generation, storage, conversion, emissions, affordability, resilience, lifecycle impacts, and scenario modeling. The folder for this article should serve as the foundational data and architecture layer for the series.
Recommended article-folder structure:
articles/what-are-energy-systems/
├── README.md
├── data/
│   ├── raw/
│   ├── processed/
│   └── synthetic/
├── docs/
│   ├── system-boundary.md
│   ├── data-dictionary.md
│   └── validation-plan.md
├── sql/
│   ├── schema.sql
│   └── example_queries.sql
├── python/
│   ├── system_balance.py
│   ├── flow_validation.py
│   └── scenario_comparison.py
├── r/
│   └── regional_energy_summary.R
├── notebooks/
│   └── foundational_energy_system_map.ipynb
└── outputs/
    ├── figures/
    └── tables/
The repository should distinguish synthetic teaching data from observed public data, record units and provenance, validate balance residuals, and preserve assumptions so readers can inspect how each result was produced.
Common Misconceptions
Several misconceptions weaken energy-system analysis.
| Misconception | Why it is incomplete | Better framing |
|---|---|---|
| An energy system is a collection of technologies. | Technologies depend on networks, institutions, finance, information, labor, users, and environments. | Analyze relationships and coordination, not equipment alone. |
| More generation automatically improves reliability. | Generation may be unavailable at the needed time or constrained by fuel, transmission, weather, or outages. | Evaluate adequacy, location, timing, deliverability, and recovery. |
| Renewable energy has no environmental impact. | Renewable systems require land, materials, manufacturing, networks, and end-of-life management. | Compare lifecycle impacts and service benefits transparently. |
| Electricity is always a primary energy source. | Electricity is generally an energy carrier produced from primary resources. | Trace the full conversion chain and generation mix. |
| Efficiency alone reduces total energy use. | Demand growth, rebound, service expansion, and boundary choices may offset savings. | Measure absolute use, service, timing, and distribution. |
| Low average cost means energy is affordable. | Household burden depends on income, housing, rate design, climate, and access. | Use distributional and household-level evidence. |
| The energy transition is a technology swap. | Transition changes infrastructure, institutions, labor, materials, markets, and public expectations. | Treat transition as system transformation. |
| A model gives the answer. | Models depend on boundaries, data, assumptions, objectives, and excluded mechanisms. | Use models as inspectable tools for comparison and learning. |
The systems view does not make every question more complicated than necessary. It prevents a narrow answer from being mistaken for a complete one.
Questions for Analyzing Any Energy System
A practical assessment can begin with the following questions.
- What service is the system expected to provide?
- What is the geographic, temporal, sectoral, and lifecycle boundary?
- Which resources, carriers, and external imports support it?
- Which conversion technologies and networks connect supply to demand?
- Where are the principal losses, bottlenecks, and constraints?
- How does demand vary by time, location, sector, and population?
- What storage, reserves, flexibility, and recovery capabilities exist?
- Which information and control systems coordinate operation?
- Who owns, regulates, finances, operates, and maintains the system?
- Which prices, rules, and incentives shape investment and behavior?
- What emissions, extraction, land, water, waste, health, and labor effects occur?
- Who receives benefits and who bears burden or risk?
- How does the system depend on water, transport, telecommunications, food, and digital infrastructure?
- Which historical assets and institutions create lock-in?
- How would the system perform under extreme weather, cyberattack, supply disruption, or rapid demand growth?
- What transition pathways are physically feasible, institutionally governable, and publicly legitimate?
- Which evidence would change the conclusion?
These questions transform energy analysis from technology description into system diagnosis. They also reveal where evidence is missing and where decisions depend on values rather than measurement alone.
Why the Systems View Matters
Energy systems connect resources to human capability through infrastructures, technologies, institutions, and decisions. They include generation and fuels, but they also include networks, storage, end use, information, markets, governance, materials, labor, environmental consequences, and public expectations.
This broader definition is not an attempt to make energy impossible to analyze. It makes the analysis more accurate. A narrow device calculation remains useful when the question concerns device performance. A dispatch model remains useful when the question concerns operation. A market model remains useful when the question concerns pricing or investment. But none should be mistaken for the entire system.
The systems view clarifies why isolated technical solutions often disappoint. A renewable project without interconnection does not decarbonize the grid. A battery without a defined service does not create resilience. A heat pump without building improvement, distribution capacity, installation quality, and affordability protection may not deliver the intended transition. A market without public obligations may not provide reliability or justice. A policy target without institutional capacity may remain symbolic.
It also clarifies why energy transformation is difficult. Modern systems are historically layered, capital intensive, politically contested, materially demanding, and deeply interdependent with other infrastructures. They must continue operating while they change. Reliability, affordability, decarbonization, resilience, security, and justice must be managed together rather than sequentially.
A strong energy-system analysis therefore begins with five commitments: define the boundary, trace the flows, identify the institutions, measure the consequences, and make assumptions visible. From that foundation, later articles in this series can examine energy and power, thermodynamics, energy accounting, grids, storage, fuels, markets, justice, materials, and digital systems without losing sight of the architecture that connects them.
Related Articles
- Energy, Power, and Work
- Energy and Thermodynamics
- Primary, Secondary, and Final Energy
- Energy Flows and Sankey Diagrams
- Energy Return on Investment
- Energy Systems Thinking
- Electricity Grids
- Energy Storage Systems
Further Reading
- International Energy Agency. Energy balances, energy statistics, and global energy-system analysis.
- Intergovernmental Panel on Climate Change. Climate Change 2022: Mitigation of Climate Change, Chapter 6, Energy Systems.
- Smil, Vaclav. Energy and Civilization: A History. A long-term account of energy conversion and social development.
- MacKay, David J.C. Sustainable Energy—without the Hot Air. A quantitative introduction to energy scale and physical feasibility.
- Grubler, Arnulf. Technology and Global Change. A systems account of technological evolution, infrastructure, and transition.
- Hughes, Thomas P. Networks of Power. A history of electrification as a large technical system.
- National Academies. Publications on energy-system transformation, grid modernization, resilience, and decarbonization.
- International Renewable Energy Agency. Publications on renewable-energy systems, transition pathways, costs, and enabling infrastructure.
References
- Grubler, A. (1998). Technology and Global Change. Cambridge: Cambridge University Press.
- Hughes, T.P. (1983). Networks of Power: Electrification in Western Society, 1880–1930. Baltimore: Johns Hopkins University Press.
- International Energy Agency (2017). “Understanding and Using the Energy Balance.” Available at: International Energy Agency.
- International Energy Agency. “Glossary.” Available at: IEA Glossary.
- Intergovernmental Panel on Climate Change (2022). “Chapter 6: Energy Systems.” In Climate Change 2022: Mitigation of Climate Change. Available at: IPCC AR6 Working Group III.
- MacKay, D.J.C. (2009). Sustainable Energy—without the Hot Air. Cambridge: UIT Cambridge.
- Smil, V. (2017). Energy and Civilization: A History. Cambridge, MA: MIT Press.
- Smil, V. (2022). How the World Really Works: The Science Behind How We Got Here and Where We’re Going. New York: Viking.
- U.S. Energy Information Administration. “What Is Energy?” Available at: EIA Energy Explained.
- U.S. Energy Information Administration. “Energy Conversion Calculators.” Available at: EIA Energy Explained.
- United Nations Development Programme. Publications on energy access, affordability, development, and just transition.
- World Bank. Publications and indicators on energy access, infrastructure, utility performance, and development.