
Last Updated August 6, 2026
Energy systems do not only deliver energy. They also consume energy in order to exist. Mines require diesel and electricity. Oil and gas fields require drilling, pumping, compression, processing, and transport. Power plants require construction materials, maintenance, auxiliary loads, fuel preparation, cooling, and decommissioning. Solar modules, wind turbines, batteries, transmission lines, pipelines, refineries, nuclear plants, hydrogen systems, and district-energy networks all embody energy in equipment, materials, construction, replacement, and supporting infrastructure.
Energy Return on Investment, commonly abbreviated EROI or EROEI, asks a deceptively simple question: how much usable energy does an energy system deliver for each unit of energy society must invest to obtain that energy?
The ratio matters because gross energy supply and net energy supply are not the same thing. A system can produce a large quantity of energy while consuming an increasing share of that output internally. If the energy required to extract, convert, maintain, and deliver energy rises, less net energy remains available for households, industry, transportation, health care, education, communications, public institutions, and the rest of the economy.
EROI therefore adds another layer to energy accounting. The previous articles in this series distinguished energy from power, examined thermodynamic limits, traced primary and final energy, and mapped flows through Sankey diagrams. EROI asks how much of those flows must be reinvested into the energy system itself and how much remains available as a net contribution to society.
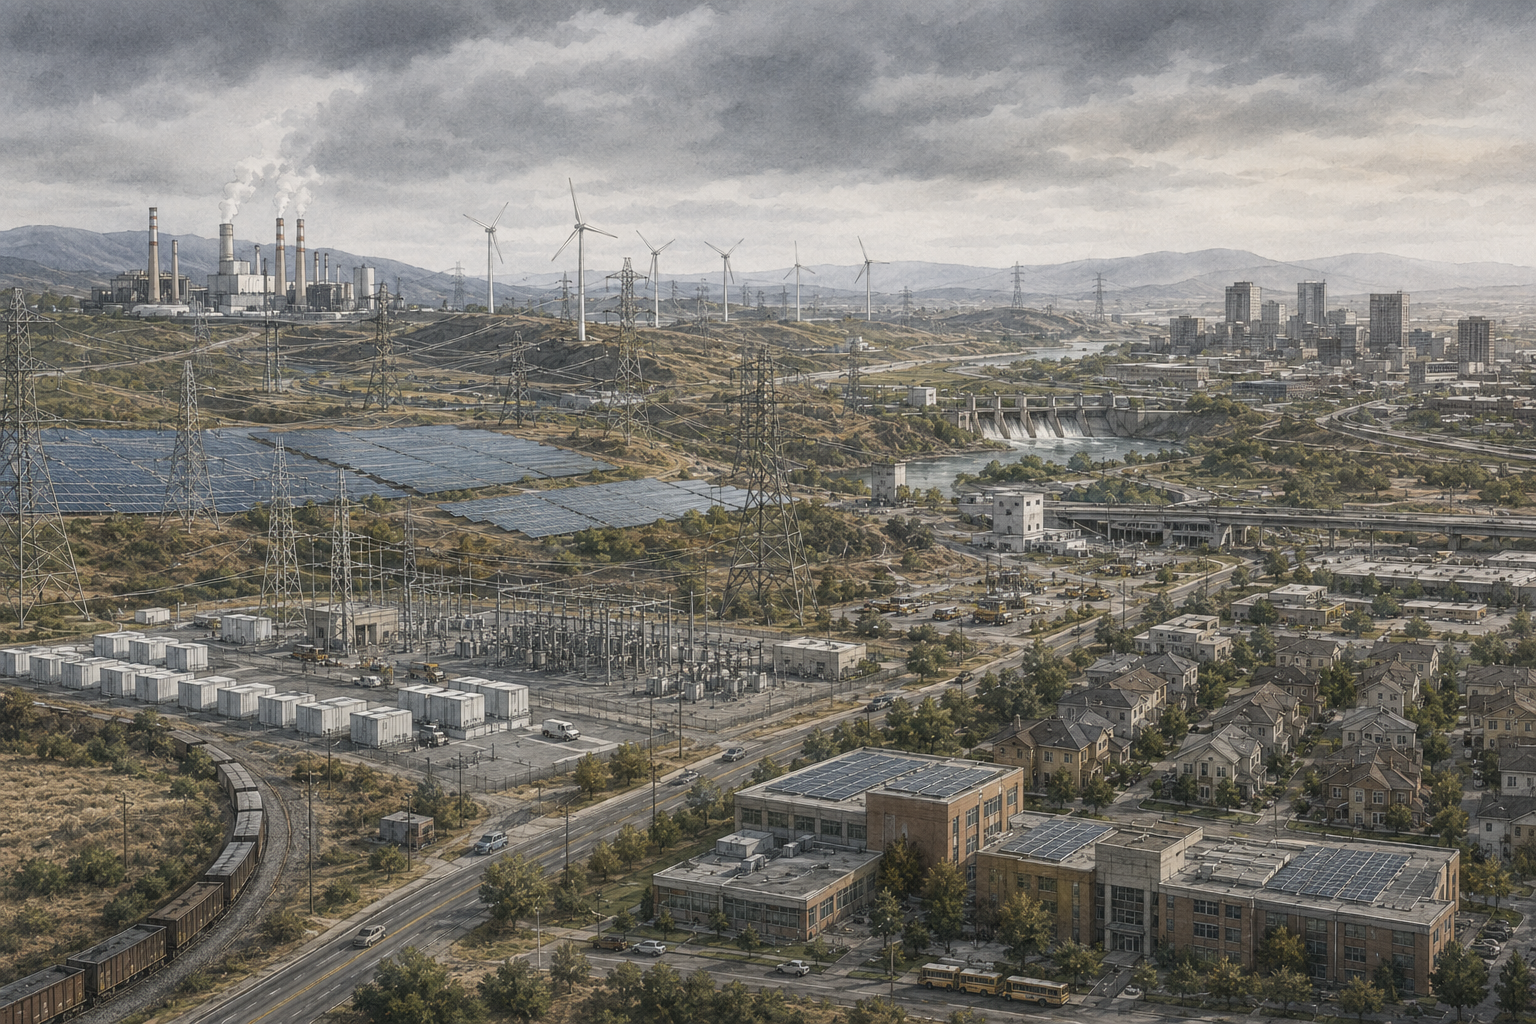
EROI is useful because it makes the internal energetic cost of an energy system visible. But it is also easy to misuse. The numerical value depends strongly on system boundaries, time horizon, energy quality, treatment of storage, inclusion of infrastructure, co-products, technological learning, resource quality, geographic conditions, and whether the output is measured as primary energy, final energy, electricity, heat, or another carrier.
A defensible EROI analysis therefore requires more than dividing one number by another. It requires explicit boundaries, compatible units, documented assumptions, and a clear statement of what question the ratio is intended to answer.
What EROI Measures
EROI compares energy obtained from an energy-producing system with the energy required to make that output available. The concept is related to economic return on investment, but the numerator and denominator are physical energy quantities rather than money.
An oil field, for example, may produce crude oil with a certain chemical energy content. Producing that oil requires drilling, pumps, pressure support, water handling, separation, processing, transport, and equipment. An EROI calculation compares the energy contained in the delivered oil with the energy consumed in those supporting activities.
For a wind farm, the output may be electricity generated over the installation’s lifetime. The energy investment may include steel, concrete, fiberglass, copper, manufacturing, transport, installation, maintenance, replacement components, grid connection, and decommissioning. Unlike a fossil system, there is no fuel input during operation, but substantial energy is embodied in the infrastructure.
EROI is therefore best understood as an energy-surplus indicator. It asks how much energy remains after society pays the energetic cost of obtaining energy.
A high EROI means a relatively small share of gross output must be reinvested in obtaining energy. A low EROI means the energy sector must absorb a larger share of its own production.
The Basic EROI Equation
The basic expression is:
\mathrm{EROI}=\frac{E_{\mathrm{return}}}{E_{\mathrm{invested}}}
\]
Interpretation: \(E_{\mathrm{return}}\) is the energy delivered by the system within the chosen boundary, while \(E_{\mathrm{invested}}\) is the energy required to create and sustain that delivery.
Suppose an energy project delivers 1,000 units of energy over its analyzed lifetime and requires 100 units of energy to build, operate, maintain, and retire. Its EROI is:
\mathrm{EROI}=\frac{1000}{100}=10
\]
The project returns ten units of energy for every one unit of energy invested.
EROI is dimensionless when the numerator and denominator use the same energy unit and compatible energy quality. It can be expressed as 10, 10:1, or “ten to one.”
The ratio alone does not reveal project size. A small project and a continental energy system can have the same EROI while delivering vastly different amounts of net energy. EROI should therefore be interpreted alongside absolute energy output, capacity, timing, reliability, emissions, land, materials, and cost.
Net Energy and the Energy Surplus
The central value behind EROI is net energy:
E_{\mathrm{net}}=E_{\mathrm{return}}-E_{\mathrm{invested}}
\]
Net energy is the portion of gross energy return remaining after the energetic cost of obtaining that energy has been paid.
The fraction of gross output remaining as net energy can be written:
f_{\mathrm{net}}=
\frac{E_{\mathrm{net}}}{E_{\mathrm{return}}}
=1-\frac{1}{\mathrm{EROI}}
\]
This relationship shows why falling EROI becomes increasingly consequential at low values.
| EROI | Energy invested per 100 units returned | Net energy per 100 units returned | Net-energy fraction |
|---|---|---|---|
| 50 | 2 | 98 | 98% |
| 20 | 5 | 95 | 95% |
| 10 | 10 | 90 | 90% |
| 5 | 20 | 80 | 80% |
| 3 | 33.3 | 66.7 | 66.7% |
| 2 | 50 | 50 | 50% |
| 1.5 | 66.7 | 33.3 | 33.3% |
| 1 | 100 | 0 | 0% |
At an EROI of 50, only 2 percent of gross output must be reinvested. At an EROI of 5, the reinvestment requirement rises to 20 percent. At 2, half of all gross output is consumed in obtaining the energy itself.
The relationship is nonlinear. Falling from 50 to 20 reduces the net-energy fraction only slightly. Falling from 5 to 2 has a much larger effect on the energy available to the rest of society.
Gross Energy Is Not Net Energy
Energy statistics often report gross production: barrels of oil, tonnes of coal, cubic meters of gas, terawatt-hours of electricity, petajoules of heat, or equivalent totals. Those quantities are necessary, but they do not reveal how much energy the energy sector consumed in order to produce them.
Consider two hypothetical energy systems that each deliver 1,000 petajoules of gross energy.
- System A has an EROI of 20 and requires 50 petajoules of energy investment, leaving 950 petajoules net.
- System B has an EROI of 5 and requires 200 petajoules of energy investment, leaving 800 petajoules net.
Gross production is identical, but the second system leaves 150 fewer petajoules available to the rest of society.
This distinction becomes especially important during transition. A rapidly expanding energy system may need large upfront energy investments in manufacturing, mines, factories, transmission, storage, grid upgrades, and construction before new infrastructure delivers its full lifetime output. Gross generation may eventually rise, but the transition phase can temporarily increase the energy sector’s own demand.
Net-energy analysis helps reveal this temporal burden.
System Boundaries Determine the Result
There is no meaningful EROI number without a system boundary.
An analysis that counts only fuel burned at a wellhead compressor will produce a different result from one that includes drilling, steel production, roads, processing, pipelines, refinery operations, labor-support infrastructure, and decommissioning.
Likewise, a solar EROI that includes module manufacturing but excludes transmission, storage, curtailment, and replacement inverters cannot be directly compared with a fossil-fuel EROI calculated at the point of final electricity delivery.
A defensible boundary should identify:
- the physical asset or energy system being evaluated;
- the geographic scope;
- the time horizon;
- the energy-output stage;
- direct operational inputs;
- indirect embodied inputs;
- fuel-cycle inputs;
- transmission and distribution;
- storage and balancing;
- supporting infrastructure;
- replacement and maintenance;
- decommissioning and recycling;
- co-products and allocation rules.
The boundary should be chosen to answer a specific question. There is no single boundary appropriate for every comparison.
Boundary Levels and EROI Variants
EROI studies sometimes distinguish several nested boundaries.
| Boundary | Typical inclusions | Question answered |
|---|---|---|
| Point-of-extraction EROI | Direct energy used to extract a fuel or resource | How energetically demanding is extraction itself? |
| Plant-gate EROI | Extraction plus processing or generation | How much energy is returned by the producing facility? |
| Lifecycle EROI | Construction, operation, maintenance, fuel cycle, replacement, and retirement | What is the full asset-level energetic return? |
| Delivered EROI | Lifecycle system plus transmission, distribution, storage, or delivery | How much usable carrier reaches the consumer boundary? |
| Extended EROI | Broader supporting infrastructure and selected indirect requirements | What is the wider energetic burden of maintaining the system? |
These are not interchangeable. A point-of-extraction EROI is usually higher than a delivered EROI because each expanded boundary adds energy requirements.
The correct practice is to report the boundary with the number. “EROI = 12” is incomplete. “Lifecycle electricity EROI = 12 under a boundary that includes construction, operations, maintenance, replacement, and decommissioning but excludes grid storage” is much more informative.
Direct and Indirect Energy Inputs
Energy investments can be divided into direct and indirect inputs.
Direct inputs are consumed by the energy-producing process itself. Examples include:
- diesel used by mining equipment;
- electricity for pumps and compressors;
- natural gas used in processing;
- auxiliary electricity consumed by a power plant;
- fuel used by maintenance vehicles;
- heat used in refining or upgrading.
Indirect inputs are embodied in equipment, materials, construction, and supporting supply chains:
- steel and concrete;
- copper and aluminum;
- solar-grade silicon;
- battery materials;
- drilling rigs and turbines;
- roads, ports, foundations, and substations;
- manufacturing plants;
- replacement equipment.
Indirect energy is more difficult to measure because it is distributed across supply chains. Lifecycle assessment, process analysis, environmentally extended input-output analysis, or hybrid methods can estimate these burdens.
The chosen method can materially change the denominator and therefore the reported EROI.
Lifecycle Energy Investment
A lifecycle EROI denominator can be decomposed as:
E_{\mathrm{invested}}
=
E_{\mathrm{materials}}
+
E_{\mathrm{manufacturing}}
+
E_{\mathrm{construction}}
+
E_{\mathrm{fuel\ cycle}}
+
E_{\mathrm{operation}}
+
E_{\mathrm{maintenance}}
+
E_{\mathrm{replacement}}
+
E_{\mathrm{decommissioning}}
\]
The exact categories depend on the technology, boundary, and purpose of the analysis.
For a wind farm, fuel-cycle energy is near zero after construction, but materials and manufacturing may dominate. For a gas plant, construction energy may be relatively modest compared with the lifetime energy invested in extracting, processing, and transporting fuel. For a nuclear plant, construction, uranium fuel-cycle activities, operations, maintenance, and decommissioning all contribute. For batteries, manufacturing and replacement can be important, especially when storage is treated as part of the delivery system rather than as an independent energy source.
Lifecycle treatment also makes lifetime assumptions important. Extending asset life spreads fixed embodied energy over more output, increasing EROI if performance remains adequate. Early retirement can reduce realized EROI because some embodied energy is never recovered through full expected output.
Energy Quality and Carrier Differences
Not all joules have the same practical usefulness.
Electricity is a highly controllable carrier that can produce mechanical work, heat, light, electrochemical reactions, computation, and many other services. Low-temperature heat is less flexible. Chemical fuels provide dense stored energy and can be valuable for transport or high-temperature processes.
An EROI ratio expressed only in joules can hide these differences.
If a system consumes one unit of electricity to produce several units of low-temperature heat, the energy quantities are not equivalent in quality even though conservation still applies. Similarly, comparing crude oil at the wellhead with electricity at the grid connection mixes stages and carriers.
Analysts sometimes use exergy, quality-weighted energy, or consistent carrier boundaries to address this problem.
The safest practice is:
- keep numerator and denominator carriers explicit;
- avoid comparing different output stages without conversion rules;
- state whether energy is thermal, electrical, chemical, or mechanical;
- avoid treating quality-adjusted and unadjusted EROI values as equivalent.
EROI is most interpretable when output and input energy are measured on a consistent basis.
EROI in Fossil-Fuel Systems
Fossil-fuel EROI is strongly influenced by resource quality and extraction difficulty.
Early development of a large, shallow, high-pressure oil field may require relatively little energy per barrel. As pressure falls, water production rises, wells deepen, enhanced recovery expands, and heavier or more sulfur-rich resources are developed, energetic requirements can increase.
Coal systems vary by seam thickness, depth, stripping ratio, mine type, transport distance, preparation requirements, and pollution-control systems.
Natural-gas systems vary by reservoir pressure, well productivity, gas composition, compression, water handling, processing, gathering networks, liquefaction, and transport distance.
The general relationship is:
\mathrm{EROI}_{\mathrm{fuel}}
=
\frac{\text{energy content of delivered fuel}}
{\text{energy used in extraction, processing, and delivery}}
\]
Declining resource quality does not mean production must immediately stop. Higher prices, better technology, improved drilling, larger infrastructure, and external energy inputs may keep production profitable. But the net-energy contribution can still decline even while monetary profitability remains positive.
This distinction is one reason financial analysis and EROI should be used together rather than treated as substitutes.
EROI in Renewable-Energy Systems
Renewable-energy EROI differs structurally from fossil-fuel EROI because most renewable systems do not continuously consume an extracted fuel.
Wind, solar, hydropower, geothermal, and marine-energy systems typically require significant energy upfront for infrastructure and then return energy over years or decades. Maintenance, component replacement, and network integration add ongoing inputs, but there is no continuous combustion-fuel requirement for wind or solar generation.
For a renewable generator:
\mathrm{EROI}
=
\frac{\sum_{t=1}^{T} E_{\mathrm{output},t}}
{E_{\mathrm{construction}}
+\sum_{t=1}^{T} E_{\mathrm{operation},t}
+E_{\mathrm{replacement}}
+E_{\mathrm{retirement}}}
\]
Key assumptions include:
- capacity factor or resource quality;
- equipment lifetime;
- degradation;
- manufacturing energy intensity;
- material supply chains;
- curtailment;
- replacement rates;
- grid connection;
- whether storage and balancing are included.
A solar installation in a high-irradiance region can return more lifetime energy than the same equipment in a low-irradiance region. Wind EROI depends heavily on wind resource, turbine performance, availability, and infrastructure. Technological learning can improve EROI by reducing material intensity, increasing conversion efficiency, extending lifetime, and improving capacity factors.
Nuclear, Hydropower, and Geothermal
Nuclear, hydropower, and geothermal systems illustrate why category labels alone do not determine EROI.
For nuclear power, results depend on plant lifetime, capacity factor, construction requirements, uranium grade, enrichment technology, fuel fabrication, waste management, and decommissioning. Long lifetimes and high utilization can spread large upfront construction inputs across very large electricity output.
Hydropower can have substantial embodied energy in dams, tunnels, concrete, steel, roads, and transmission. But long asset life and high annual output can create a large lifetime energy return where hydrological conditions remain favorable. Sedimentation, drought, rehabilitation, and ecological constraints may change performance over time.
Geothermal systems depend on reservoir temperature, drilling depth, fluid chemistry, pumping requirements, reinjection, well replacement, and whether the resource supports electricity generation or direct heat. Enhanced geothermal systems may involve more drilling and stimulation energy than conventional hydrothermal resources but could access a much larger resource base.
EROI should therefore be estimated from the actual technology-resource system, not assigned from a technology label.
Storage, Integration, and Delivered EROI
Storage does not create primary energy. It shifts energy through time and inevitably consumes some energy in charging, standby, and discharge losses.
When storage is required to deliver an energy service, its energetic cost can be included in a broader delivered EROI.
Suppose a renewable generator has lifecycle output \(E_g\) and lifecycle energy investment \(I_g\). A storage system has embodied and operational energy investment \(I_s\), and only a fraction \(\eta_s\) of the energy sent through storage is returned.
A simplified delivered-energy expression is:
E_{\mathrm{delivered}}
=
E_{\mathrm{direct}}
+
\eta_s E_{\mathrm{stored}}
\]
and:
\mathrm{EROI}_{\mathrm{delivered}}
=
\frac{E_{\mathrm{delivered}}}
{I_g+I_s}
\]
This result depends on how much generation passes through storage. A system where only 10 percent of annual energy is stored will have a different integration burden from one where 70 percent passes through storage.
Storage duration also matters. Short-duration batteries, pumped storage, thermal storage, compressed air, hydrogen, and seasonal storage have different efficiencies, material requirements, lifetimes, and infrastructure needs.
The correct question is not “What is the EROI of storage?” in isolation, because storage is usually an energy-consuming intermediary. The useful question is how storage changes the EROI of delivered energy services.
Transmission, Networks, and Supporting Infrastructure
Generation and extraction systems do not operate in isolation. Energy must move through networks.
Electricity systems require transmission lines, substations, transformers, distribution feeders, protection equipment, control systems, balancing resources, and system operators. Fuel systems require pipelines, ships, railroads, storage terminals, pumping stations, refineries, compressors, and retail distribution.
A plant-level EROI excludes much of this supporting infrastructure. A delivered EROI may include it.
Network inclusion is especially important when comparing centralized and distributed systems. A remote wind resource may have excellent turbine-level EROI but require long transmission. Distributed solar may reduce some network flows while requiring distribution upgrades, inverters, controls, and local storage.
Infrastructure burdens should be allocated carefully. A transmission line may serve many generators and loads over decades. Assigning all embodied energy to one project would be misleading.
Common allocation bases include:
- energy throughput;
- capacity contribution;
- incremental causation;
- shared-system allocation;
- scenario-based marginal expansion.
The method should be documented because it affects the denominator.
Resource Quality and Depletion
Resource quality influences how much energy must be invested to obtain energy.
For extractive resources, declining quality can appear as:
- greater mining depth;
- lower ore or fuel grade;
- higher water production;
- lower reservoir pressure;
- greater stripping ratios;
- longer transport distances;
- more intensive processing;
- increasing contamination or impurities.
For renewable resources, quality can refer to:
- solar irradiance;
- wind speed distribution;
- hydraulic head and flow;
- geothermal temperature and permeability;
- distance from demand;
- siting constraints;
- seasonal variability.
As high-quality sites are developed first, expansion may move toward lower-quality or more distant resources. This can raise energy investment per delivered unit.
However, technological learning can move in the opposite direction. Better turbines, drilling, materials, automation, manufacturing, power electronics, and system design can reduce energetic requirements.
EROI trends therefore reflect both depletion and innovation.
Technology Learning and EROI Improvement
Technology can improve EROI by increasing the numerator, reducing the denominator, or both.
Examples include:
- higher-capacity-factor wind turbines;
- more efficient photovoltaic cells;
- thinner wafers and lower material intensity;
- more efficient electric motors and inverters;
- longer equipment lifetimes;
- predictive maintenance that reduces downtime;
- better drilling and reservoir characterization;
- lower-energy material manufacturing;
- recycling that displaces primary material production;
- co-location that reduces network requirements.
An important systems effect is that manufacturing energy itself can decarbonize and become more efficient. If the steel, cement, aluminum, silicon, and battery supply chains supporting new energy infrastructure use less energy per unit of material, embodied-energy requirements decline.
EROI is therefore not fixed. It is a dynamic characteristic of a technology-resource-supply-chain configuration at a particular time and place.
Scale, Timing, and Energy-Payback Period
EROI is a lifetime ratio, but energy systems operate through time.
A project often consumes substantial energy before it returns any energy. This creates an energy-payback period:
T_{\mathrm{payback}}
=
\frac{E_{\mathrm{upfront}}}
{E_{\mathrm{annual\ net\ output}}}
\]
If a solar system requires 2,000 MWh-equivalent of embodied energy and returns 500 MWh of net electricity-equivalent per year, the simple payback is four years.
Energy payback is related to EROI but not identical. Two projects can have the same lifetime EROI and different payback periods if their output timing differs.
Timing becomes especially important during rapid transition. Building large amounts of new infrastructure requires upfront energy while the old energy system must continue operating. A transition can therefore temporarily increase gross energy demand even when the new system eventually reduces operating losses.
The faster the build-out, the greater the near-term energy investment rate may be.
Economy-Wide Net Energy
EROI becomes especially consequential when viewed across the entire energy sector.
Let:
- \(G\) = gross energy supplied by the energy sector;
- \(I\) = energy reinvested in producing and delivering energy;
- \(N\) = net energy available to the rest of society.
Then:
N=G-I
\]
If the aggregate energy-sector EROI is:
\mathrm{EROI}_{\mathrm{system}}=\frac{G}{I}
\]
then:
N=G\left(1-\frac{1}{\mathrm{EROI}_{\mathrm{system}}}\right)
\]
This relationship shows why a society may need more gross energy infrastructure to maintain the same net energy if aggregate EROI declines.
But an economy is not determined by EROI alone. Energy efficiency, electrification, technology, urban form, industrial structure, service demand, trade, and digitalization all influence how much energy is required to provide social and economic outcomes.
A lower-EROI energy system can still support high welfare if end-use systems use energy more efficiently and institutions allocate resources effectively. Conversely, high gross energy availability does not guarantee equitable access or public value.
EROI and Financial Cost Are Different
Energy return and financial return are related but distinct.
A project can have a high EROI and poor financial performance because of:
- high capital cost;
- low market prices;
- financing terms;
- taxes and regulation;
- construction delay;
- market congestion;
- revenue volatility.
A project can also have a relatively low EROI and remain profitable if the output is financially valuable, input energy is inexpensive, externalities are unpriced, or subsidies reduce private costs.
Money can also move across sectors in ways energy cannot. A government can finance a project by issuing debt, but the physical project still requires steel, concrete, equipment, labor, electricity, fuels, and transport.
EROI therefore describes a physical constraint that financial accounting does not eliminate.
Useful project evaluation should include both:
| Energetic analysis | Financial analysis |
|---|---|
| Energy returned | Revenue |
| Energy invested | Capital and operating cost |
| Net energy | Cash flow |
| EROI | ROI / IRR / NPV |
| Physical system boundary | Accounting and ownership boundary |
Neither substitutes for the other.
EROI and Emissions Are Different
A high EROI does not imply low greenhouse-gas emissions.
A fossil resource can return far more energy than is required to extract it while still releasing substantial carbon dioxide when the fuel is combusted. Conversely, a lower-EROI low-carbon system may reduce climate impacts if its lifecycle emissions are low.
EROI measures energetic surplus. Lifecycle greenhouse-gas analysis measures emissions per unit of output. The metrics answer different questions.
A robust energy-system comparison should often report:
- EROI;
- net energy;
- lifecycle greenhouse-gas emissions;
- air pollution;
- land and water requirements;
- material intensity;
- reliability and flexibility;
- financial cost;
- distributional impacts.
High EROI is not a sustainability certificate. It is one dimension of system performance.
EROI, Reliability, and Resilience
EROI is usually calculated as an energy quantity over a period. Reliability is a time-sensitive ability to meet demand. Resilience is the ability to withstand, adapt to, and recover from disturbance.
These metrics can interact but are not equivalent.
A high-EROI generator may be unavailable during extreme weather, dependent on a vulnerable fuel supply, or far from critical loads. A lower-EROI local microgrid may provide unusually high public value during outages. Strategic fuel storage may consume energy and reduce a simple EROI measure while increasing security. Redundant transmission can add embodied energy but improve system resilience.
This creates an important distinction:
An energy system should not be optimized for EROI alone.
Some energetic “inefficiency” may be justified by redundancy, reserve margins, storage, diversity, emergency capability, cybersecurity, islanding, or public-service obligations.
The question is whether the additional energetic investment creates enough reliability, resilience, flexibility, or public value to justify the burden.
Is There a Minimum EROI?
It is tempting to ask for a universal minimum EROI required for civilization or economic growth. The idea is intuitive: if too much energy must be reinvested in the energy sector, insufficient net energy remains for everything else.
But a single universal threshold is difficult to defend.
The required surplus depends on:
- energy efficiency of the economy;
- end-use electrification;
- industrial structure;
- transport patterns;
- climate and building performance;
- trade;
- technology;
- public-service requirements;
- income distribution;
- institutional capacity.
A society that delivers mobility, heat, industry, and communication with very high end-use efficiency may require less gross energy than one with wasteful infrastructure.
The more defensible statement is that lower aggregate EROI increases the share of economic and physical resources devoted to the energy sector. At sufficiently low EROI, maintaining a large net-energy surplus becomes increasingly difficult.
Rather than searching for one threshold, analysts should model the actual energy-sector reinvestment share required under specific scenarios.
Worked Examples
Example 1: Basic EROI and Net Energy
A project delivers 2,400 GWh over its lifetime and requires 180 GWh-equivalent of lifecycle energy investment.
\mathrm{EROI}=\frac{2400}{180}=13.33
\]
Net energy is:
E_{\mathrm{net}}=2400-180=2220\ \mathrm{GWh}
\]
The project returns about 13.3 units of energy for each unit invested and leaves 92.5 percent of gross output as net energy.
Example 2: Two Systems with Equal Gross Output
System A and System B each return 10,000 TJ.
System A has EROI = 20:
E_{\mathrm{invested,A}}=\frac{10000}{20}=500\ \mathrm{TJ}
\]
System B has EROI = 5:
E_{\mathrm{invested,B}}=\frac{10000}{5}=2000\ \mathrm{TJ}
\]
System A leaves 9,500 TJ net; System B leaves 8,000 TJ net.
The same gross supply produces a 1,500 TJ difference in net energy.
Example 3: Including Storage
A renewable project produces 1,000 GWh. Seventy percent goes directly to load. Thirty percent passes through storage with 85 percent round-trip efficiency.
Delivered output is:
E_{\mathrm{delivered}}
=
700+(300)(0.85)
=
955\ \mathrm{GWh}
\]
If generation requires 70 GWh-equivalent of lifecycle energy investment and storage requires 15 GWh-equivalent:
\mathrm{EROI}_{\mathrm{delivered}}
=
\frac{955}{70+15}
=
11.24
\]
Without storage, the plant-level value would appear higher. The delivered-system boundary reveals the integration burden.
Example 4: Declining Resource Quality
An oil-producing region initially returns 100 PJ of fuel using 5 PJ of energy inputs:
\mathrm{EROI}_{1}=\frac{100}{5}=20
\]
Years later, production remains 100 PJ but extraction, pumping, water handling, and processing require 12 PJ:
\mathrm{EROI}_{2}=\frac{100}{12}=8.33
\]
Gross production is unchanged, but the net contribution falls from 95 PJ to 88 PJ.
Example 5: Energy Payback
A wind project requires 1,500 MWh-equivalent of upfront embodied energy. It generates 600 MWh per year and requires 30 MWh-equivalent per year for operations and maintenance.
Annual net return is:
E_{\mathrm{annual,net}}=600-30=570\ \mathrm{MWh}
\]
Simple energy payback is:
T_{\mathrm{payback}}=\frac{1500}{570}=2.63\ \mathrm{years}
\]
If the project operates for 25 years, its lifetime output and EROI must still account for all lifetime maintenance, replacements, degradation, and retirement.
Common Misconceptions
Misconception 1: EROI is the same as efficiency.
It is not. Efficiency compares energy output from a conversion process with energy input to that process. EROI compares useful energy returned by an energy-producing system with the energy invested in creating and sustaining that system.
Misconception 2: An EROI below 100 percent means the same thing as efficiency below 100 percent.
EROI is usually expressed as a ratio greater than one. A value of 10 means ten units returned per unit invested. Conversion efficiency cannot exceed unity in an ordinary energy balance, while EROI can be much greater than one because the system accesses an external energy resource.
Misconception 3: High EROI means low cost.
Financial cost depends on capital, labor, materials, financing, policy, taxes, market structure, and risk. EROI measures physical energy surplus.
Misconception 4: High EROI means low emissions.
A fuel can have high energetic return and high carbon emissions.
Misconception 5: EROI values can be compared without checking boundaries.
Plant-gate, lifecycle, delivered, and extended EROI values are not directly comparable unless their boundaries are harmonized.
Misconception 6: Storage has an independent energy return like a primary resource.
Storage shifts energy. Its energetic value should generally be evaluated as part of the system that uses it.
Misconception 7: One EROI number describes a technology forever.
Resource quality, manufacturing, capacity factor, lifetime, supply chains, integration, and technology change over time and geography.
Python Workflow: EROI and Net-Energy Analysis
A reproducible EROI workflow should keep energy outputs, lifecycle investments, boundaries, and uncertainty explicit.
from dataclasses import dataclass

@dataclass
class EnergySystem:
    name: str
    lifetime_output_mwh: float
    construction_mwh: float
    operations_mwh: float
    maintenance_mwh: float
    replacement_mwh: float
    retirement_mwh: float

    @property
    def invested_mwh(self):
        return (
            self.construction_mwh
            + self.operations_mwh
            + self.maintenance_mwh
            + self.replacement_mwh
            + self.retirement_mwh
        )

    @property
    def eroi(self):
        return self.lifetime_output_mwh / self.invested_mwh

    @property
    def net_energy_mwh(self):
        return self.lifetime_output_mwh - self.invested_mwh

system = EnergySystem(
    name="Example renewable project",
    lifetime_output_mwh=2_400_000,
    construction_mwh=95_000,
    operations_mwh=24_000,
    maintenance_mwh=28_000,
    replacement_mwh=18_000,
    retirement_mwh=10_000,
)

print(f"EROI: {system.eroi:.2f}")
print(f"Net energy: {system.net_energy_mwh:,.0f} MWh")
A more advanced workflow can add:
- year-by-year output and degradation;
- capacity-factor uncertainty;
- fuel-cycle inputs;
- storage and transmission burdens;
- energy-quality weighting;
- scenario-specific asset lifetime;
- Monte Carlo uncertainty;
- sensitivity to system boundaries.
The most important implementation rule is to avoid hiding boundary assumptions inside constants. Each energy input should have a category and source.
R Workflow: Comparing Energy Pathways
R can compare EROI and net-energy fractions across hypothetical pathways.
systems <- data.frame(
  system = c("System A", "System B", "System C", "System D"),
  output = c(1000, 1000, 1000, 1000),
  invested = c(25, 50, 100, 250)
)

systems$eroi <- systems$output / systems$invested
systems$net_energy <- systems$output - systems$invested
systems$net_fraction <- systems$net_energy / systems$output

print(systems)

# Compare sensitivity to additional delivery-system inputs.
systems$delivery_input <- c(20, 20, 20, 20)
systems$delivered_eroi <-
  systems$output /
  (systems$invested + systems$delivery_input)

print(systems[, c(
  "system",
  "eroi",
  "net_fraction",
  "delivered_eroi"
)])
This simple example shows that adding a common network or delivery burden changes low- and high-EROI systems differently in proportional terms.
A publication-grade workflow should store:
- technology and site;
- output carrier;
- energy-investment category;
- time period;
- geographic boundary;
- source dataset;
- uncertainty range;
- allocation method;
- boundary level.
GitHub Repository
Complete Code Repository
The full Energy Systems repository contains reproducible article workflows, EROI and net-energy calculations, lifecycle energy-accounting examples, boundary analysis, scenario modeling, uncertainty methods, datasets, documentation, and multi-language computational assets.
A Practical EROI Assessment Method
A rigorous EROI study can follow a repeatable sequence:
- Define the decision. State whether the study evaluates extraction, generation, delivered energy, transition strategy, or economy-wide net energy.
- Define the output. Specify whether the numerator is crude fuel, refined fuel, electricity, heat, hydrogen, final energy, or useful energy.
- Choose the boundary. Identify extraction, construction, operation, fuel cycle, networks, storage, replacements, and retirement.
- Set the time horizon. Use expected asset life, project life, field life, or an explicit analysis period.
- Inventory direct inputs. Measure fuels, electricity, heat, pumping, compression, and auxiliary loads.
- Inventory embodied inputs. Estimate energy in materials, manufacturing, transport, construction, and equipment.
- Handle co-products. Apply a transparent allocation rule when one process produces multiple energy products.
- Account for degradation. Model output decline, maintenance, well depletion, module degradation, sedimentation, or reservoir behavior.
- Add delivery burdens where relevant. Include transmission, pipelines, storage, or distribution if the comparison is made at the delivered-energy boundary.
- Calculate gross return and investment. Keep components visible rather than only reporting the final ratio.
- Calculate net energy. Report both absolute and fractional net energy.
- Test sensitivity. Vary lifetime, capacity factor, energy intensity, resource quality, storage share, and allocation assumptions.
- Quantify uncertainty. Report ranges or distributions rather than false precision.
- Compare consistent boundaries. Harmonize carrier, stage, geography, and lifecycle scope.
- Connect to other metrics. Report emissions, cost, reliability, materials, land, water, and social outcomes separately.
A good EROI result should be auditable. A reader should be able to reconstruct both numerator and denominator from the published inputs.
Policy, Equity, and Public Value
Net-energy analysis has important policy implications because the energy sector is foundational infrastructure. If obtaining energy requires increasing amounts of energy, capital, materials, land, water, and labor, those requirements compete with other social priorities.
But EROI should not become a shortcut for deciding which energy systems deserve investment.
Public value also includes:
- affordability;
- reliability;
- public health;
- climate stability;
- energy access;
- worker safety;
- community consent;
- regional development;
- resilience;
- ecological protection;
- democratic accountability.
A high-EROI resource that imposes severe pollution or climate damage may be inconsistent with long-term public purpose. A lower-EROI system may be justified if it delivers cleaner air, climate mitigation, resilience, or essential access.
Equity also changes how energy surplus should be interpreted. A national energy system may have abundant net energy while some households cannot afford heating or cooling. EROI describes physical surplus; it does not describe who controls, pays for, or benefits from that surplus.
Policy analysis should therefore combine energetic viability with institutions and distribution.
Limits, Uncertainty, and Responsible Interpretation
EROI is powerful because it highlights a fundamental physical truth: obtaining energy requires energy. Its weakness is that the ratio compresses many assumptions into one number.
Major uncertainties include:
- asset lifetime;
- capacity factor;
- resource quality;
- degradation;
- fuel-cycle energy;
- material energy intensity;
- recycling credit;
- co-product allocation;
- geographic supply chains;
- storage requirements;
- curtailment;
- network expansion;
- decommissioning;
- energy-quality weighting;
- future technology improvement.
Responsible reporting should publish a range where uncertainty is material.
For example:
\mathrm{EROI}=12.4\quad(9.1\text{ to }16.8\text{ under tested assumptions})
\]
is more informative than presenting 12.437 as if the third decimal place were measured.
Sensitivity analysis is equally important. If lifetime assumptions dominate the result, readers should know. If storage share drives the range, that should be visible. If the boundary excludes transmission, that exclusion should appear beside the number.
EROI is best treated as a structured accounting framework, not a ranking league table.
Why Net Energy Matters
Energy Return on Investment reveals a property that ordinary production statistics can hide: the energy system must consume part of its own output in order to produce, process, convert, transport, store, and maintain energy.
The ratio connects gross energy to net energy. When EROI is high, a relatively small share of output is reinvested. As EROI declines, the internal requirement rises and less energy remains available to the rest of society.
Yet the number is meaningful only when boundaries are explicit. Point-of-extraction, lifecycle, delivered, and extended EROI answer different questions. Technology, geography, resource quality, equipment lifetime, storage, networks, material production, and system design all influence the result.
EROI also does not replace financial cost, emissions, reliability, resilience, justice, or ecological analysis. An energy system can have high energetic return and poor environmental performance, or lower energetic return and high public value. The metric is most useful when integrated with a broader systems framework.
The central lesson is therefore not that one EROI value determines the future. It is that energy transitions must preserve adequate net energy while changing the technologies, infrastructures, institutions, and material systems that provide it.
That conclusion leads directly to the next article: Energy Systems Thinking, which examines feedback loops, delays, lock-in, rebound effects, tipping points, and interdependence across the wider energy system.
Related Articles
- What Are Energy Systems?
- Energy, Power, and Work
- Energy and Thermodynamics
- Primary, Secondary, and Final Energy
- Energy Flows and Sankey Diagrams
- Energy Systems Thinking
- Energy Efficiency
- Energy Transition
Further Reading
- Hall, Charles A. S. Research on energy return, net energy, and biophysical economics.
- Murphy, David J., and Charles A. S. Hall. Research on EROI methodology and energy transitions.
- Brandt, Adam R., and colleagues. Research on energy-return metrics, fossil-resource quality, and lifecycle energy analysis.
- Carbajales-Dale, Michael, Charles J. Barnhart, and Sally M. Benson. Research on energy-return dynamics for energy technologies.
- International Energy Agency. Energy-system statistics, technology analysis, and lifecycle context.
- U.S. Energy Information Administration. Energy production, consumption, and energy-intensity data.
- Intergovernmental Panel on Climate Change. Lifecycle emissions and energy-system transition literature.
References
- Hall, Charles A. S., Stephen Balogh, and David J. R. Murphy. “What Is the Minimum EROI That a Sustainable Society Must Have?” Energies.
- Murphy, David J., and Charles A. S. Hall. “Year in Review — EROI or Energy Return on (Energy) Invested.” Annals of the New York Academy of Sciences.
- Murphy, David J., Charles A. S. Hall, Michael Dale, and Cleveland Cutler. “Order from Chaos: A Preliminary Protocol for Determining the EROI of Fuels.” Sustainability.
- Brandt, Adam R., and Michael Dale. Research on net energy analysis and EROI boundaries.
- Carbajales-Dale, Michael, Charles J. Barnhart, and Sally M. Benson. Research on energy payback and dynamic energy returns from energy infrastructure.
- Intergovernmental Panel on Climate Change. Climate Change 2022: Mitigation of Climate Change. Available at: IPCC.
- International Energy Agency. Energy technology and energy-system analysis. Available at: IEA.
- U.S. Energy Information Administration. Energy Explained. Available at: EIA.