
Last Updated August 6, 2026
Energy does not move from nature to society in a single step. Coal must be mined and transported before it can be burned. Crude oil must be extracted, refined, and distributed before it becomes gasoline, diesel, jet fuel, or petrochemical feedstock. Sunlight, wind, flowing water, uranium, biomass, and geothermal heat enter energy systems through different infrastructures and conversion processes. Electricity, district heat, hydrogen, and refined fuels then move through networks and storage systems before they reach buildings, factories, vehicles, farms, and public services.
Because these pathways contain multiple stages, energy analysts distinguish among primary energy, secondary energy, and final energy. These categories are not different physical substances. They are positions within an accounting chain. Primary energy describes energy as it enters the human-controlled energy system from natural resources. Secondary energy describes carriers produced by transforming primary energy or another carrier. Final energy describes the energy delivered to the point of end use. Useful energy describes the portion converted into the form needed by the user, and energy services describe the outcomes people actually value: comfortable rooms, mobility, illumination, mechanical production, refrigeration, communication, and other capabilities.
The distinctions matter because the same social service can appear very different depending on where the accounting boundary is drawn. An electric motor may convert most of its final electricity into useful shaft work, but the electricity may have been produced through a thermal plant with substantial upstream losses. A heat pump may deliver several units of useful heat for each unit of final electricity because it moves environmental heat into a building. A rooftop solar system may reduce purchased final electricity without reducing the building’s energy service. A national energy balance may show a dramatic fall in primary energy during electrification even when useful services remain stable or increase.
This article explains how these stages are defined, how energy moves between them, why losses and own-use matter, how electricity and non-combustible renewables are treated, and how accounting conventions shape comparisons across technologies and transition pathways.
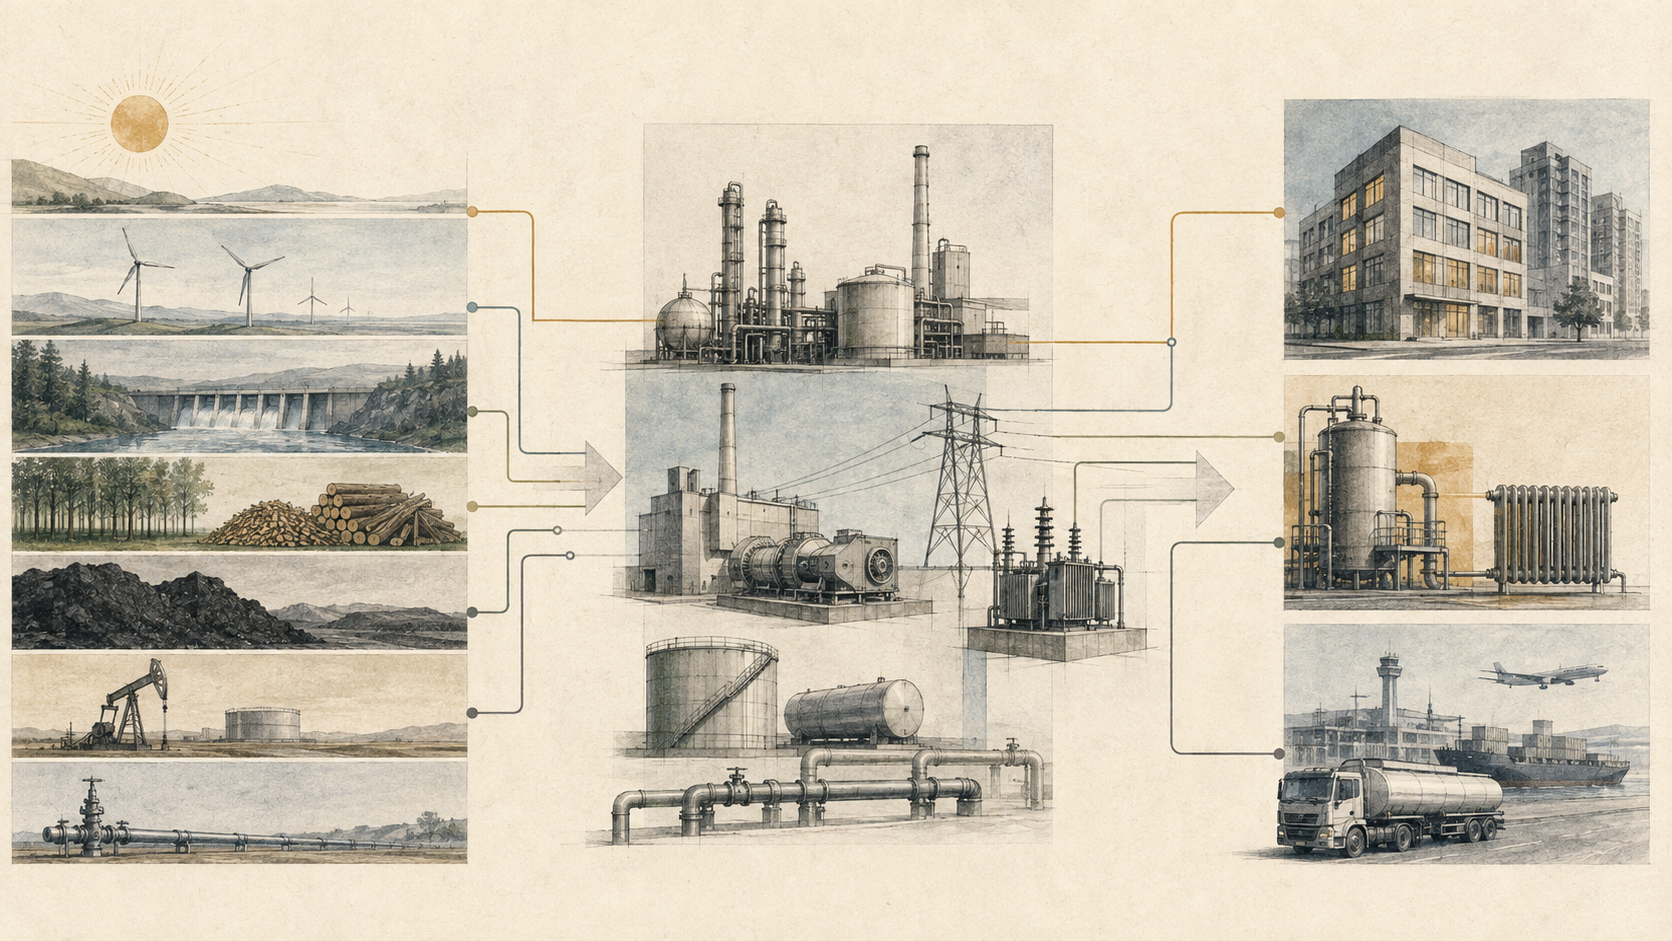
The language of primary, secondary, and final energy is used in national energy balances, climate models, utility planning, industrial analysis, building performance, transport studies, and lifecycle assessment. Yet the terms are often used inconsistently. Electricity may be called primary in one context and secondary in another. Renewable electricity may be counted by its physical output, by an assumed thermal equivalent, or by the fossil energy displaced. Building energy may be reported at the meter or converted to a source-energy basis. Hydrogen may be treated as a carrier, a feedstock, a storage medium, or a final fuel.
These differences do not mean energy accounting is arbitrary. They mean every result depends on explicit definitions, boundaries, and conventions. A good energy balance should allow a reader to reconstruct how resources became carriers, how carriers were transformed and distributed, where losses occurred, and what reached the user.
Why Energy Stages Matter
Energy-stage distinctions matter because energy systems transform resources before people receive useful services. Measuring only fuel extraction can conceal conversion efficiency and end-use performance. Measuring only energy sold to customers can conceal upstream resource requirements. Measuring only useful output can conceal the infrastructure, emissions, land, materials, and institutional arrangements required to provide it.
Consider three ways to heat a building:
- A gas boiler receives natural gas as final energy and converts part of its chemical energy into useful indoor heat.
- An electric resistance heater receives electricity as final energy and converts nearly all of it into heat at the point of use, although upstream electricity generation may involve losses.
- A heat pump receives electricity as final energy but also transfers environmental heat from outside the accounting boundary, delivering more useful heat than the electrical input alone.
All three can provide the same service, but their primary-energy requirements depend on conversion technologies, grid composition, weather, equipment performance, and accounting conventions. A comparison made only at the appliance may favor one result; a comparison made across the entire supply chain may favor another.
Energy stages also matter when interpreting transition. Replacing an internal-combustion vehicle with an electric vehicle can reduce final energy because electric drivetrains convert delivered energy into motion more efficiently. Replacing a fossil power plant with wind or solar can reduce reported primary energy under the physical-energy-content method because there is no counted thermal conversion loss. Expanding district heat may shift energy from individual building meters into a centralized conversion system. Improving industrial process integration may reduce primary and final energy while preserving production.
These changes are real, but they can be misunderstood if accounting categories are treated as interchangeable. The central rule is simple: always identify the stage at which energy is measured.
The Energy Chain: From Resource to Service
A simplified energy chain contains five analytical stages:
| Stage | Meaning | Illustrative examples |
|---|---|---|
| Primary energy | Energy entering the human-controlled system from natural resources before deliberate conversion. | Crude oil, coal, natural gas, uranium heat content, harvested biomass, captured wind, hydropower, geothermal heat, solar radiation. |
| Secondary energy | An energy carrier produced by converting primary energy or another carrier. | Electricity, gasoline, diesel, hydrogen, coke, district heat, synthetic methane, refined biofuels. |
| Final energy | Energy delivered to the end-use boundary and available to equipment or users. | Electricity at a building meter, gasoline purchased at a station, natural gas delivered to a furnace, district heat entering a building. |
| Useful energy | The portion of final energy converted into the form directly required for a task. | Shaft work, indoor heat, cooling extracted from a room, light emitted into a space, process heat at a required temperature. |
| Energy service | The social or economic outcome enabled by useful energy and complementary systems. | Mobility, thermal comfort, clean water, refrigerated food, communication, manufactured products, clinical services. |
The stages are linked, but the boundaries are not always physical pieces of equipment. They are accounting conventions. A battery may receive secondary electricity, store it, and return secondary electricity. Electricity from a rooftop photovoltaic system may be treated as primary energy at generation and final energy at the building bus if no public network lies between them. Hydrogen may be secondary energy when produced from electricity and final energy when delivered to an industrial furnace.
A full chain can be represented conceptually as:
\text{Resource} \rightarrow \text{Primary energy} \rightarrow \text{Conversion} \rightarrow \text{Secondary carrier} \rightarrow \text{Distribution} \rightarrow \text{Final energy} \rightarrow \text{End-use conversion} \rightarrow \text{Useful energy} \rightarrow \text{Service}
\]
Interpretation: Every arrow represents infrastructure, institutions, time, cost, material requirements, and potential loss. Energy accounting simplifies these relationships without eliminating the need to state the boundary.
The chain can branch and reconnect. Electricity can produce hydrogen; hydrogen can produce electricity; electricity can charge storage; waste heat can feed a district network; petroleum products can become transport fuel or chemical feedstock. Energy-system analysis therefore uses flow networks rather than a single linear sequence.
Primary Energy
Primary energy is energy available in natural resources before it has undergone a deliberate human-controlled conversion into another carrier. It is the entry point into most national energy balances.
Common primary-energy resources include:
- coal and lignite;
- crude oil and natural-gas liquids;
- natural gas;
- uranium or the thermal energy released through nuclear fission, depending on the convention;
- biomass and renewable wastes;
- geothermal heat;
- hydraulic energy captured by hydropower systems;
- wind energy captured by turbines;
- solar radiation captured as heat or electricity;
- ocean, wave, and tidal energy captured by conversion devices.
Primary energy is not identical to a physical stock in the ground. It is an accounting measure of the energy entering the analyzed system. The energy content of an untouched coal seam is not normally counted in annual primary-energy supply. Coal becomes part of the annual balance when it is extracted or otherwise enters the energy economy. Similarly, all sunlight reaching a country is not counted; only the portion captured by energy technologies enters conventional balances.
For combustible fuels, primary energy is usually measured through a heating value. Two common measures are:
- Higher heating value, which includes the heat recoverable if water vapor in combustion products condenses.
- Lower heating value, which excludes that condensation heat.
Mixing the two conventions can create apparent efficiency differences. A condensing boiler may exceed 100 percent efficiency when output is compared with lower heating value, even though it does not violate conservation. The result indicates that the denominator excludes energy later recovered through condensation.
Primary energy is useful because it reveals resource requirements and upstream conversion burdens. It can show how much fuel, captured renewable energy, or nuclear heat enters a national system. However, it does not by itself reveal the quality of the energy, the services delivered, environmental effects, or how efficiently final users convert energy into outcomes.
Secondary Energy
Secondary energy is an energy carrier produced by transforming primary energy or another secondary carrier. It is created because raw resources are often inconvenient, unsafe, geographically concentrated, chemically unsuitable, or difficult to control at the point of use.
Electricity is the most prominent secondary carrier. It can be produced from coal, gas, uranium, wind, sunlight, moving water, geothermal heat, biomass, or stored chemical energy. Once in the electrical network, electrons are not labeled by origin. Electricity provides a common carrier that can power motors, electronics, heating, cooling, lighting, electrochemistry, and transportation.
Refined petroleum products are also secondary energy. Crude oil is separated and transformed into gasoline, diesel, jet fuel, fuel oil, liquefied petroleum gases, lubricants, and petrochemical feedstocks. The refinery consumes energy internally, may import or export electricity and steam, and may produce multiple co-products. Allocating primary input across these products requires accounting rules.
Other secondary carriers include:
- hydrogen produced through electrolysis, reforming, gasification, or other pathways;
- coke produced from coal for metallurgical use;
- district heat generated in boilers, combined heat and power plants, heat pumps, industrial recovery systems, or geothermal networks;
- synthetic fuels produced from hydrogen, captured carbon, biomass, or other feedstocks;
- processed biofuels such as ethanol, biodiesel, biomethane, and renewable diesel;
- compressed air, chilled water, and steam when treated as distributed energy carriers within industrial or campus systems.
A secondary carrier may undergo further conversion. Electricity can produce hydrogen, which can produce ammonia, synthetic methane, or liquid fuels. Electricity can charge a battery and later be discharged. Natural gas can produce electricity, and electricity can operate a heat pump that transfers environmental heat. The label therefore depends on the stage, not on an inherent property of the substance.
Secondary energy often has higher usability than the primary resource from which it was made, but conversion requires infrastructure and creates losses. Refining makes crude oil more suitable for engines. Electricity is highly controllable and can be transported through wires, but thermal electricity generation rejects heat. Hydrogen can support chemical processes and high-temperature applications, but production, compression, transport, storage, and reconversion consume energy.
Final Energy
Final energy is the energy delivered to the end-use boundary after transformation, transmission, distribution, and energy-sector own use have been accounted for. It is the energy available to households, commercial buildings, industry, transportation, agriculture, public services, and other end users.
Examples include:
- electricity measured at a building or industrial meter;
- natural gas delivered through a distribution network;
- gasoline or diesel purchased by a vehicle operator;
- district heat delivered through a heat exchanger;
- coal delivered to an industrial furnace;
- hydrogen delivered to an industrial plant or fueling station;
- biomass used by a household, business, or industrial process.
Final energy is sometimes called delivered energy or site energy, although the terms are not always perfectly interchangeable. Final-energy statistics usually follow sectoral conventions, while site energy is often used in building analysis. Both focus on energy crossing an end-use boundary rather than upstream resource inputs.
Final energy excludes most transformation losses that occurred before delivery. If a thermal power plant consumes 100 units of primary fuel and supplies 40 units of electricity to the grid, the 60 units rejected or used within the plant do not appear as final electricity. Additional transmission and distribution losses may reduce the delivered amount further.
Final energy is especially useful for analyzing customer demand, utility sales, end-use equipment, and infrastructure capacity. It helps answer questions such as how much electricity buildings purchase, how much fuel transportation consumes, and which sectors drive network loads. Yet it can be misleading when technologies have very different upstream conversion requirements or end-use efficiencies.
A decline in final energy does not necessarily mean a decline in service. Efficient motors, heat pumps, electric vehicles, building envelopes, and process redesign can provide equal or greater service with less delivered energy. Conversely, final energy can rise because more people gain access to essential services, even while equipment efficiency improves.
Useful Energy and Energy Services
Final energy is not the endpoint of the chain. End-use technologies convert it into useful energy: the form directly required for a task.
A motor converts electricity into shaft work. A lamp converts electricity into visible light and heat. A boiler converts fuel into useful heat. A refrigerator uses electrical work to remove heat from a cooled space. A vehicle converts fuel or electricity into tractive work at the wheels. A pump converts shaft work into fluid pressure and flow.
A simple end-use relationship is:
E_{\text{useful}} = \eta_{\text{end use}} E_{\text{final}}
\]
Interpretation: For conventional conversion equipment, useful energy equals final energy multiplied by end-use efficiency. Heat pumps require a coefficient-of-performance formulation because they transfer environmental heat in addition to consuming electricity.
Useful energy is closer to what society needs, but people rarely demand joules of shaft work or heat for their own sake. They demand energy services. A comfortable room depends on useful heating or cooling, but also on insulation, air sealing, thermal mass, ventilation, humidity control, occupancy, and behavior. Mobility depends on tractive work, but also on vehicle mass, infrastructure, land use, route design, congestion, and access. Industrial output depends on process heat and motion, but also on materials, controls, maintenance, and production organization.
The relationship can be represented conceptually as:
S = f\!\left(E_{\text{useful}},\, K,\, I,\, B,\, Q\right)
\]
Interpretation: Energy service \(S\) depends on useful energy together with capital equipment \(K\), infrastructure \(I\), behavior \(B\), and quality or operating conditions \(Q\). Energy alone does not determine the service outcome.
This distinction changes policy analysis. An energy-poor household may consume little final energy because it lacks access, not because it is efficient. A well-insulated building may provide better comfort with less final energy. A compact transportation system may provide greater accessibility with fewer vehicle-kilometers. A hospital may increase energy use to support ventilation, sterilization, diagnostics, and resilience. Energy service therefore connects physical accounting to public purpose.
Energy Sources, Carriers, and Storage Media
An energy source provides energy to a system. An energy carrier transports energy from one place, time, or process to another. A storage medium preserves energy for later use. The same substance or field can play more than one role depending on the boundary.
| Item | Typical accounting role | Important qualification |
|---|---|---|
| Crude oil | Primary energy source | Usually transformed into secondary refined products before final use. |
| Electricity | Secondary carrier | May be counted as primary at the point of renewable generation under some statistical conventions. |
| Hydrogen | Secondary carrier and storage medium | Its upstream primary-energy requirement depends on the production pathway. |
| Battery | Storage technology | Stores electrical energy through reversible electrochemical states; it is not an original energy source. |
| Natural gas | Primary source or final fuel | Primary when entering the energy system; final when delivered directly to an end user. |
| District heat | Secondary carrier | May originate from fuel combustion, heat pumps, geothermal energy, nuclear heat, or recovered waste heat. |
| Solar radiation | Primary renewable resource | Only captured energy is normally represented in conventional balances. |
Calling hydrogen, electricity, or batteries an “energy source” can obscure the upstream resources and infrastructure required to produce or charge them. The language matters because carriers enable flexibility but do not remove resource constraints. An electric vehicle shifts the immediate energy carrier from liquid fuel to electricity; the environmental result depends on electricity supply, vehicle production, charging, and system operation. Hydrogen may decarbonize a process when produced with low-emissions energy, but the carrier itself does not guarantee that outcome.
Carriers also differ in storage, transport, safety, density, conversion, and control. Electricity is highly versatile but difficult to store directly at grid scale without conversion. Liquid fuels have high volumetric and gravimetric energy density but create combustion emissions when fossil-derived. Hydrogen has high energy per unit mass but low volumetric density under ordinary conditions. District heat is useful locally but loses value with distance and temperature drop.
Conversion Losses, Own Use, and Network Losses
Energy balances must distinguish several kinds of reduction between primary and final energy.
Transformation losses occur when energy is converted from one form or carrier to another. A thermal power plant rejects heat. A refinery consumes fuel and electricity. An electrolyzer loses energy as heat while producing hydrogen. A battery loses energy during charging, storage, and discharge.
Energy-sector own use is energy consumed by the energy industry itself. Examples include pumps, compressors, fans, control systems, mining equipment, refinery heaters, pipeline compressors, liquefaction plants, power-station auxiliaries, and fuel processing.
Transmission and distribution losses occur while carriers move through networks. Electrical losses arise from resistance, transformers, and system operation. Gas networks consume compressor energy and may leak. District-heating networks lose heat to the environment. Fuel distribution uses terminals, pipelines, ships, rail, trucks, and storage facilities.
Non-energy use describes fuels used as material feedstocks rather than combusted for energy, such as oil and gas inputs to petrochemicals, lubricants, asphalt, fertilizers, and some industrial products. Energy balances often separate these flows because the carbon and energy remain partly embodied in products rather than immediately released through combustion.
Statistical differences reconcile measurement gaps, inventory changes, timing mismatches, unit conversions, and data sources. They should not be treated as physical losses without investigation.
A simplified relationship is:
E_{\text{final}} = E_{\text{primary}} – L_{\text{transformation}} – U_{\text{energy sector}} – L_{\text{networks}} – E_{\text{non-energy}} \pm \Delta E_{\text{stocks}} \pm D_{\text{statistical}}
\]
Interpretation: The exact form varies by balance. Imports, exports, bunkers, stock changes, and transformation outputs must be represented consistently. Non-energy use is a destination rather than necessarily a physical loss.
Losses are not all equally avoidable. Thermodynamics imposes limits, but real systems also lose energy through friction, leakage, standby consumption, suboptimal loading, poor maintenance, inadequate insulation, and mismatched temperature levels. Energy accounting identifies where losses occur; engineering and governance determine which can be reduced.
Energy-Balance Equations
A national or organizational energy balance is a structured conservation statement. At the most general level:
\text{Supply} = \text{Transformation} + \text{Energy-sector use} + \text{Distribution losses} + \text{Final consumption} + \text{Non-energy use} + \text{Stock change} + \text{Statistical difference}
\]
Interpretation: Every term must use compatible units, periods, calorific conventions, and boundaries. Imports and exports enter the supply calculation with appropriate signs.
For a single conversion process with one main output:
E_{\text{input}} = E_{\text{output}} + E_{\text{loss}} + \Delta E_{\text{stored}}
\]
Interpretation: Energy can leave as useful output, waste heat, by-products, unburned material, or stored energy. A residual may indicate measurement error or an incomplete boundary.
The conversion efficiency is:
\eta_{\text{conversion}} = \frac{E_{\text{desired output}}}{E_{\text{input}}}
\]
Interpretation: “Desired output” must be defined. Combined heat and power plants may have electrical efficiency, useful-heat efficiency, and total useful-energy efficiency.
For a multistage chain, the direct product of stage efficiencies gives the overall efficiency when stages are sequential and boundaries are compatible:
\eta_{\text{chain}} = \prod_{i=1}^{n} \eta_i
\]
Interpretation: A chain with efficiencies of 0.90, 0.95, and 0.80 has an overall efficiency of 0.684. Small losses at several stages can compound into a large system loss.
The primary-to-useful relationship is then:
E_{\text{useful}} = E_{\text{primary}}\,\eta_{\text{transformation}}\,\eta_{\text{network}}\,\eta_{\text{end use}}
\]
Interpretation: This compact equation is useful for comparison but can hide branching, co-products, storage, imports, temporal operation, and environmental energy transferred by heat pumps.
Electricity in Energy Accounting
Electricity creates one of the most important accounting challenges because it can be produced from combustible fuels, nuclear heat, hydropower, wind, solar radiation, geothermal heat, storage discharge, or imported electricity. These pathways do not share a single obvious primary-energy measure.
For thermal generation, primary input can be measured through fuel heating value or reactor heat. Electrical output is secondary energy. The difference appears as transformation loss and plant own use.
For wind, solar photovoltaic, and hydropower, no fuel is burned and no measured thermal input enters the generator. Two broad conventions are common:
- Physical-energy-content method: renewable electricity is counted as primary energy equal to the electricity generated.
- Substitution method: renewable electricity is assigned the amount of fossil primary energy that would have been required to generate equivalent electricity in a reference thermal plant.
The methods answer different questions. The physical method records the captured energy entering the commercial energy system. The substitution method estimates displaced thermal fuel. Neither should be used without disclosure because the choice can substantially change reported primary-energy totals and renewable shares.
Imported electricity creates another boundary issue. A country may report imported electricity as an energy inflow without assigning the exporting country’s upstream primary energy and losses. Consumption-based studies may reallocate those upstream requirements, but conventional territorial balances often do not.
Storage must be handled carefully to avoid double counting. Electricity used to charge a battery is not new primary energy. Discharged electricity should be linked to prior charging and storage losses. Pumped hydropower similarly moves electricity across time by converting it into gravitational potential energy and back.
Curtailment, congestion, and negative prices do not mean energy was destroyed. They indicate that available generation exceeded what the network, storage, demand, or market could accept under the operating conditions. Depending on the accounting method, uncaptured renewable potential may not enter the balance at all, while generated-and-curtailed electricity may appear as a loss or operational reduction.
Non-Combustible Renewable Energy
Non-combustible renewables challenge fuel-centered accounting because the natural resource flow is enormous and diffuse. Counting all sunlight, wind, rainfall, tides, or geothermal heat crossing a territory would overwhelm the balance and provide little information about the energy system. Conventional statistics therefore count captured output rather than the full natural flow.
| Technology | Common primary-energy treatment | Important limitation |
|---|---|---|
| Solar photovoltaic | Electricity generated is counted as primary energy under the physical method. | Incident solar radiation and conversion losses inside the module are not represented as primary-energy loss. |
| Wind | Electricity generated is counted as primary energy under the physical method. | Available kinetic energy in the wind field is not counted. |
| Hydropower | Electricity generated is commonly counted as primary energy. | Hydrological energy not captured by the plant remains outside the commercial balance. |
| Geothermal electricity | May be based on produced heat or electrical output, depending on the statistical system. | Resource decline, reinjection, parasitic loads, and rejected heat may be treated differently. |
| Solar thermal | Useful heat captured by collectors may be counted as primary energy. | Measurement is often estimated from installed area, performance, and climate. |
| Ambient heat used by heat pumps | May be counted as renewable energy under specified performance and system conditions. | The boundary must separate electrical input from environmental heat transferred. |
Under the physical method, replacing a thermal plant with wind or solar can reduce total primary energy even if final electricity remains unchanged. This occurs because the thermal plant’s rejected heat was counted as primary-energy input and transformation loss, while the renewable generator is counted at electrical output. The reduction is not merely a statistical illusion: the system genuinely no longer requires the thermal input. However, it does not mean the renewable system is physically lossless. Aerodynamic, optical, electrical, and conversion losses still occur; they are simply outside the selected primary-energy boundary.
Renewable accounting should therefore be paired with other metrics, including final electricity, capacity, generation, land and material requirements, lifecycle emissions, reliability contribution, curtailment, storage, and service delivery.
Nuclear Energy and Bioenergy
Nuclear energy is usually treated as primary energy through the heat produced in the reactor rather than the much larger theoretical energy content of uranium nuclei. Electricity is secondary output, and rejected heat appears as transformation loss. The estimated reactor heat may be derived from electrical generation and an assumed or measured thermal efficiency.
This convention makes nuclear generation comparable with thermal fossil generation at the power-plant boundary, but it also means primary-energy totals depend on the assumed conversion efficiency. Advanced reactors that produce both electricity and useful heat require allocation across outputs. Uranium mining, enrichment, fuel fabrication, construction, decommissioning, and waste management are generally addressed in lifecycle analysis rather than operational primary-energy balances.
Bioenergy can be counted as primary energy when biomass, biogas, or renewable waste enters the energy system. Yet the physical and ecological boundaries are more complex than a fuel balance suggests. Harvesting, drying, transport, fertilizer, land-use change, soil carbon, regrowth, methane leakage, and competing material uses may determine the actual climate and sustainability outcome.
Traditional biomass use also raises measurement and justice questions. Fuelwood, charcoal, crop residues, and animal waste may be collected outside formal markets and estimated rather than metered. Low reported final energy can coexist with severe time burden, indoor air pollution, deforestation pressure, and inadequate energy services. Energy quantity alone does not measure welfare.
Biogenic carbon accounting is distinct from energy accounting. Treating biomass as renewable in an energy balance does not establish carbon neutrality. Climate assessment must consider the timing and magnitude of emissions, regrowth, counterfactual land use, supply-chain energy, and ecological effects.
Source Energy and Site Energy
Building analysis often distinguishes site energy from source energy. Site energy is measured at the building boundary. Source energy attempts to include upstream extraction, conversion, and network losses associated with delivered fuels and electricity.
A source-energy factor can be written as:
F_{\text{source}} = \frac{E_{\text{primary associated with delivery}}}{E_{\text{site}}}
\]
Interpretation: The factor depends on generation mix, plant efficiency, transmission losses, fuel processing, imports, time period, and accounting convention. It is not a universal property of electricity or fuel.
For a building using multiple carriers:
E_{\text{source,total}} = \sum_j F_{\text{source},j} E_{\text{site},j}
\]
Interpretation: Carrier-specific factors convert measured site consumption into an estimated upstream requirement. Marginal and average factors can produce different results.
Source energy helps compare electric and fuel-consuming buildings across upstream supply chains, but fixed factors can become outdated as electricity systems change. An annual average factor may not represent the marginal generator at a particular hour. A national factor may not represent a regional grid. A location-based factor may not reflect contractual procurement. A primary-energy factor may not align with emissions, cost, reliability, or environmental justice.
Site energy remains important because it determines meter consumption, building loads, utility bills, equipment sizing, and network capacity. A complete assessment often reports both site and source energy together with emissions and peak demand.
Sectoral Final-Energy Demand
Final energy is commonly organized by end-use sector, but sector definitions differ across statistical systems. Typical categories include industry, transport, residential buildings, commercial and public services, agriculture, and non-energy use.
Industry uses fuels and electricity for process heat, steam, motors, compressed air, furnaces, electrochemistry, refrigeration, and feedstocks. Some energy transformation occurs inside industrial boundaries, making the distinction between energy-industry transformation and industrial final consumption important.
Transport includes road, rail, aviation, navigation, pipelines, and sometimes off-road equipment. International aviation and marine bunkers may be reported separately from domestic final consumption. Electricity for rail or vehicles may appear in the electricity balance and then be allocated to transport.
Residential buildings use energy for space conditioning, water heating, cooking, lighting, appliances, refrigeration, electronics, and increasingly vehicle charging. Informal fuels and shared systems can be difficult to measure.
Commercial and public services include offices, retail, schools, hospitals, data centers, government facilities, hospitality, and other services. Energy intensity varies widely with operating hours, equipment, climate, ventilation, and service quality.
Agriculture uses diesel, electricity, heat, irrigation pumping, fertilizer feedstocks, drying, cold chains, and machinery. Food-system energy extends far beyond farm boundaries into processing, transport, refrigeration, and retail.
Sectoral data are not merely descriptive. They determine where policies, infrastructure, financing, standards, and public investment are directed. Misclassification can conceal load growth, informal consumption, or energy poverty. Cross-country comparisons require harmonized definitions.
Efficiency, Electrification, and Structural Change
Efficiency and electrification can change primary, final, and useful energy in different directions.
Suppose a service requires 100 units of useful heat. A boiler with 90 percent efficiency requires about 111 units of final fuel. A heat pump with a seasonal coefficient of performance of 3 requires about 33 units of final electricity while transferring the remaining heat from the environment. Whether primary energy falls depends on how the electricity is produced and counted.
Electrification often reduces final energy because electric motors, heat pumps, and electrochemical processes can avoid combustion losses at the point of use. It can also shift losses upstream into electricity generation, storage, or hydrogen production. As the grid becomes less thermal and more renewable, both upstream losses and emissions may decline.
Structural change also affects energy balances. An economy may shift from heavy manufacturing toward services, import more energy-intensive goods, urbanize, expand digital infrastructure, or increase cooling demand. Territorial final energy may fall while consumption-based embodied energy rises through imports. Energy intensity can improve because of real efficiency, economic restructuring, fuel switching, or changes in service quality.
A transition pathway should therefore report multiple layers:
- primary-energy supply by resource;
- transformation input, output, and loss;
- final energy by carrier and sector;
- useful energy or service indicators where available;
- peak demand and temporal profiles;
- emissions, cost, reliability, land, water, and material effects;
- distributional outcomes and access.
An apparent primary-energy reduction during electrification can be desirable, but it should not be misrepresented as a decline in social activity. The purpose is to provide services with fewer resource inputs, lower losses, and lower harm.
Embodied and Lifecycle Energy
Operational energy balances usually track fuels and carriers used during a defined period. They do not automatically include the energy required to manufacture power plants, buildings, vehicles, transmission lines, batteries, pipelines, roads, or industrial equipment. That upstream requirement is often called embodied energy.
Lifecycle energy analysis expands the boundary to include extraction, material processing, manufacturing, construction, operation, maintenance, replacement, decommissioning, transport, and recycling. It is essential when comparing technologies with low operating energy but substantial infrastructure requirements.
Embodied energy should not be added casually to annual primary-energy balances because the accounting periods and allocation methods differ. A wind turbine’s construction energy is incurred before and during installation, while electricity output occurs over many years. Analysts may amortize embodied energy across expected generation, calculate energy payback time, or use lifecycle inventory methods.
Key choices include:
- geographic boundary and electricity mix used in manufacturing;
- allocation among co-products;
- capital lifetime and utilization;
- replacement rates and maintenance;
- recycled-content and end-of-life credits;
- treatment of infrastructure shared across technologies;
- distinction between energy and exergy.
Lifecycle analysis complements rather than replaces primary-secondary-final accounting. The first explains operational flows through the energy system; the second reveals upstream and downstream burdens embedded in infrastructure and products.
Energy Intensity and Related Indicators
Energy intensity relates energy use to an activity or output. Common forms include:
I_E = \frac{E}{A}
\]
Interpretation: Energy \(E\) may be primary, final, or useful energy. Activity \(A\) may be economic output, floor area, tonne of product, passenger-kilometer, household, or another service measure.
Examples include:
- primary energy per unit of gross domestic product;
- final energy per square meter of building floor area;
- electricity per tonne of steel or cement;
- fuel per vehicle-kilometer;
- energy per passenger-kilometer or tonne-kilometer;
- useful heat per unit of industrial output;
- energy cost or burden relative to household income.
Intensity is not the same as efficiency. Energy per dollar of economic output depends on prices, exchange rates, industry structure, climate, trade, and measurement. Energy per square meter depends on occupancy, comfort, weather, operating hours, and building use. A lower intensity can result from reduced service, outsourcing, or recession rather than technical improvement.
Decomposition methods separate changes in total energy into activity, structure, and intensity effects. A simplified identity is:
E = \sum_i A \times S_i \times I_i
\]
Interpretation: Total energy is represented through aggregate activity \(A\), the share of activity in subsector \(i\), \(S_i\), and subsector energy intensity \(I_i\). More advanced index methods handle interactions and logarithmic weighting.
Indicators should be paired with service, access, quality, and distribution. A low-income household can have low total energy use but high energy burden and inadequate comfort. A data center can have high electricity intensity while delivering essential digital services. Metrics become meaningful only when their denominator reflects the decision.
System Boundaries and Accounting Choices
Every energy result depends on a boundary. Important dimensions include:
- Spatial boundary: equipment, building, campus, city, grid region, country, or global supply chain.
- Temporal boundary: instant, hour, season, year, project lifetime, or transition period.
- Process boundary: direct operation, upstream fuel cycle, infrastructure, or full lifecycle.
- Ownership boundary: assets owned by an organization, contracted supply, or all induced consumption.
- Accounting stage: primary, secondary, final, useful, or service energy.
- Valuation boundary: total energy, exergy, cost, emissions, land, water, materials, or public outcomes.
A boundary that is appropriate for utility billing may be inadequate for climate policy. A national primary-energy balance may be inadequate for a building retrofit. A facility energy audit may omit embodied energy that matters in lifecycle comparison. A corporate inventory may exclude household or community impacts that matter for public legitimacy.
Boundary choice is not a reason to abandon quantitative analysis. It is a reason to document assumptions and, where possible, report more than one boundary. A robust comparison might show site energy, source energy, final energy, primary energy, useful service, and lifecycle emissions side by side.
The following table illustrates how one technology can appear under different boundaries:
| Boundary | Measured quantity for an electric heat pump | What remains outside |
|---|---|---|
| Appliance | Electricity input and useful heat delivered | Grid generation, network losses, building envelope, refrigerant lifecycle |
| Building site | Metered electricity and indoor service | Upstream electricity production and equipment manufacturing |
| Energy-system source | Primary energy associated with electricity plus useful heat | Embodied infrastructure unless explicitly included |
| Lifecycle | Manufacturing, refrigerant, operation, maintenance, and end of life | Broader social and land-use effects unless separately modeled |
Data Quality and Balance Reconciliation
Energy balances combine data from mines, wells, ports, refineries, power plants, pipelines, utilities, customs agencies, industrial surveys, household surveys, and models. These sources differ in timing, units, coverage, and accuracy.
Common data-quality problems include:
- gross and net calorific values mixed across fuels;
- mass and volume data converted with uncertain density or composition;
- electricity reported as gross generation in one dataset and net generation in another;
- fuel inputs allocated across combined heat and power outputs using inconsistent methods;
- autoproducers omitted or double counted;
- informal biomass use estimated from sparse surveys;
- stock changes and international bunkers assigned inconsistently;
- subnational data not summing to national totals;
- metering gaps, theft, nontechnical losses, or unreported self-generation;
- time-zone and calendar mismatches in high-frequency data.
A balance residual can be calculated as:
R = E_{\text{measured input}} – E_{\text{measured output}} – \Delta E_{\text{stored}}
\]
Interpretation: A nonzero residual may reflect measurement error, missing flows, inconsistent timing, or an incorrect boundary. It should be investigated and reported rather than silently erased.
Reconciliation methods adjust uncertain entries so that conservation constraints close. Good practice preserves original values, records adjustments, assigns uncertainty, and distinguishes measured from modeled data. A mathematically closed balance can still be conceptually wrong if categories or boundaries are misdefined.
Machine-readable metadata should include units, heating-value basis, time period, geographic coverage, source, revision date, confidentiality treatment, and transformation conventions. Version control is especially important because statistical agencies revise historical series.
Worked Examples
Example 1: Natural Gas to Useful Motor Work
A gas-fired power plant receives 1,000 megawatt-hours of primary fuel energy. It exports 440 megawatt-hours of electricity after plant own use. Transmission and distribution deliver 95 percent of exported electricity to an industrial facility. A motor converts 93 percent of final electricity into useful shaft work.
E_{\text{final}} = 1000 \times 0.44 \times 0.95 = 418\ \text{MWh}
\]
E_{\text{useful}} = 418 \times 0.93 = 388.74\ \text{MWh}
\]
\eta_{\text{primary-to-useful}} = \frac{388.74}{1000} = 38.874\%
\]
Interpretation: The motor is highly efficient, but the full chain delivers about 39 percent of primary fuel energy as useful shaft work. This does not account for gas extraction, processing, pipeline energy, or embodied infrastructure.
Example 2: Boiler and Heat Pump
A building requires 90 megawatt-hours of useful heat. A gas boiler operates at 90 percent efficiency. An electric heat pump has a seasonal coefficient of performance of 3.0.
For the boiler:
E_{\text{final,gas}} = \frac{90}{0.90} = 100\ \text{MWh}
\]
For the heat pump:
E_{\text{final,electricity}} = \frac{90}{3.0} = 30\ \text{MWh}
\]
If the electricity source factor is 1.8 units of primary energy per unit delivered, the heat pump requires an estimated 54 megawatt-hours of primary energy. The boiler’s upstream factor would also need to be applied for a fair comparison. The result changes with grid mix, ambient temperature, boiler performance, and the source-energy convention.
Example 3: Refinery Pathway
A refinery receives 10,000 terajoules of crude-oil primary energy. It produces 8,900 terajoules of saleable products, consumes 600 terajoules internally, and records 500 terajoules of process loss and inventory adjustment.
10{,}000 = 8{,}900 + 600 + 500
\]
Interpretation: The secondary-product yield is 89 percent on an energy basis, but individual product yields require co-product allocation. Refinery output may include non-energy feedstocks as well as fuels.
Example 4: Rooftop Solar and Building Final Energy
A building consumes 120 megawatt-hours of electricity annually. Rooftop solar produces 40 megawatt-hours, of which 32 are consumed onsite and 8 are exported. The building imports 88 megawatt-hours from the grid.
At the site boundary, total electrical use remains 120 megawatt-hours. Purchased final electricity is 88 megawatt-hours. Onsite solar supplies 32 megawatt-hours directly. Exported electricity belongs to the wider system balance rather than the building’s consumed final energy.
Whether solar output is labeled primary or secondary depends on the statistical convention, but the physical meter relationships remain:
E_{\text{load}} = E_{\text{grid import}} + E_{\text{onsite self-consumption}} = 88 + 32 = 120\ \text{MWh}
\]
Example 5: Electric and Combustion Mobility
Two vehicles each require 20 megawatt-hours of useful wheel work over a period. An electric drivetrain is 80 percent efficient from battery output to wheels. A combustion drivetrain is 25 percent efficient from fuel tank to wheels.
E_{\text{final,EV}} = \frac{20}{0.80} = 25\ \text{MWh}
\]
E_{\text{final,ICE}} = \frac{20}{0.25} = 80\ \text{MWh}
\]
The electric vehicle uses much less final energy for the same wheel work. A primary-energy comparison must add electricity generation, charging, storage, and fuel-supply assumptions. A service comparison should also consider vehicle size, occupancy, distance, infrastructure, and accessibility.
Common Misconceptions
“Primary energy is the energy society actually uses.”
Primary energy is an upstream resource measure. Society values services produced after multiple conversion stages. High primary energy can coexist with low service if systems are inefficient or access is unequal.
“Electricity is always secondary energy.”
Electricity produced from fuels is conventionally secondary energy, but some statistical systems count non-combustible renewable electricity as primary at generation. The convention must be stated.
“Final energy is the same as useful energy.”
Final energy is delivered to end-use equipment. Useful energy is what remains after the equipment converts it into heat, motion, light, cooling, or another required form.
“A fall in primary energy means economic contraction.”
Primary energy can fall through reduced conversion losses, electrification, efficiency, structural change, and renewable substitution while services and output increase.
“Renewables have no losses because primary energy equals electricity output.”
Renewable technologies have aerodynamic, optical, electrical, storage, and network losses. Some lie outside the statistical primary-energy boundary under the physical method.
“Heat pumps violate conservation because they deliver more heat than electricity consumed.”
Heat pumps use electrical work to transfer environmental heat. Useful heat equals electrical input plus heat extracted from the source.
“Source-energy factors are fixed physical constants.”
They depend on location, time, grid mix, fuel pathway, imports, losses, and accounting method. They should be updated and documented.
“All losses are waste.”
Some losses are unavoidable under thermodynamic constraints; others can be reduced. Some rejected heat can be recovered if temperature, timing, distance, and demand align.
“Energy efficiency automatically reduces total energy use.”
Efficiency lowers energy per unit of service, but total use also depends on activity, prices, access, behavior, and rebound effects.
Python Workflow: Multistage Energy Accounting
The following standard-library Python example models a primary-to-useful chain and reports losses at each stage.
from dataclasses import dataclass
from math import prod

@dataclass(frozen=True)
class Stage:
    name: str
    efficiency: float

    def __post_init__(self):
        if not 0 <= self.efficiency <= 1:
            raise ValueError(f"Invalid efficiency for {self.name}")


def run_chain(primary_mwh: float, stages: list[Stage]) -> list[dict]:
    if primary_mwh < 0:
        raise ValueError("Primary energy must be nonnegative")

    rows = []
    energy_in = primary_mwh

    for stage in stages:
        energy_out = energy_in * stage.efficiency
        loss = energy_in - energy_out
        rows.append({
            "stage": stage.name,
            "input_mwh": energy_in,
            "output_mwh": energy_out,
            "loss_mwh": loss,
            "efficiency": stage.efficiency,
        })
        energy_in = energy_out

    return rows


stages = [
    Stage("Power generation", 0.44),
    Stage("Transmission and distribution", 0.95),
    Stage("Electric motor", 0.93),
]

rows = run_chain(1000.0, stages)
overall_efficiency = prod(stage.efficiency for stage in stages)

for row in rows:
    print(
        f"{row['stage']}: "
        f"input={row['input_mwh']:.2f} MWh, "
        f"output={row['output_mwh']:.2f} MWh, "
        f"loss={row['loss_mwh']:.2f} MWh"
    )

print(f"Overall efficiency: {overall_efficiency:.4f}")
print(f"Useful output: {rows[-1]['output_mwh']:.2f} MWh")
A more complete workflow should add:
- branching carriers and co-products;
- imports, exports, and stock changes;
- hourly electricity generation and storage;
- gross versus net generation;
- heating-value conventions;
- source metadata and uncertainty ranges;
- mass and carbon balances alongside energy;
- automated conservation checks.
A useful validation rule is that every node should satisfy input equals output plus storage change within an explicit tolerance. Residuals should be exported rather than hidden.
R Workflow: Comparing Energy Pathways
R can compare pathways and show how stage efficiencies affect primary-to-useful performance.
pathways <- data.frame(
  pathway = c("Gas-to-motor", "Grid-to-heat-pump", "Gas boiler"),
  transformation = c(0.44, 0.90, 0.98),
  network = c(0.95, 0.95, 0.98),
  end_use = c(0.93, 3.00, 0.90)
)

pathways$primary_to_useful <-
  pathways$transformation *
  pathways$network *
  pathways$end_use

pathways$primary_required_for_100_useful <-
  100 / pathways$primary_to_useful

print(pathways)

# Heat-pump coefficients of performance are not efficiencies.
# Values above 1 represent environmental heat transferred into the load.
The example intentionally separates heat-pump coefficient of performance from conventional efficiency. For publication-grade analysis, the workflow should use pathway-specific primary-energy conventions and should not multiply a thermal source factor by a coefficient of performance without clearly defining the boundary.
Scenario analysis can vary:
- power-plant efficiency or renewable share;
- network losses;
- heat-pump seasonal performance;
- motor and drivetrain efficiency;
- storage round-trip efficiency;
- source-energy factors;
- service demand and activity growth.
GitHub Repository
Complete Code Repository
The full Energy Systems repository contains article examples, reproducible energy-balance workflows, primary-to-final accounting models, conversion-chain validation, scenario analysis, uncertainty methods, datasets, documentation, and multi-language computational assets.
A Practical Energy-Accounting Method
A rigorous energy-accounting study can follow a repeatable sequence:
- Define the decision. State whether the analysis concerns resource supply, infrastructure planning, efficiency, emissions, affordability, resilience, or transition strategy.
- Select the energy stage. Identify whether the primary metric is primary, secondary, final, useful, or service energy.
- Draw the boundary. Specify geography, sectors, processes, ownership, imports, exports, and lifecycle coverage.
- Choose conventions. State heating-value basis, renewable-electricity method, treatment of nuclear heat, source factors, and co-product allocation.
- Map carriers and nodes. Identify resources, conversion plants, storage, networks, end-use technologies, and services.
- Collect compatible data. Harmonize units, periods, gross and net values, and calorific assumptions.
- Close the balance. Test conservation at every conversion and network node.
- Separate loss categories. Distinguish transformation loss, own use, network loss, curtailment, non-energy use, and statistical difference.
- Calculate indicators. Report efficiencies, intensity, renewable share, primary-to-final ratio, and primary-to-useful performance.
- Test alternatives. Evaluate efficiency, electrification, fuel switching, storage, demand response, and structural change.
- Quantify uncertainty. Vary heating values, efficiencies, source factors, activity, and missing data.
- Connect to outcomes. Report cost, emissions, reliability, access, health, land, water, and distributional effects.
A transparent output should include:
- a flow diagram or Sankey diagram;
- an energy-balance table with units and conventions;
- conversion and network efficiencies;
- residuals and reconciliation adjustments;
- scenario assumptions;
- uncertainty intervals;
- source metadata and revision history;
- clear separation of physical results from policy judgment.
Policy, Equity, and Public Value
Energy accounting influences public decisions. Primary-energy statistics shape narratives about national efficiency, energy independence, and transition. Final-energy data guide utility investment, appliance standards, fuel taxation, and sectoral policy. Source-energy factors affect building codes and ratings. Renewable accounting determines shares and targets. Energy-intensity indicators are used to evaluate progress.
These metrics can also conceal inequity. A household may appear efficient because it consumes little energy while enduring unsafe temperatures. A community may host generation, extraction, pipelines, or waste facilities while receiving limited service or economic benefit. A country may reduce territorial primary energy by importing energy-intensive goods. A utility may lower annual energy use while peak demand and outage exposure remain high.
Public-value analysis should ask:
- Who controls the energy infrastructure?
- Who pays for conversion and network losses?
- Which communities absorb pollution, heat, land use, or extraction impacts?
- Do efficiency gains improve affordability or mainly increase margins?
- Does lower final energy reflect better technology or suppressed access?
- Are transition costs and reliability risks distributed fairly?
- Which services are essential and should be protected during scarcity?
Energy balances are necessary but not sufficient. They describe quantities moving through a system; they do not determine whether the system is just, legitimate, or aligned with public purpose. Those judgments require governance, participation, and explicit values.
Limits, Uncertainty, and Responsible Interpretation
Primary, secondary, and final energy are powerful abstractions, but they simplify differences in energy quality, timing, location, environmental effect, and service value. One joule of low-temperature heat is not operationally equivalent to one joule of electricity. Annual electricity totals do not describe hourly adequacy. Equal final-energy quantities can have different emissions, cost, reliability, and infrastructure requirements.
Major uncertainties include:
- fuel composition and heating value;
- measurement and metering error;
- informal and self-generated energy;
- conversion efficiency under part-load conditions;
- network and nontechnical losses;
- treatment of imports, exports, and bunkers;
- renewable and nuclear primary-energy conventions;
- co-product allocation;
- source-energy factors;
- service demand and rebound;
- embodied and lifecycle boundaries.
Responsible reporting should avoid false precision. Results should include units, conventions, time period, geography, uncertainty, and stage. A statement such as “the project saves 20 percent energy” is incomplete unless it states whether the saving is primary, site, final, useful, or lifecycle energy and whether service remains constant.
Comparisons should use consistent boundaries. Electricity and fuels should not be compared at different stages. Renewable and thermal generation should not be assigned incompatible primary-energy methods without explanation. Heat-pump output should not be treated as electrical energy created. Statistical differences should not be relabeled as physical loss.
The goal is not a single perfect metric. It is a transparent set of measures that reveal how resources become services and where intervention can improve the system.
Why Energy Accounting Changes System Analysis
Primary, secondary, and final energy reveal that energy systems are chains of transformation rather than inventories of fuels or devices. Primary energy enters from natural resources. Secondary carriers make energy transportable and controllable. Final energy crosses the end-use boundary. Useful energy performs the immediate physical task. Energy services connect that task to human and institutional outcomes.
The distinctions explain why a technology can be efficient at one stage and inefficient across the full chain. They show how transformation losses, own use, storage, transmission, distribution, and end-use performance shape resource requirements. They clarify why electricity, hydrogen, district heat, and refined fuels are carriers rather than independent sources. They also explain why electrification can lower final and primary energy while maintaining or expanding services.
Accounting conventions remain consequential. Renewable electricity, nuclear heat, imported electricity, biomass, source energy, and co-products can be treated differently across statistical systems. Transparent boundaries make these differences interpretable. Hidden conventions make comparisons misleading.
The most useful energy analysis does not stop at totals. It asks where energy enters, how it is transformed, who controls the infrastructure, what is lost, what service is delivered, who benefits, and which environmental and social burdens remain outside the balance. That foundation prepares the way for the next article: tracing energy flows visually through Sankey diagrams and system maps.
Related Articles
- What Are Energy Systems?
- Energy, Power, and Work
- Energy and Thermodynamics
- Energy Flows and Sankey Diagrams
- Energy Return on Investment
- Energy Systems Thinking
- Energy Efficiency
- Electrification
Further Reading
- International Energy Agency. Energy Statistics Manual.
- United Nations Statistics Division. International Recommendations for Energy Statistics.
- Eurostat. Energy Balance Guide.
- U.S. Energy Information Administration. Energy Explained.
- Smil, Vaclav. Energy and Civilization: A History.
- Cullen, Jonathan M., and Julian M. Allwood. Research on energy conversion, useful energy, and global energy flows.
- International Organization for Standardization. ISO 50001, Energy Management Systems.
References
- United Nations Statistics Division. International Recommendations for Energy Statistics. Available at: United Nations.
- International Energy Agency. Energy Statistics Manual. Available at: IEA.
- Eurostat. Energy Balances. Available at: Eurostat.
- U.S. Energy Information Administration. Energy Explained. Available at: EIA.
- Intergovernmental Panel on Climate Change. Climate Change 2022: Mitigation of Climate Change. Available at: IPCC.
- International Organization for Standardization. ISO 50001, Energy Management Systems — Requirements with Guidance for Use.
- Cullen, Jonathan M., and Julian M. Allwood. “The Efficient Use of Energy: Tracing the Global Flow of Energy from Fuel to Service.” Energy Policy.
- Lawrence Livermore National Laboratory. Energy Flow Charts. Available at: LLNL.