
Last Updated June 1, 2026
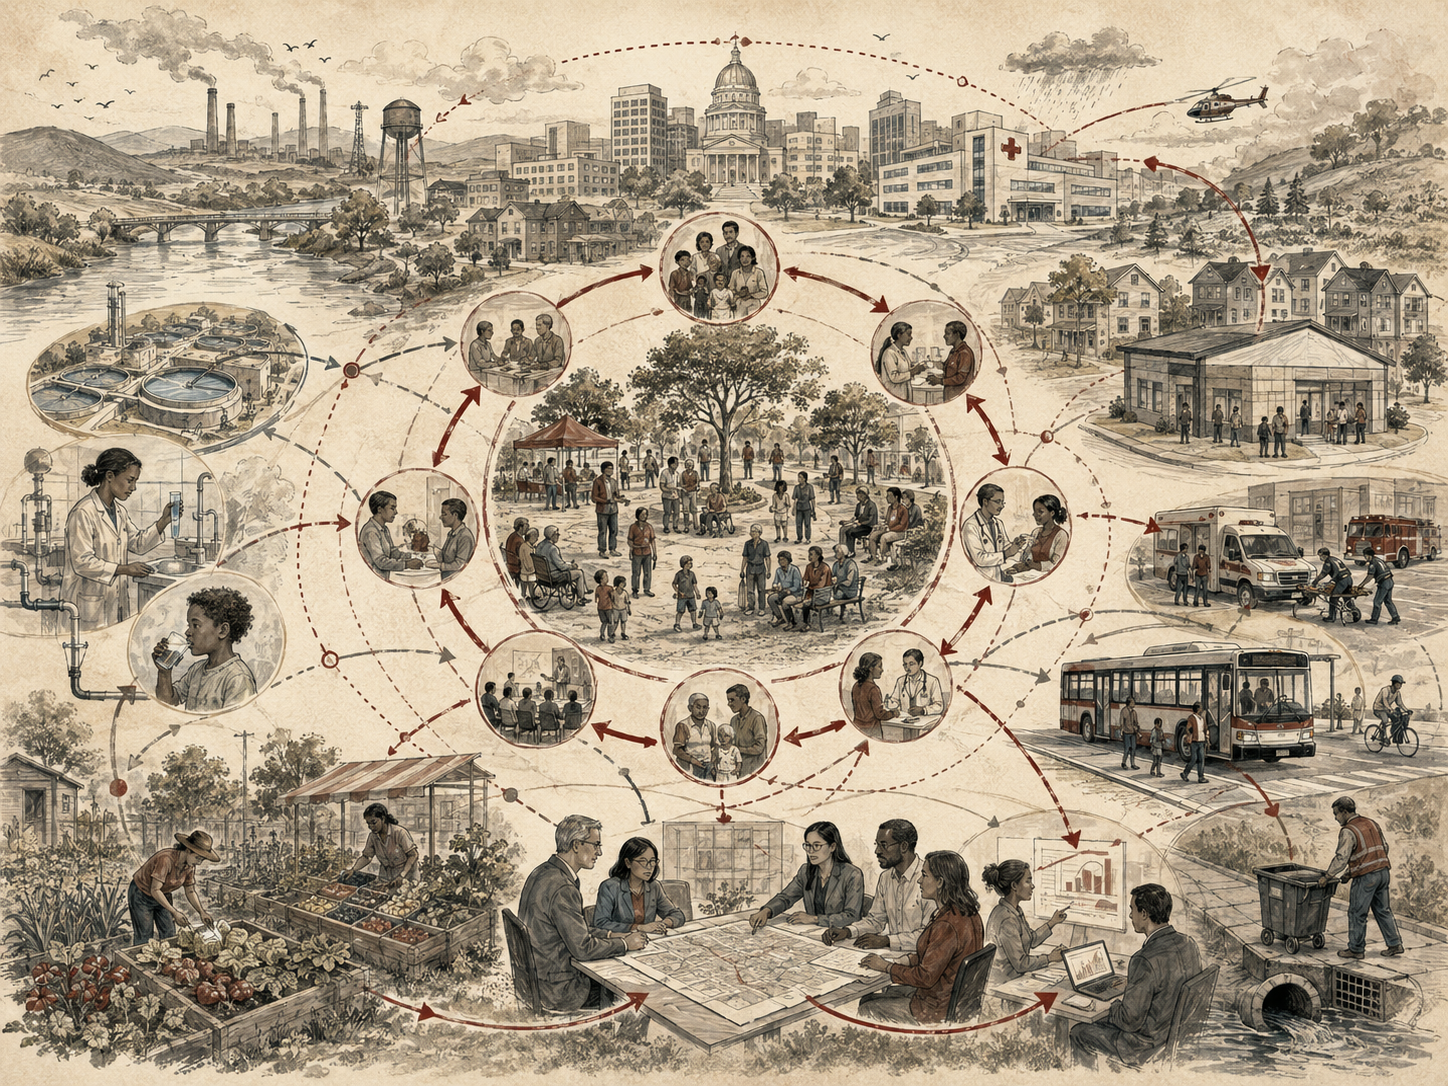
Public health is not only the treatment of disease, the management of hospitals, or the delivery of medical services. It is a system of population wellbeing shaped by housing, food, water, sanitation, work, education, air quality, income, transportation, trust, care capacity, social connection, environmental exposure, public policy, communication, infrastructure, and institutional legitimacy. A society’s health is produced through relationships among people, places, institutions, ecologies, technologies, and power.
Public Health as a System examines health as an outcome of interacting social, biological, environmental, behavioral, infrastructural, and institutional systems. It asks why disease spreads unevenly, why prevention is often underfunded, why hospitals become overloaded, why public trust matters, why marginalized communities face disproportionate harm, why climate change is also a health issue, and why public health cannot be reduced to individual behavior or clinical care alone. Public health is a systems problem because the conditions that make people healthy or vulnerable are produced across the whole fabric of collective life.
This article explains public health through systems thinking. It examines social determinants of health, infectious disease dynamics, chronic disease, prevention, care capacity, public trust, environmental exposure, health inequity, climate risk, institutional learning, and public-health governance. It shows why population health depends on feedback loops, stocks and flows, prevention capacity, communication systems, infrastructure, community trust, and the distribution of vulnerability. It also examines the ethical stakes of public health: who is exposed, who is protected, who is blamed, whose suffering becomes visible, and how public systems can protect dignity, equity, and collective wellbeing over time.
Why Public Health Systems Thinking Matters
Public health systems thinking matters because population health is produced by interacting causes. A person’s health is shaped by biology and behavior, but also by income, housing, food access, water quality, work conditions, neighborhood safety, air pollution, transportation, education, stress, discrimination, healthcare access, climate exposure, public policy, and institutional trust. These conditions do not operate separately. They reinforce one another across time.
A household facing unstable housing may also face food insecurity, chronic stress, unsafe heat exposure, transportation barriers, and delayed care. A community exposed to air pollution may also face underinvestment, inadequate healthcare access, lower political power, and higher chronic disease burden. A public-health emergency may spread through social networks, workplace conditions, school systems, public communication, care capacity, and trust. Health outcomes are therefore not simply the sum of individual choices. They are system behavior.
Systems thinking helps explain why public health interventions sometimes fail. A campaign may tell people to eat healthier while food prices, work schedules, neighborhood access, and stress make healthy eating difficult. A vaccination campaign may assume information is enough while distrust, access barriers, work constraints, transportation, language, and historical harm shape uptake. A hospital expansion may treat downstream illness while upstream housing, pollution, violence, and food insecurity continue producing disease. A policy may improve a narrow indicator while shifting burden onto communities, caregivers, or frontline workers.
| Public health issue | Linear interpretation | Systems-thinking interpretation |
|---|---|---|
| Low preventive-care use | People need reminders or better information. | Use depends on access, cost, trust, transportation, work schedules, language, and prior experience. |
| Chronic disease burden | Individuals need to make better lifestyle choices. | Diet, stress, housing, work, pollution, income, food systems, healthcare, and neighborhood design interact. |
| Infectious disease spread | Transmission is a biological process. | Transmission is shaped by housing density, work conditions, schools, trust, mobility, care access, and communication. |
| Hospital overload | More beds are needed. | Capacity depends on staffing, prevention, primary care, public health, supply chains, trust, and surge planning. |
| Vaccine hesitancy | People lack correct information. | Trust, history, identity, access, risk perception, institutions, misinformation, and community relationships matter. |
| Health inequity | Groups have different risk factors. | Risk is structured by policy, discrimination, exposure, wealth, infrastructure, geography, and institutional power. |
Public health systems thinking shifts attention from isolated interventions to causal structure. It asks what produces vulnerability, what reinforces harm, what stocks of health or trust are being built or depleted, what delays hide consequences, what feedback loops worsen or reduce risk, and what institutions can learn from population-level signals. It makes prevention visible as infrastructure rather than charity, and it treats health equity as central to system performance rather than an optional ethical addition.
Public Health as a Population System
Public health concerns the health of populations, not only the care of individuals after illness occurs. It includes disease prevention, health promotion, environmental protection, surveillance, emergency preparedness, sanitation, vaccination, nutrition, maternal and child health, injury prevention, mental health, occupational health, community health, and the social conditions that allow people to live well. It operates upstream from clinical care, but it must also coordinate with healthcare systems when prevention fails or crisis arrives.
A population health system has multiple interacting layers. At the individual level, biology, age, behavior, genetics, and personal history matter. At the household level, caregiving, income, food, housing, stress, and social support matter. At the community level, schools, workplaces, transportation, safety, social networks, culture, and local institutions matter. At the environmental level, air, water, climate, toxins, heat, noise, and green space matter. At the institutional level, healthcare, public agencies, laws, benefits, emergency systems, and trust matter. At the structural level, poverty, racism, labor markets, housing policy, environmental policy, and political power matter.
\text{Population Health} = f(\text{Biology}, \text{Behavior}, \text{Environment}, \text{Social Conditions}, \text{Care Systems}, \text{Governance})
\]
Interpretation: Population health emerges from interacting biological, behavioral, environmental, social, clinical, and governance systems.
This layered structure means that public health cannot be managed only through medical services. Clinical care is essential, but it often responds after harm has already occurred. Public health asks why harm occurs, how risk is distributed, what conditions produce illness, and how systems can be redesigned to prevent disease before it requires treatment.
Public health is also a commons. Sanitation, clean air, safe water, disease surveillance, vaccination, emergency preparedness, food safety, and trust in public institutions are shared conditions. One person’s health can affect others through infectious disease, caregiving, workplace exposure, community safety, environmental quality, and economic stability. Public health therefore requires collective action, not only private choice.
Seeing public health as a system changes the goal. The goal is not merely to treat disease efficiently. The goal is to build the conditions in which fewer people become sick, care is available when needed, communities can recover from shocks, and health is not distributed according to wealth, race, geography, disability, or political neglect.
Stocks, Flows, and Health Conditions
Public health systems contain stocks and flows. Stocks are accumulated conditions: population immunity, chronic disease burden, hospital capacity, public trust, workforce capacity, housing quality, community resilience, environmental contamination, food insecurity, trauma, social connection, institutional memory, and health knowledge. Flows change those stocks: infection, recovery, vaccination, exposure, prevention, investment, burnout, migration, learning, misinformation, care delivery, and policy change.
Stock-flow thinking is essential because many health outcomes accumulate slowly. Chronic disease burden can grow through years of exposure to poor diet, stress, pollution, unsafe work, inadequate care, and neighborhood conditions. Public trust can decline through repeated institutional failure and rebuild only through repeated reliability. Hospital workforce capacity can be depleted through burnout faster than training pipelines can replenish it. Environmental contamination can accumulate before its health effects are fully visible.
H_{t+1} = H_t + P_t – E_t – D_t
\]
Interpretation: A population health stock \(H\) grows through prevention and protective conditions \(P_t\), and declines through exposure \(E_t\) and disease burden \(D_t\).
Stock-flow thinking also explains why downstream systems become overloaded. If prevention, primary care, housing, food security, and environmental protection are underbuilt, illness flows into clinics, emergency departments, hospitals, shelters, schools, workplaces, and families. The overload appears in the healthcare system, but its causes may be upstream. A hospital bed shortage may be partly a housing problem, a labor problem, a chronic disease problem, a public-health funding problem, and a trust problem.
| Public health stock | Inflow | Outflow or depletion | Systems concern |
|---|---|---|---|
| Population immunity | Vaccination, prior infection, protective public-health measures | Waning immunity, immune escape, low uptake | Immunity is unevenly distributed and affected by access and trust. |
| Hospital capacity | Staffing, beds, supplies, coordination, investment | Surge demand, burnout, supply shortages, delayed discharge | Capacity can fail when multiple pressures arrive together. |
| Public trust | Reliable service, honest communication, fairness, repair | Misinformation, exclusion, broken promises, opaque decisions | Trust affects cooperation, reporting, care-seeking, and uptake of interventions. |
| Chronic disease burden | Long-term exposure, stress, poor nutrition, inactivity, pollution | Prevention, care, environmental improvement, social support | Burden reflects social and environmental systems, not only individual behavior. |
| Environmental exposure | Pollution, heat, toxins, unsafe water, workplace hazards | Regulation, remediation, infrastructure, prevention | Exposure is often concentrated in communities with less political power. |
Public health policy often focuses on visible flows: hospital admissions, cases, deaths, service use, vaccination visits, emergency calls, or program enrollment. These measures matter, but systems thinking asks what stocks are changing beneath them. Is prevention capacity growing? Is trust improving? Is exposure declining? Is workforce capacity replenishing? Is chronic disease burden falling? Is community resilience increasing? Without attention to stocks, public health can become reactive and crisis-driven.
Feedback Loops in Public Health
Feedback loops shape public health outcomes. Some feedback loops improve health. Others worsen disease, distrust, overload, and inequality. A reinforcing loop can amplify vulnerability: poor housing increases illness, illness reduces income, lower income worsens housing options, and worse housing increases illness. A balancing loop can stabilize health: disease surveillance detects outbreak growth, public-health response reduces transmission, and case numbers decline.
One of the most important public-health feedback loops connects trust and cooperation. Trust supports care-seeking, vaccination, testing, reporting, and adherence to guidance. These behaviors improve health outcomes. Better outcomes and reliable institutions can build trust. The reverse also occurs. Distrust reduces participation, lower participation worsens outcomes, and poor outcomes confirm distrust.
\text{Trust} \uparrow \Rightarrow \text{Cooperation} \uparrow \Rightarrow \text{Health Outcomes} \uparrow \Rightarrow \text{Trust} \uparrow
\]
Interpretation: Trust can form a reinforcing loop that strengthens public-health cooperation and outcomes over time.
Another loop links healthcare overload and workforce capacity. Rising illness increases demand for care. Higher demand increases workload. Excessive workload increases burnout and turnover. Burnout and turnover reduce care capacity. Reduced capacity worsens delays and outcomes, which increases pressure on the remaining system. This loop can turn a health surge into a capacity crisis.
Prevention often works through delayed feedback. Clean water, vaccination, nutrition, housing, air-quality regulation, maternal care, and injury prevention reduce future disease burden. But because prevented illness is less visible than treated illness, prevention can be underfunded. Underfunded prevention allows disease burden to grow, increasing downstream costs, which then consumes resources that could have supported prevention. This is a shifting-the-burden pattern.
| Feedback loop | Direction | Public health effect | Leverage point |
|---|---|---|---|
| Trust-cooperation loop | Reinforcing | Trust improves participation, which improves outcomes and reinforces trust. | Reliable service, transparency, community partnership, repair after harm. |
| Overload-burnout loop | Reinforcing harmful | Demand increases burnout, reducing capacity and worsening demand pressure. | Staffing, prevention, surge capacity, recovery time, workload redesign. |
| Prevention-delay loop | Balancing but delayed | Prevention reduces future disease, but benefits may be politically invisible. | Leading indicators, long-term funding, public-health memory. |
| Misinformation loop | Reinforcing harmful | Distrust increases misinformation susceptibility, which further reduces trust. | Trusted messengers, community relationships, transparent correction. |
| Poverty-health loop | Reinforcing harmful | Poverty worsens health, poor health reduces income stability, and vulnerability grows. | Income support, housing, food security, healthcare access, worker protections. |
Feedback loops reveal why public health requires structural intervention. A health system cannot only treat the output of harmful loops. It must change the loops themselves: reduce exposure, strengthen prevention, build trust, protect workers, improve housing, regulate hazards, support income, and preserve public-health infrastructure before crisis.
Social Determinants and Structural Vulnerability
Social determinants of health are the conditions in which people are born, grow, live, work, age, and participate in society. They include housing, income, education, work, food, transportation, safety, social support, discrimination, environment, and access to care. These determinants are not background context. They are causal structures that produce health outcomes.
Structural vulnerability refers to the ways social, economic, political, and institutional arrangements place some groups at greater risk. Vulnerability is not merely personal weakness or unfortunate circumstance. It is produced by systems: segregation, poverty, environmental racism, underinvestment, unsafe work, disability exclusion, gendered care burdens, immigration status, legal barriers, food systems, housing markets, and unequal political power.
Public health systems thinking treats vulnerability as patterned, not random. If asthma, diabetes, maternal mortality, heat mortality, lead exposure, food insecurity, or infectious disease burden is concentrated in particular communities, the systems question is why. What exposures are higher? What protections are weaker? What services are less accessible? What histories of harm shape trust? What policies produced the spatial and social pattern?
\text{Health Risk}_g = \text{Exposure}_g \times \text{Vulnerability}_g \div \text{Protective Capacity}_g
\]
Interpretation: Health risk for group \(g\) rises with exposure and vulnerability, and falls when protective capacity is strong.
| Structural condition | Health pathway | Systems implication |
|---|---|---|
| Housing instability | Stress, exposure, crowding, interrupted care, displacement | Housing policy is public health policy. |
| Food insecurity | Malnutrition, chronic disease, stress, child development risk | Food systems and income supports shape population health. |
| Air pollution | Respiratory disease, cardiovascular risk, pregnancy and child health effects | Environmental regulation and land use are health interventions. |
| Unsafe work | Injury, toxic exposure, stress, infection risk, heat risk | Labor policy and occupational protections are public health infrastructure. |
| Transportation barriers | Delayed care, limited food access, social isolation, job instability | Mobility systems affect health access and opportunity. |
| Discrimination | Stress, exclusion, care disparities, institutional distrust | Health equity requires changing institutions, not only expanding services. |
Social determinants show why public health is inherently cross-sector. Health departments alone cannot control housing markets, wages, air pollution, school quality, transportation, food systems, or workplace safety. But public health can make health consequences visible, coordinate across sectors, advocate for prevention, and help design policies that reduce exposure and vulnerability.
A systems approach to social determinants does not mean blaming everything on society in a vague way. It means tracing specific causal pathways: which policy, market, infrastructure, institutional, or environmental relationships produce health risk, and where intervention can change the pattern.
Infectious Disease as System Dynamics
Infectious disease is one of the clearest examples of system dynamics in public health. Disease transmission depends on contact patterns, susceptibility, infectiousness, immunity, behavior, vaccination, testing, isolation, ventilation, crowding, travel, work conditions, schools, public trust, information, and care access. A pathogen has biological properties, but outbreaks are shaped by social systems.
Basic epidemic models often divide populations into susceptible, infected, and recovered groups. These are stocks. Infection moves people from susceptible to infected. Recovery moves people from infected to recovered. Vaccination can move people out of susceptibility or reduce severe disease. Behavior, policy, immunity, and trust alter the flows. Healthcare capacity affects outcomes once people are infected.
S \rightarrow I \rightarrow R
\]
Interpretation: A simple infectious disease model tracks flows from susceptible \(S\), to infected \(I\), to recovered \(R\), while real systems add vaccination, behavior, care capacity, trust, and inequality.
Transmission is not evenly distributed. People living in crowded housing, working public-facing jobs, lacking paid sick leave, relying on public transit, or lacking access to care may face higher exposure. People with chronic illness, disability, age-related risk, or limited healthcare access may face higher consequences. Public health guidance that assumes people can isolate, work remotely, access testing, or take time off may fail when those options are unequally available.
Infectious disease also reveals the importance of timing. Early action can prevent exponential growth. Delayed action can allow infections to multiply, increasing hospital demand and making later intervention more disruptive. Surveillance, testing, communication, vaccination, ventilation, and trust all affect timing. Systems thinking helps explain why small delays can have large effects when reinforcing transmission loops are active.
Disease control is therefore not only biomedical. It is infrastructural and social. Ventilation, housing, paid leave, community health workers, trusted communication, primary care, data systems, schools, workplaces, and public benefits all shape disease dynamics. A public-health system that ignores social conditions will repeatedly misunderstand transmission.
Chronic Disease and Long-Term Exposure
Chronic disease is also a systems problem, but it often unfolds through slower dynamics than infectious disease. Cardiovascular disease, diabetes, asthma, cancer, chronic kidney disease, depression, anxiety, and other long-term conditions reflect interactions among genetics, behavior, stress, food systems, pollution, housing, work, healthcare, trauma, physical activity, neighborhood design, and social support. These exposures accumulate across time.
Chronic disease burden often appears as individual diagnosis, but its distribution reveals system structure. If chronic illness is concentrated in particular neighborhoods or groups, the cause is not simply personal choice. It may involve food environments, unsafe air, heat exposure, occupational risk, stress from poverty or discrimination, lack of preventive care, poor housing, limited green space, transportation barriers, or targeted marketing of harmful products.
Long-term exposure produces delayed feedback. Air pollution may affect respiratory and cardiovascular health over years. Childhood lead exposure may affect development and lifelong outcomes. Food insecurity may affect chronic disease risk and child development. Chronic stress can affect mental and physical health. Delays make causality harder to see politically, but the body remembers exposures that policy ignores.
\text{Chronic Disease Burden}_{t+1} = \text{Burden}_t + \text{Exposure}_t – \text{Prevention}_t – \text{Effective Care}_t
\]
Interpretation: Chronic disease burden grows when exposure exceeds prevention and effective care over time.
Prevention must therefore be structural. Advice to exercise matters, but neighborhood safety, sidewalks, parks, work schedules, disability access, and time poverty also matter. Nutrition education matters, but food prices, wages, school meals, marketing, transportation, and grocery access matter. Medical screening matters, but insurance, trust, language, transportation, and paid leave matter. Public health systems thinking asks what conditions make healthy life possible.
Chronic disease also affects system capacity. High chronic disease burden increases demand for care, disability support, caregiving, medication, emergency services, and social assistance. If prevention is underfunded, downstream care systems absorb rising pressure. This is why chronic disease prevention is not merely a wellness issue. It is a resilience strategy for households, healthcare systems, employers, communities, and public budgets.
Healthcare Capacity and System Stress
Healthcare capacity is a public health stock. It includes beds, clinicians, nurses, public-health workers, laboratories, supply chains, emergency services, primary care, mental health services, community clinics, data systems, communication systems, and institutional coordination. Capacity is not simply the number of facilities. It is the ability of the care system to respond to need without degrading quality, access, or workforce wellbeing.
Healthcare systems can become stressed when demand exceeds capacity. Demand may rise because of outbreaks, heat waves, disasters, chronic disease, delayed care, aging populations, mental health crises, substance use, violence, or loss of primary care access. Capacity may decline because of staffing shortages, burnout, supply-chain disruptions, underfunding, administrative burden, fragmented systems, or infrastructure failure.
\text{Care Stress}_t = \frac{\text{Demand}_t}{\text{Capacity}_t}
\]
Interpretation: Care-system stress rises when demand grows faster than clinical, public-health, workforce, and infrastructure capacity.
Care capacity is shaped upstream. If housing instability, pollution, food insecurity, heat exposure, and chronic disease increase, healthcare demand rises. If primary care and prevention are weak, emergency departments receive more downstream pressure. If public-health departments lack capacity, outbreaks grow before intervention. If mental health services are inaccessible, crises appear in emergency, school, policing, and shelter systems. The care system becomes the endpoint of failures elsewhere.
Healthcare stress creates feedback loops. Overload increases burnout. Burnout reduces workforce capacity. Reduced capacity increases waiting and worsens outcomes. Poor outcomes increase public frustration and staff moral distress. Turnover increases workload for those who remain. This can create a reinforcing loop of capacity depletion.
| Capacity element | How it supports public health | Failure mode when depleted |
|---|---|---|
| Primary care | Prevention, chronic disease management, early detection | Delayed care, emergency reliance, worse outcomes |
| Public-health workforce | Surveillance, outreach, vaccination, inspection, emergency response | Slow detection, weak prevention, poor crisis coordination |
| Hospital staff | Acute care, intensive care, emergency response | Burnout, delays, quality decline, reduced surge capacity |
| Laboratory systems | Testing, surveillance, outbreak detection | Delayed diagnosis, blind spots, slow response |
| Supply chains | Medication, equipment, protective gear, vaccines | Shortages, rationing, unequal access |
| Community care networks | Trust, navigation, prevention, culturally grounded support | Low uptake, mistrust, isolation, access gaps |
Public health systems thinking therefore treats healthcare capacity as both downstream service and upstream signal. When care systems are overwhelmed, the question is not only how to add beds. It is why demand exceeded capacity, what upstream systems failed, what workforce stocks were depleted, and what prevention investments would reduce future stress.
Public Trust, Communication, and Cooperation
Public trust is a central stock in public health. It affects whether people seek care, report symptoms, accept vaccination, follow guidance, share information, participate in testing, trust risk communication, and cooperate during emergencies. Trust is built through reliability, respect, transparency, competence, accountability, inclusion, and repair. It is depleted through broken promises, discrimination, confusion, coercion, misinformation, inaccessible services, and institutional harm.
Communication is important, but communication cannot substitute for trustworthiness. Public-health institutions sometimes treat mistrust as an information deficit. But people may distrust institutions because of lived experience, historical abuse, unequal treatment, opaque decisions, changing guidance without explanation, political manipulation, or everyday administrative burden. Trust is not restored by messaging alone. It is restored by trustworthy behavior.
T_{t+1} = T_t + R_t + F_t + A_t – H_t – O_t – B_t
\]
Interpretation: Public trust \(T\) grows through reliability \(R_t\), fairness \(F_t\), and accountability \(A_t\), and declines through harm \(H_t\), opacity \(O_t\), and burden \(B_t\).
Public-health communication must also operate through networks. People often trust local clinicians, community leaders, family, faith institutions, schools, coworkers, and peer networks more than distant agencies. Trusted messengers matter because information travels through relationships. However, public institutions should not use trusted messengers as a substitute for fixing the conditions that caused distrust. Community partnership should include authority, resources, feedback, and accountability.
Compliance is also system-shaped. People cannot follow public-health guidance if they lack paid leave, safe housing, transportation, childcare, food, water, protective equipment, or healthcare access. Asking people to isolate without income support shifts public-health burden onto households. Asking workers to avoid exposure without workplace protections shifts responsibility away from employers and institutions. Systems thinking asks what conditions make cooperation possible.
Public trust is therefore public-health infrastructure. A society that underinvests in trust will have weaker outbreak response, lower uptake of prevention, less effective communication, and more difficulty coordinating collective action during crisis.
Environment, Climate, and Public Health
Environmental conditions are public-health conditions. Air pollution, unsafe water, toxic exposure, heat, flooding, wildfire smoke, pesticides, noise, mold, poor housing quality, industrial hazards, and climate change all affect health. These exposures are often distributed unequally because of land use, housing policy, labor markets, environmental regulation, infrastructure, race, class, and political power.
Climate change is a public-health multiplier. Heat increases mortality risk, cardiovascular stress, kidney stress, pregnancy risk, occupational danger, and mental health strain. Flooding can contaminate water, damage housing, displace families, and spread mold. Drought can affect food prices, water quality, nutrition, and livelihoods. Wildfire smoke can travel long distances and worsen respiratory and cardiovascular disease. Storms can disrupt electricity, medical devices, hospitals, supply chains, and emergency response.
\text{Health Risk} = \text{Hazard} \times \text{Exposure} \times \text{Vulnerability}
\]
Interpretation: Climate and environmental health risk depends on the hazard, who is exposed, and the vulnerability or protective capacity of exposed populations.
Environmental public health also reveals delayed effects. Lead exposure, air pollution, toxic contamination, unsafe water, and heat exposure can produce health effects long after exposure begins. Environmental harm may be normalized until cumulative disease patterns become visible. By then, the affected community may have already absorbed years of preventable harm.
Systems thinking connects environmental health to infrastructure and governance. Heat risk is shaped by tree canopy, housing quality, energy access, urban design, labor protections, public cooling, and emergency communication. Water safety is shaped by pipes, treatment, monitoring, watershed protection, regulation, and public trust. Air quality is shaped by transportation, industry, energy, zoning, enforcement, and land use. Climate resilience is shaped by housing, healthcare, emergency services, public finance, and community capacity.
Public health cannot be separated from environmental stewardship. A society that degrades air, water, climate, soil, and ecosystems is also degrading the conditions of human health.
Governance, Prevention, and Institutional Learning
Public health depends on governance systems capable of prevention, coordination, accountability, and learning. Health departments, hospitals, schools, housing agencies, environmental regulators, emergency managers, labor agencies, food systems, water utilities, local governments, community organizations, and national institutions all shape public health. The challenge is that health outcomes cross institutional boundaries while governance is often siloed.
Prevention is especially vulnerable to underinvestment because its success is often invisible. When prevention works, illness, outbreak, injury, contamination, or disaster does not happen. Political systems may reward visible crisis response more than quiet prevention. Budgets may cut public-health capacity during calm periods and then demand emergency performance during crisis. This creates a cycle of underpreparedness.
Institutional learning is essential. Public-health systems must learn from outbreaks, disasters, community feedback, surveillance, inequity data, communication failures, workforce burnout, and environmental warning signs. Learning requires memory: documentation, evaluation, public accountability, data systems, community testimony, and authority to change policy. Without memory, public health repeats avoidable mistakes.
| Governance function | Public health role | Systems failure when weak |
|---|---|---|
| Surveillance | Detects disease, exposure, injury, and risk patterns | Problems grow before institutions see them. |
| Prevention funding | Maintains capacity before crisis | Systems become reactive and emergency-driven. |
| Cross-sector coordination | Connects health with housing, labor, food, water, environment, and schools | Institutions optimize locally while population health suffers. |
| Community participation | Brings lived knowledge, trust, and accountability into design | Policies miss barriers, histories, and practical realities. |
| Institutional memory | Preserves lessons, commitments, failures, and warnings | Public systems repeat mistakes after leadership or funding changes. |
| Accountability | Ensures harm is acknowledged, repaired, and prevented | Trust declines and feedback stops reaching authority. |
Public-health governance also requires humility. Public-health systems operate under uncertainty, and guidance may change as evidence changes. Institutions must explain uncertainty honestly, preserve public trust, and correct errors without defensiveness. A learning public-health system does not pretend to be infallible. It demonstrates that it can listen, revise, repair, and improve.
Prevention and learning are not soft capacities. They are core infrastructure for population survival.
Equity, Power, and Health Justice
Health inequity is not merely difference. It is the patterned distribution of illness, exposure, care, protection, and premature death through social power. Communities do not become unhealthy by accident. Health patterns reflect housing, labor, environmental exposure, policing, food systems, income, education, transportation, healthcare, political voice, and historical policy. Public health systems thinking therefore requires power analysis.
Power shapes whose illness is noticed, whose data is collected, whose pain is believed, whose neighborhoods are protected, whose water is safe, whose workplace is regulated, whose language is served, whose disability access is designed, whose health knowledge counts, and whose death is treated as preventable. A public-health system that ignores power may reproduce the inequalities it claims to measure.
Health justice asks how public systems can reduce avoidable and unjust health differences. It includes access to care, but it also includes safe housing, clean air, clean water, food security, labor protections, disability justice, reproductive justice, environmental justice, mental health, community safety, and democratic participation. It requires moving upstream to the systems that produce vulnerability.
\text{Health Equity} = \text{Reduced Exposure Inequality} + \text{Improved Access} + \text{Redistributed Protective Capacity} + \text{Accountable Governance}
\]
Interpretation: Health equity requires reducing unequal exposure, improving access, redistributing protective capacity, and making governance accountable.
Equity also affects public-health performance. If communities distrust institutions, surveillance weakens. If people lack access to care, disease is detected later. If workers cannot stay home when sick, transmission increases. If households lack energy or cooling, heat risk rises. If people face language barriers, guidance fails. If disabled people are excluded from emergency planning, disasters become more dangerous. Health justice is not only a moral concern; it is a system condition for effective public health.
Public health systems should measure not only average outcomes, but distribution. Who has the highest exposure? Who has the lowest access? Who faces the greatest administrative burden? Who is missing from data? Who experiences repeated institutional harm? Who has decision authority? Aggregate improvement can hide deepening inequity if distribution is ignored.
A public-health system is not successful if it improves averages while leaving structural vulnerability intact.
Ethics: Dignity, Care, and Collective Responsibility
Public health is ethical because it concerns the conditions of life itself: breath, water, food, shelter, care, safety, movement, work, community, and survival. Public-health decisions affect who is protected, who is exposed, who is asked to sacrifice, who receives care, who is blamed, and whose suffering is treated as preventable. Ethics cannot be added after technical analysis. It is embedded in the boundaries, metrics, policies, and trade-offs of the system.
Dignity is central. People should not be treated as vectors, burdens, statistics, compliance problems, or risk categories alone. Public health must protect populations while respecting persons. This means clear communication, accessible services, privacy, non-discrimination, meaningful participation, language access, disability access, informed consent, fair allocation, and accountability for harm.
Collective responsibility is also central. Public health requires shared action because health conditions are shared. Clean air, safe water, vaccination, sanitation, outbreak control, food safety, emergency preparedness, and climate adaptation depend on institutions and communities acting together. But collective responsibility should not become a way to shift institutional failure onto individuals. People cannot be expected to make healthy choices inside unhealthy systems without support.
Ethical public-health questions include:
- Who is exposed to preventable harm?
- Who has access to care, prevention, information, and support?
- Who carries the burden of public-health guidance?
- Who is blamed for outcomes produced by structural conditions?
- Who is missing from data?
- Whose knowledge shapes policy?
- What histories of harm shape trust?
- How are scarce resources allocated?
- What privacy and autonomy protections are needed?
- How are public institutions held accountable when they fail?
Public health ethics also requires balancing individual freedom and collective protection. This balance cannot be solved abstractly. It depends on severity, evidence, proportionality, alternatives, transparency, equity, and trust. Measures that restrict behavior should be justified, limited, accountable, and paired with support. People should not be asked to comply with public-health rules while lacking the material conditions that make compliance possible.
The ethical aim of public health is not control for its own sake. It is collective care: building systems in which people can live healthy, dignified, and flourishing lives together.
Examples Across Public Health Systems
Public health systems thinking applies across many domains. The examples below show how health outcomes emerge from interacting systems rather than isolated causes.
Heat waves
Heat waves affect public health through climate, housing, tree canopy, energy access, occupational exposure, age, disability, social isolation, public communication, cooling centers, and emergency services. Heat mortality is not only a weather outcome. It is shaped by urban design, inequality, labor protections, housing quality, electricity reliability, and social support.
Asthma and air pollution
Asthma patterns reflect air quality, housing, traffic, industrial siting, indoor mold, occupational exposure, healthcare access, medication affordability, and environmental regulation. Treating asthma clinically matters, but public health must also reduce exposure and address the land-use and policy systems that concentrate pollution.
Vaccination campaigns
Vaccination depends on supply chains, clinics, cold storage, staffing, communication, trust, transportation, paid leave, language access, data systems, and community relationships. Low uptake may reflect access barriers or mistrust rather than ignorance. A systems approach designs around real barriers.
Maternal health
Maternal health reflects clinical care, racism, income, housing, nutrition, stress, transportation, insurance, birth support, hospital quality, postpartum care, and respectful treatment. Disparities reveal institutional and structural failures, not only individual medical risk.
Food insecurity
Food insecurity affects nutrition, chronic disease, child development, stress, and mental health. It is shaped by wages, food prices, housing costs, transportation, benefits, school meals, local food access, and agricultural systems. Food security is public health infrastructure.
Substance use and overdose
Substance use and overdose involve trauma, mental health, pain, labor markets, housing, criminalization, drug supply, treatment access, stigma, social isolation, and policy. Systems thinking asks how harm reduction, care, housing, income, and community support interact.
Water safety
Water safety depends on infrastructure, treatment, watershed protection, corrosion control, monitoring, governance, public trust, affordability, and environmental justice. Unsafe water is not only a technical failure. It is often an institutional and political failure.
Pandemic preparedness
Pandemic preparedness depends on surveillance, laboratories, hospitals, public-health workforce, supply chains, paid leave, schools, workplace protections, public trust, communication, global cooperation, and institutional memory. Preparedness built during calm periods determines response during crisis.
Across these examples, health is not located only inside bodies. It is produced through systems that shape exposure, protection, care, trust, and capacity.
Mathematics, Computation, and Modeling
Public health systems can be modeled through stock-flow models, infectious disease models, capacity models, exposure models, social determinant indices, risk models, network analysis, agent-based simulation, scenario analysis, and health equity dashboards. Models do not replace lived experience or clinical expertise. They help make assumptions, feedback loops, delays, distribution, and system constraints visible.
A simple infectious disease stock-flow model can be represented as:
S_{t+1} = S_t – \beta S_t I_t
\]
\[
I_{t+1} = I_t + \beta S_t I_t – \gamma I_t
\]
\[
R_{t+1} = R_t + \gamma I_t
\]
Interpretation: Susceptible people become infected through transmission, infected people recover, and the population shifts among health states over time.
Healthcare capacity stress can be represented as:
CS_t = \frac{D_t}{C_t}
\]
Interpretation: Care stress \(CS_t\) rises when demand \(D_t\) exceeds available capacity \(C_t\).
Public trust can be modeled as a stock:
T_{t+1} = T_t + R_t + A_t – H_t – M_t – B_t
\]
Interpretation: Trust \(T\) grows through reliability and accountability, and declines through harm, misinformation, and burden.
Public-health risk can be represented as:
R_g = H_g \times E_g \times V_g \div P_g
\]
Interpretation: Risk for group \(g\) depends on hazard, exposure, vulnerability, and protective capacity.
A prevention value model can be represented as:
PV = AvertedDisease + AvertedCost + AvertedBurden + ImprovedEquity
\]
Interpretation: Prevention value includes avoided illness, avoided cost, avoided burden, and improvements in equity, even when prevented harms are less visible than treated cases.
| Modeling task | Public health question | Example output |
|---|---|---|
| Infectious disease modeling | How do transmission, immunity, and intervention timing affect spread? | Case trajectories, peak demand, and intervention comparison. |
| Capacity modeling | When does demand exceed care or public-health capacity? | Capacity stress, overload days, staffing needs, and surge scenarios. |
| Trust dynamics modeling | How does trust affect cooperation and uptake? | Trust trajectories and participation scenarios. |
| Social determinant indexing | Which communities face compounded vulnerability? | Composite vulnerability, exposure, and protective-capacity measures. |
| Environmental exposure modeling | Who is exposed to heat, pollution, unsafe water, or toxins? | Exposure maps, burden tables, and equity diagnostics. |
| Prevention scenario analysis | How does upstream investment reduce downstream burden? | Prevented cases, reduced care stress, improved equity, and avoided cost. |
Public-health models should be transparent about assumptions, data quality, missing populations, uncertainty, and ethical use. A model can help reveal inequity, but it can also hide it if categories are poorly chosen, data is incomplete, or historical harm is ignored. Systems modeling should support public learning and accountable decision-making, not replace community knowledge or professional judgment.
Python Workflow: Disease Dynamics, Care Capacity, Trust, and Intervention Scenarios
The Python workflow below turns public health systems analysis into a small reproducible stock-flow and scenario model. It compares four scenarios: baseline reactive response, delayed intervention, trust-centered prevention, and integrated equity and capacity strategy. It also includes one-at-a-time sensitivity analysis for the integrated equity and capacity scenario. The script uses only the Python standard library, writes CSV outputs relative to the article folder, and is designed as a clear starting point for companion repository work.
# public_health_as_a_system_workflow.py
# Dependency-light workflow for public-health systems diagnostics:
# infectious disease dynamics, care-capacity stress, public trust, prevention,
# structural vulnerability, environmental exposure, climate risk, institutional learning,
# and equity-centered intervention scenarios.
# Writes outputs relative to the article root.

from __future__ import annotations

from dataclasses import dataclass, replace
from pathlib import Path
import csv
from statistics import mean

ARTICLE_ROOT = Path(__file__).resolve().parents[1]
TABLES = ARTICLE_ROOT / "outputs" / "tables"


@dataclass
class PublicHealthScenario:
    name: str
    population: int
    initial_infected: int
    transmission_rate: float
    recovery_rate: float
    severe_case_rate: float
    prevention_strength: float
    public_trust_initial: float
    trust_gain: float
    trust_loss_from_overload: float
    care_capacity_initial: float
    care_capacity_investment: float
    vulnerability_index: float
    environmental_exposure: float
    climate_stress: float
    social_support_capacity: float
    primary_care_access: float
    equity_capacity: float
    institutional_learning: float
    intervention_delay: float


def clamp(value: float, low: float = 0.0, high: float = 140.0) -> float:
    return max(low, min(high, value))


def run_scenario(scenario: PublicHealthScenario, weeks: int = 80) -> list[dict[str, object]]:
    susceptible = float(scenario.population - scenario.initial_infected)
    infected = float(scenario.initial_infected)
    recovered = 0.0
    cumulative_infections = float(scenario.initial_infected)
    public_trust = scenario.public_trust_initial
    care_capacity = scenario.care_capacity_initial
    prevention_stock = 28.0 + scenario.prevention_strength * 18.0
    primary_care_stock = 32.0 + scenario.primary_care_access * 18.0
    social_support_stock = 32.0 + scenario.social_support_capacity * 18.0
    institutional_learning_stock = 30.0 + scenario.institutional_learning * 18.0
    vulnerability_stock = 42.0 + scenario.vulnerability_index * 0.35 - scenario.equity_capacity * 8.0
    workforce_stress_stock = 22.0
    rows: list[dict[str, object]] = []

    delay_weeks = int(round(scenario.intervention_delay * 16.0))

    for week in range(weeks + 1):
        intervention_active = week >= delay_weeks

        prevention_effort = scenario.prevention_strength if intervention_active else scenario.prevention_strength * 0.20
        trust_repair = scenario.trust_gain if intervention_active else scenario.trust_gain * 0.20
        capacity_investment = scenario.care_capacity_investment if intervention_active else scenario.care_capacity_investment * 0.25
        equity_effort = scenario.equity_capacity if intervention_active else scenario.equity_capacity * 0.30
        learning_effort = scenario.institutional_learning if intervention_active else scenario.institutional_learning * 0.30
        primary_care_effort = scenario.primary_care_access if intervention_active else scenario.primary_care_access * 0.35
        support_effort = scenario.social_support_capacity if intervention_active else scenario.social_support_capacity * 0.35

        access_barrier = clamp(
            vulnerability_stock * 0.12
            + scenario.environmental_exposure * 8.0
            + scenario.climate_stress * 7.0
            - equity_effort * 6.0
            - primary_care_stock * 0.05
            - social_support_stock * 0.04,
            0.0,
            100.0,
        )

        cooperation_effect = clamp(public_trust / 100.0 + social_support_stock * 0.002, 0.0, 1.0)

        effective_transmission = clamp(
            scenario.transmission_rate
            * (1.0 - prevention_effort * 0.55)
            * (1.0 - cooperation_effect * 0.30)
            * (1.0 + access_barrier * 0.004)
            * (1.0 + scenario.climate_stress * 0.08),
            0.01,
            1.2,
        )

        new_infections = min(susceptible, effective_transmission * susceptible * infected / max(1.0, scenario.population))
        recoveries = min(infected, scenario.recovery_rate * infected * (1.0 + primary_care_stock * 0.001))

        susceptible -= new_infections
        infected += new_infections - recoveries
        recovered += recoveries
        cumulative_infections += new_infections

        exposure_severity = clamp(
            1.0
            + scenario.environmental_exposure * 0.18
            + scenario.climate_stress * 0.14
            + vulnerability_stock * 0.0025
            - equity_effort * 0.04
            - primary_care_stock * 0.0009,
            0.70,
            1.80,
        )

        severe_cases = infected * scenario.severe_case_rate * exposure_severity
        care_stress = severe_cases / max(1.0, care_capacity)

        prevention_flow = clamp(
            prevention_effort * 12.0
            + primary_care_effort * 8.0
            + support_effort * 7.0
            + equity_effort * 6.0
            + learning_effort * 5.0
            - scenario.climate_stress * 4.0
            - scenario.environmental_exposure * 3.0,
            0.0,
            100.0,
        )

        capacity_flow = clamp(
            capacity_investment * 14.0
            + primary_care_effort * 7.0
            + learning_effort * 6.0
            + social_support_stock * 0.04
            - care_stress * 8.0
            - workforce_stress_stock * 0.08,
            0.0,
            100.0,
        )

        trust_flow = clamp(
            trust_repair * 12.0
            + equity_effort * 7.0
            + learning_effort * 5.0
            + max(0.0, 1.0 - care_stress) * 5.0
            - care_stress * scenario.trust_loss_from_overload
            - access_barrier * 0.06,
            -40.0,
            60.0,
        )

        learning_flow = clamp(
            learning_effort * 12.0
            + prevention_flow * 0.05
            + capacity_flow * 0.05
            + max(0.0, care_stress - 0.85) * 4.0
            - scenario.intervention_delay * 4.0,
            0.0,
            100.0,
        )

        prevention_stock = clamp(
            prevention_stock
            + prevention_flow * 0.08
            - new_infections / max(1.0, scenario.population) * 80.0
            - scenario.intervention_delay * 0.2,
            0.0,
            120.0,
        )

        primary_care_stock = clamp(
            primary_care_stock
            + primary_care_effort * 1.0
            + capacity_flow * 0.04
            - workforce_stress_stock * 0.025,
            0.0,
            120.0,
        )

        social_support_stock = clamp(
            social_support_stock
            + support_effort * 1.0
            + equity_effort * 0.8
            - vulnerability_stock * 0.025
            - access_barrier * 0.02,
            0.0,
            120.0,
        )

        institutional_learning_stock = clamp(
            institutional_learning_stock
            + learning_flow * 0.09
            + learning_effort * 0.8
            - scenario.intervention_delay * 0.3,
            0.0,
            120.0,
        )

        care_capacity = clamp(
            care_capacity
            + capacity_flow * 0.55
            + primary_care_stock * 0.03
            - care_stress * 2.2
            - workforce_stress_stock * 0.18,
            1.0,
            scenario.care_capacity_initial * 1.75,
        )

        workforce_stress_stock = clamp(
            workforce_stress_stock
            + care_stress * 2.6
            + infected / max(1.0, scenario.population) * 18.0
            - capacity_flow * 0.07
            - social_support_stock * 0.02,
            0.0,
            120.0,
        )

        public_trust = clamp(
            public_trust + trust_flow * 0.12,
            0.0,
            100.0,
        )

        vulnerability_stock = clamp(
            vulnerability_stock
            + scenario.environmental_exposure * 0.6
            + scenario.climate_stress * 0.6
            + access_barrier * 0.04
            + care_stress * 0.5
            - equity_effort * 1.1
            - social_support_stock * 0.03
            - primary_care_stock * 0.025,
            0.0,
            120.0,
        )

        health_risk_index = clamp(
            infected / max(1.0, scenario.population) * 180.0
            + care_stress * 22.0
            + vulnerability_stock * 0.18
            + access_barrier * 0.10
            + scenario.environmental_exposure * 5.0
            + scenario.climate_stress * 5.0
            - public_trust * 0.10
            - prevention_stock * 0.06,
            0.0,
            100.0,
        )

        prevention_value_index = clamp(
            prevention_stock * 0.20
            + primary_care_stock * 0.16
            + social_support_stock * 0.14
            + institutional_learning_stock * 0.12
            + public_trust * 0.12
            + equity_effort * 8.0
            - care_stress * 10.0
            - vulnerability_stock * 0.10
            - workforce_stress_stock * 0.08,
            0.0,
            100.0,
        )

        public_health_resilience_score = clamp(
            prevention_value_index * 0.22
            + care_capacity / max(1.0, scenario.care_capacity_initial) * 18.0
            + public_trust * 0.14
            + institutional_learning_stock * 0.14
            + social_support_stock * 0.10
            + primary_care_stock * 0.10
            + equity_effort * 8.0
            - health_risk_index * 0.18
            - care_stress * 12.0
            - vulnerability_stock * 0.10
            - workforce_stress_stock * 0.08,
            0.0,
            100.0,
        )

        rows.append({
            "week": week,
            "scenario": scenario.name,
            "intervention_active": intervention_active,
            "susceptible": round(susceptible, 3),
            "infected": round(infected, 3),
            "recovered": round(recovered, 3),
            "new_infections": round(new_infections, 3),
            "cumulative_infections": round(cumulative_infections, 3),
            "severe_cases": round(severe_cases, 3),
            "care_capacity": round(care_capacity, 3),
            "care_stress": round(care_stress, 3),
            "public_trust": round(public_trust, 3),
            "prevention_stock": round(prevention_stock, 3),
            "primary_care_stock": round(primary_care_stock, 3),
            "social_support_stock": round(social_support_stock, 3),
            "institutional_learning_stock": round(institutional_learning_stock, 3),
            "vulnerability_stock": round(vulnerability_stock, 3),
            "access_barrier": round(access_barrier, 3),
            "workforce_stress_stock": round(workforce_stress_stock, 3),
            "health_risk_index": round(health_risk_index, 3),
            "prevention_value_index": round(prevention_value_index, 3),
            "public_health_resilience_score": round(public_health_resilience_score, 3),
        })

    return rows


def summarize(rows: list[dict[str, object]]) -> list[dict[str, object]]:
    output: list[dict[str, object]] = []
    for scenario_name in sorted({row["scenario"] for row in rows}):
        subset = [row for row in rows if row["scenario"] == scenario_name]
        final = subset[-1]
        peak_infected = max(float(row["infected"]) for row in subset)
        peak_care_stress = max(float(row["care_stress"]) for row in subset)
        min_trust = min(float(row["public_trust"]) for row in subset)
        avg_risk = mean(float(row["health_risk_index"]) for row in subset)
        avg_resilience = mean(float(row["public_health_resilience_score"]) for row in subset)
        overload_weeks = sum(float(row["care_stress"]) > 1.0 for row in subset)

        if overload_weeks >= 8 or peak_care_stress >= 1.25:
            diagnostic = "system overload risk with care-capacity stress"
        elif avg_risk >= 45:
            diagnostic = "moderate-to-high public health stress requiring upstream intervention"
        elif min_trust < 35:
            diagnostic = "trust depletion threatens cooperation and prevention"
        elif float(final["public_health_resilience_score"]) >= 65 and avg_risk <= 35:
            diagnostic = "comparatively resilient public health pathway"
        elif avg_resilience >= 55:
            diagnostic = "partial improvement with remaining vulnerability and capacity risks"
        else:
            diagnostic = "weak evidence of durable public-health resilience"

        output.append({
            "scenario": scenario_name,
            "peak_infected": round(peak_infected, 3),
            "peak_care_stress": round(peak_care_stress, 3),
            "overload_weeks": overload_weeks,
            "minimum_public_trust": round(min_trust, 3),
            "final_public_trust": final["public_trust"],
            "final_prevention_value_index": final["prevention_value_index"],
            "final_public_health_resilience_score": final["public_health_resilience_score"],
            "final_vulnerability_stock": final["vulnerability_stock"],
            "final_care_capacity": final["care_capacity"],
            "average_health_risk_index": round(avg_risk, 3),
            "average_public_health_resilience_score": round(avg_resilience, 3),
            "diagnostic": diagnostic,
        })

    return output


def one_at_a_time(base: PublicHealthScenario, delta: float = 0.10) -> list[dict[str, object]]:
    base_score = float(run_scenario(base)[-1]["public_health_resilience_score"])
    parameters = [
        "transmission_rate",
        "prevention_strength",
        "trust_gain",
        "trust_loss_from_overload",
        "care_capacity_investment",
        "vulnerability_index",
        "environmental_exposure",
        "climate_stress",
        "social_support_capacity",
        "primary_care_access",
        "equity_capacity",
        "institutional_learning",
        "intervention_delay",
    ]

    rows: list[dict[str, object]] = []
    for parameter in parameters:
        for direction in (-1, 1):
            current = getattr(base, parameter)
            revised_value = max(0.0, min(1.0, current + direction * delta)) if current <= 1.0 else max(0.0, current + direction * delta * 10.0)
            revised = replace(base, name=f"{base.name} {parameter} {direction * delta:+.2f}", **{parameter: revised_value})
            revised_score = float(run_scenario(revised)[-1]["public_health_resilience_score"])
            rows.append({
                "parameter": parameter,
                "delta": direction * delta,
                "base_value": current,
                "revised_value": revised_value,
                "base_final_public_health_resilience_score": round(base_score, 3),
                "revised_final_public_health_resilience_score": round(revised_score, 3),
                "score_change": round(revised_score - base_score, 3),
                "absolute_score_change": round(abs(revised_score - base_score), 3),
            })

    return sorted(rows, key=lambda row: float(row["absolute_score_change"]), reverse=True)


def validate(rows: list[dict[str, object]]) -> list[str]:
    errors: list[str] = []
    for row in rows:
        if float(row["susceptible"]) < -0.001 or float(row["infected"]) < -0.001 or float(row["recovered"]) < -0.001:
            errors.append(f"Negative population stock in {row['scenario']} week {row['week']}.")
        if not (0.0 <= float(row["public_trust"]) <= 100.0):
            errors.append(f"Trust outside 0-100 range in {row['scenario']} week {row['week']}.")
        if float(row["care_capacity"]) <= 0.0:
            errors.append(f"Care capacity dropped to zero in {row['scenario']} week {row['week']}.")
    return errors


def write_csv(path: Path, rows: list[dict[str, object]]) -> None:
    path.parent.mkdir(parents=True, exist_ok=True)
    if not rows:
        raise ValueError(f"No rows to write: {path}")
    with path.open("w", newline="", encoding="utf-8") as handle:
        writer = csv.DictWriter(handle, fieldnames=list(rows[0].keys()))
        writer.writeheader()
        writer.writerows(rows)


def main() -> None:
    scenarios = [
        PublicHealthScenario("Baseline reactive response", 100000, 180, 0.42, 0.18, 0.055, 0.08, 52.0, 0.10, 4.2, 520.0, 0.18, 52.0, 0.46, 0.34, 0.24, 0.30, 0.24, 0.20, 0.90),
        PublicHealthScenario("Delayed intervention", 100000, 180, 0.42, 0.18, 0.055, 0.30, 52.0, 0.28, 4.0, 520.0, 0.34, 56.0, 0.42, 0.30, 0.34, 0.38, 0.38, 0.34, 0.58),
        PublicHealthScenario("Trust-centered prevention", 100000, 180, 0.40, 0.19, 0.050, 0.42, 62.0, 0.55, 2.5, 560.0, 0.58, 42.0, 0.30, 0.24, 0.62, 0.62, 0.60, 0.58, 0.32),
        PublicHealthScenario("Integrated equity and capacity strategy", 100000, 180, 0.39, 0.20, 0.046, 0.48, 68.0, 0.70, 1.8, 680.0, 0.82, 30.0, 0.22, 0.18, 0.78, 0.78, 0.86, 0.82, 0.18),
    ]

    rows: list[dict[str, object]] = []
    for scenario in scenarios:
        rows.extend(run_scenario(scenario))

    validation_errors = validate(rows)
    if validation_errors:
        raise ValueError("Validation failed:
" + "
".join(validation_errors))

    write_csv(TABLES / "public_health_system_timeseries.csv", rows)
    write_csv(TABLES / "public_health_system_summary.csv", summarize(rows))
    write_csv(TABLES / "public_health_sensitivity_analysis.csv", one_at_a_time(scenarios[-1]))

    validation_path = TABLES / "validation_report.txt"
    validation_path.parent.mkdir(parents=True, exist_ok=True)
    validation_path.write_text(
        "Validation passed.
Population stocks, trust bounds, and care-capacity checks completed.
",
        encoding="utf-8",
    )

    print("Public health system workflow complete.")
    print(TABLES / "public_health_system_timeseries.csv")


if __name__ == "__main__":
    main()
The workflow is intentionally simple enough to inspect. It shows how transmission, recovery, severe-case burden, prevention, public trust, care capacity, workforce stress, vulnerability, environmental exposure, climate stress, social support, primary care, equity, institutional learning, and intervention delay interact over time. It also shows why public health cannot be evaluated by clinical care alone: upstream vulnerability, prevention, trust, access, social support, and learning shape whether care systems become overloaded. The model is synthetic and illustrative; it supports disciplined inquiry rather than replacing epidemiology, clinical expertise, community knowledge, or public decision-making.
R Workflow: Public Health Indicators, Burden Tables, and System Trajectory Visualization
The R workflow reads the Python-generated time-series and sensitivity outputs, creates public-health system summaries, and exports base R plots for infection burden, care stress, public trust, vulnerability, health risk, prevention value, and public-health resilience. It uses only base R so it remains portable across simple local environments.
# public_health_as_a_system_diagnostics.R
# Base R workflow for public-health system summaries and trajectory visualization.

args <- commandArgs(trailingOnly = FALSE)
file_arg <- grep("^--file=", args, value = TRUE)

if (length(file_arg) > 0) {
  script_path <- normalizePath(sub("^--file=", "", file_arg[1]), mustWork = TRUE)
  article_root <- normalizePath(file.path(dirname(script_path), ".."), mustWork = TRUE)
} else {
  article_root <- getwd()
}

setwd(article_root)

tables_dir <- file.path(article_root, "outputs", "tables")
figures_dir <- file.path(article_root, "outputs", "figures")

if (!dir.exists(tables_dir)) {
  dir.create(tables_dir, recursive = TRUE)
}

if (!dir.exists(figures_dir)) {
  dir.create(figures_dir, recursive = TRUE)
}

timeseries_path <- file.path(tables_dir, "public_health_system_timeseries.csv")
sensitivity_path <- file.path(tables_dir, "public_health_sensitivity_analysis.csv")

if (!file.exists(timeseries_path)) {
  stop(paste("Missing", timeseries_path, "Run the Python workflow first."))
}

data <- read.csv(timeseries_path, stringsAsFactors = FALSE)

last_by_scenario <- do.call(
  rbind,
  lapply(split(data, data$scenario), function(df) df[nrow(df), ])
)

peak_infected <- aggregate(infected ~ scenario, data = data, FUN = max)
peak_care_stress <- aggregate(care_stress ~ scenario, data = data, FUN = max)
min_trust <- aggregate(public_trust ~ scenario, data = data, FUN = min)
avg_risk <- aggregate(health_risk_index ~ scenario, data = data, FUN = mean)
avg_resilience <- aggregate(public_health_resilience_score ~ scenario, data = data, FUN = mean)
overload_weeks <- aggregate(care_stress ~ scenario, data = data, FUN = function(x) sum(x > 1.0))

names(peak_infected)[2] <- "peak_infected"
names(peak_care_stress)[2] <- "peak_care_stress"
names(min_trust)[2] <- "minimum_public_trust"
names(avg_risk)[2] <- "average_health_risk_index"
names(avg_resilience)[2] <- "average_public_health_resilience_score"
names(overload_weeks)[2] <- "overload_weeks"

final_fields <- last_by_scenario[, c(
  "scenario",
  "public_trust",
  "prevention_value_index",
  "public_health_resilience_score",
  "vulnerability_stock",
  "care_capacity",
  "health_risk_index"
)]

names(final_fields) <- c(
  "scenario",
  "final_public_trust",
  "final_prevention_value_index",
  "final_public_health_resilience_score",
  "final_vulnerability_stock",
  "final_care_capacity",
  "final_health_risk_index"
)

summary_table <- Reduce(
  function(x, y) merge(x, y, by = "scenario"),
  list(peak_infected, peak_care_stress, min_trust, avg_risk, avg_resilience, overload_weeks, final_fields)
)

summary_table$diagnostic <- ifelse(
  summary_table$overload_weeks >= 8 |
    summary_table$peak_care_stress >= 1.25,
  "system overload risk with care-capacity stress",
  ifelse(
    summary_table$average_health_risk_index >= 45,
    "moderate-to-high public health stress requiring upstream intervention",
    ifelse(
      summary_table$minimum_public_trust < 35,
      "trust depletion threatens cooperation and prevention",
      ifelse(
        summary_table$final_public_health_resilience_score >= 65 &
          summary_table$average_health_risk_index <= 35,
        "comparatively resilient public health pathway",
        ifelse(
          summary_table$average_public_health_resilience_score >= 55,
          "partial improvement with remaining vulnerability and capacity risks",
          "weak evidence of durable public-health resilience"
        )
      )
    )
  )
)

summary_table <- summary_table[order(summary_table$final_public_health_resilience_score, decreasing = TRUE), ]

write.csv(
  summary_table,
  file.path(tables_dir, "public_health_system_r_summary.csv"),
  row.names = FALSE
)

if (file.exists(sensitivity_path)) {
  sensitivity <- read.csv(sensitivity_path, stringsAsFactors = FALSE)
  sensitivity_ranked <- sensitivity[order(sensitivity$absolute_score_change, decreasing = TRUE), ]
  write.csv(
    sensitivity_ranked,
    file.path(tables_dir, "public_health_sensitivity_ranked_r.csv"),
    row.names = FALSE
  )
}

plot_metric <- function(metric, label, file_name) {
  png(file.path(figures_dir, file_name), width = 1200, height = 700)
  scenarios <- unique(data$scenario)
  plot(
    NA,
    xlim = range(data$week),
    ylim = range(data[[metric]], na.rm = TRUE),
    xlab = "Week",
    ylab = label,
    main = paste(label, "by Public Health Scenario")
  )
  for (scenario_name in scenarios) {
    subset_data <- data[data$scenario == scenario_name, ]
    lines(subset_data$week, subset_data[[metric]], lwd = 2)
  }
  legend("topright", legend = scenarios, lwd = 2, cex = 0.75, bty = "n")
  grid()
  dev.off()
}

plot_metric("infected", "Infected population", "infection_trajectories.png")
plot_metric("care_stress", "Care stress ratio", "care_stress_trajectories.png")
plot_metric("public_trust", "Public trust index", "public_trust_trajectories.png")
plot_metric("vulnerability_stock", "Vulnerability stock", "vulnerability_trajectories.png")
plot_metric("health_risk_index", "Health risk index", "health_risk_trajectories.png")
plot_metric("prevention_value_index", "Prevention value index", "prevention_value_trajectories.png")
plot_metric("public_health_resilience_score", "Public health resilience score", "public_health_resilience_trajectories.png")

png(file.path(figures_dir, "final_public_health_resilience_scores.png"), width = 1200, height = 700)
barplot(
  summary_table$final_public_health_resilience_score,
  names.arg = summary_table$scenario,
  las = 2,
  ylab = "Final public health resilience score",
  main = "Final Public Health Resilience by Scenario"
)
grid()
dev.off()

print(summary_table)
This workflow supports the article’s central methodological claim: public health should be evaluated through prevention, trust, exposure, vulnerability, care capacity, institutional learning, and equity, not only through clinical throughput or individual behavior. The R outputs help readers compare reactive, delayed, trust-centered, and integrated equity-capacity public-health strategies.
GitHub Repository
The companion repository for this article should help readers model public health as a dynamic system of disease transmission, care capacity, public trust, prevention, social determinants, vulnerability, environmental exposure, and policy intervention using synthetic datasets and reproducible workflows.
Complete Code Repository
Companion repository for the article, including public-health systems simulations, disease-dynamics models, care-capacity and workforce-stress diagnostics, public trust and prevention workflows, social determinant and vulnerability indicators, environmental exposure scenarios, Python and R workflow scripts, synthetic datasets, documentation assets, and multi-language scaffolds for systems analysis.
articles/public-health-as-a-system/
├── python/
│   ├── public_health_as_a_system_workflow.py
│   ├── public_health_system_model.py
│   ├── disease_dynamics_scenarios.py
│   ├── care_capacity_stress_model.py
│   ├── public_trust_dynamics.py
│   ├── social_determinants_vulnerability_index.py
│   ├── environmental_exposure_risk_model.py
│   ├── prevention_value_scenarios.py
│   ├── validation_checks.py
│   └── run_all_public_health_workflows.py
├── r/
│   ├── public_health_as_a_system_diagnostics.R
│   ├── public_health_system_diagnostics.R
│   ├── disease_trajectory_visualization.R
│   ├── care_stress_tables.R
│   ├── trust_prevention_plots.R
│   ├── vulnerability_equity_tables.R
│   ├── prevention_value_summary.R
│   └── run_all_public_health_workflows.R
├── julia/
│   ├── nonlinear_public_health_dynamics.jl
│   ├── care_capacity_feedback.jl
│   └── trust_prevention_model.jl
├── sql/
│   ├── schema_population_health.sql
│   ├── schema_disease_surveillance.sql
│   ├── schema_care_capacity.sql
│   ├── schema_public_trust.sql
│   ├── schema_social_determinants.sql
│   ├── schema_environmental_exposure.sql
│   ├── schema_vulnerability_indices.sql
│   ├── schema_prevention_programs.sql
│   ├── schema_policy_scenarios.sql
│   ├── schema_model_runs.sql
│   └── schema_outputs.sql
├── rust/
│   └── public_health_scenario_validator.rs
├── go/
│   └── public_health_scenario_runner.go
├── cpp/
│   ├── efficient_capacity_stress_scan.cpp
│   └── disease_threshold_solver.cpp
├── fortran/
│   └── recurrence_public_health_model.f90
├── c/
│   └── low_level_public_health_feedback_kernel.c
├── docs/
│   ├── modeling_principles.md
│   ├── article_notes.md
│   ├── public_health_systems_framework.md
│   ├── disease_dynamics_notes.md
│   ├── care_capacity_and_workforce_stress.md
│   ├── trust_prevention_and_equity.md
│   ├── python_workflow.md
│   ├── r_workflow.md
│   ├── diagnostic_questions.md
│   ├── ethics_and_health_justice.md
│   ├── assumptions_and_limitations.md
│   └── responsible_use.md
├── data/
│   ├── synthetic_population_health.csv
│   ├── synthetic_disease_surveillance.csv
│   ├── synthetic_care_capacity.csv
│   ├── synthetic_public_trust.csv
│   ├── synthetic_social_determinants.csv
│   ├── synthetic_environmental_exposure.csv
│   ├── synthetic_vulnerability_indices.csv
│   ├── synthetic_prevention_programs.csv
│   ├── synthetic_policy_scenarios.csv
│   ├── synthetic_model_runs.csv
│   └── synthetic_outputs.csv
├── outputs/
│   ├── README.md
│   ├── figures/
│   └── tables/
└── notebooks/
    ├── python_public_health_walkthrough.ipynb
    └── r_public_health_indicator_visualization_placeholder.ipynb
This repository structure supports the article’s central argument: public health must be analyzed dynamically, with attention to disease transmission, prevention, care capacity, trust, social determinants, environmental exposure, vulnerability, equity, and governance learning. The python/ folder supports dependency-light simulation and diagnostics. The r/ folder supports visualization and interpretive summaries. The julia folder supports nonlinear health-system dynamics. The sql folder defines schemas for public-health systems data. The lower-level language folders provide scaffolds for epidemic scanning, capacity solving, recurrence modeling, and low-level feedback simulation.
A Practical Method for Public Health Systems Diagnosis
Public health systems diagnosis requires moving from isolated health outcomes to the conditions that produce them. The method below can be used by researchers, public agencies, healthcare institutions, civic organizations, community groups, and policy teams seeking to understand population health as a system.
1. Define the population and health outcome
Identify the population, place, timeframe, and health outcome being examined. Include distribution, not only average burden.
2. Map upstream determinants
Identify housing, food, water, income, work, education, transportation, environment, safety, social support, healthcare access, and public policy conditions.
3. Identify critical stocks
Map population immunity, chronic disease burden, care capacity, public trust, workforce capacity, prevention infrastructure, environmental exposure, community resilience, and institutional memory.
4. Trace flows
Trace infection, recovery, prevention, care delivery, exposure, misinformation, vaccination, screening, investment, burnout, learning, and policy change.
5. Identify feedback loops
Look for trust-cooperation loops, overload-burnout loops, prevention-delay loops, poverty-health loops, misinformation loops, and exposure-disease loops.
6. Analyze vulnerability and protection
Ask who is most exposed, who has less protective capacity, who faces access barriers, and who is expected to absorb institutional failure.
7. Examine public trust
Identify what builds trust, what depletes it, which communities have reason for mistrust, and whether institutions are behaving trustworthily.
8. Test intervention timing
Compare reactive response, delayed intervention, prevention, trust-centered communication, capacity-building, and equity-centered strategies.
9. Evaluate burden and dignity
Ask whether the intervention shifts burden to households, workers, caregivers, disabled people, marginalized communities, or frontline institutions.
10. Build learning into governance
Preserve surveillance data, community feedback, after-action reviews, equity diagnostics, institutional memory, and authority to revise policy.
This method treats public health as a living system of exposure, protection, care, trust, prevention, and justice. It asks what must change upstream so fewer people are harmed downstream.
Common Pitfalls
Public health systems thinking can fail when health is reduced to individual behavior, clinical throughput, or technical messaging. Several pitfalls are common.
- Reducing public health to healthcare: Hospitals and clinics matter, but population health is also produced by housing, food, water, work, environment, transportation, income, and policy.
- Blaming individual behavior while ignoring conditions: People make choices inside systems of cost, access, time, stress, safety, information, and power.
- Treating trust as a messaging problem: Trust is built by reliable, fair, accountable, accessible, and respectful institutions. Communication cannot substitute for trustworthiness.
- Ignoring prevention because success is invisible: Prevention is easy to underfund because averted illness is less visible than treated disease. Systems thinking makes avoided harm visible.
- Measuring averages while hiding inequity: Aggregate improvement can coexist with concentrated harm. Public health must evaluate distribution and vulnerability.
- Separating environmental exposure from health: Air, water, heat, toxins, housing quality, climate, and workplace hazards are public-health conditions.
- Ignoring workforce and institutional capacity: Public-health and healthcare workers are part of the system. Burnout, turnover, and underfunding reduce system resilience.
- Consulting communities without sharing authority: Community engagement becomes symbolic if lived knowledge cannot change resources, rules, accountability, or implementation.
The central pitfall is treating public health as a downstream service rather than a whole system of social, ecological, infrastructural, institutional, and ethical conditions that produce health or harm.
Why Public Health Requires Systems Thinking
Public health requires systems thinking because health is produced through interdependence. Disease does not move only through bodies; it moves through housing, work, schools, transportation, care access, communication, trust, environment, and policy. Chronic illness does not arise only from individual behavior; it accumulates through exposure, stress, food systems, pollution, income, housing, and healthcare access. Health inequity does not occur randomly; it reflects structural vulnerability and unequal protection.
Systems thinking changes the public-health question. It asks not only who is sick, but why the system produced that pattern. It asks what stocks of health, trust, capacity, and resilience are being built or depleted. It asks what feedback loops amplify harm, what delays hide consequences, what policies shift burden, and what institutions can learn before crisis repeats.
A public-health system is strongest when prevention is treated as infrastructure, trust is treated as a public good, equity is treated as system performance, and care capacity is protected before overload. It requires clean air, safe water, secure housing, nutritious food, dignified work, accessible care, reliable communication, environmental protection, and accountable governance.
Public health is ultimately a collective systems responsibility. It is the work of designing communities, institutions, infrastructures, and policies so that health is not a privilege delivered downstream, but a condition built upstream into the systems people live within every day.
Related Articles
- Food-Water-Energy Systems Thinking
- Climate Systems and Feedback Dynamics
- Systems Thinking and Sustainability
- Systems Thinking in Public Policy
- Systems Thinking in Governance and Public Institutions
- Resilience, Thresholds, and Regime Shifts
- Urban Systems: Congestion, Housing, and Infrastructure
- Networks, Dependencies, and Cascade Risk
Further Reading
- World Health Organization. Closing the Gap in a Generation: Health Equity through Action on the Social Determinants of Health.
- World Health Organization. Health in All Policies: Framework for Country Action.
- Centers for Disease Control and Prevention. Social Determinants of Health.
- Marmot, Michael. The Health Gap: The Challenge of an Unequal World. Bloomsbury.
- Farmer, Paul. Pathologies of Power: Health, Human Rights, and the New War on the Poor. University of California Press.
- Link, Bruce G. and Phelan, Jo. “Social Conditions as Fundamental Causes of Disease.” Journal of Health and Social Behavior.
- Krieger, Nancy. Epidemiology and the People’s Health: Theory and Context. Oxford University Press.
- Meadows, Donella H. Thinking in Systems: A Primer. Chelsea Green Publishing.
- Sterman, John D. Business Dynamics: Systems Thinking and Modeling for a Complex World. Irwin/McGraw-Hill.
- IPCC. Climate Change 2022: Impacts, Adaptation and Vulnerability. Working Group II contribution to the Sixth Assessment Report.
References
- Centers for Disease Control and Prevention (2024) Social Determinants of Health. Available at: https://www.cdc.gov/social-determinants-of-health/
- Farmer, P. (2005) Pathologies of Power: Health, Human Rights, and the New War on the Poor. Berkeley: University of California Press.
- IPCC (2022) Climate Change 2022: Impacts, Adaptation and Vulnerability. Cambridge: Cambridge University Press. Available at: https://www.ipcc.ch/report/ar6/wg2/
- Krieger, N. (2011) Epidemiology and the People’s Health: Theory and Context. Oxford: Oxford University Press.
- Link, B.G. and Phelan, J. (1995) “Social Conditions as Fundamental Causes of Disease.” Journal of Health and Social Behavior, 35, pp. 80–94. Available at: https://doi.org/10.2307/2626958
- Marmot, M. (2015) The Health Gap: The Challenge of an Unequal World. London: Bloomsbury.
- Meadows, D.H. (2008) Thinking in Systems: A Primer. White River Junction, VT: Chelsea Green Publishing. Available at: https://www.chelseagreen.com/product/thinking-in-systems/
- Sterman, J.D. (2000) Business Dynamics: Systems Thinking and Modeling for a Complex World. Boston: Irwin/McGraw-Hill.
- World Health Organization (2008) Closing the Gap in a Generation: Health Equity through Action on the Social Determinants of Health. Geneva: WHO. Available at: https://www.who.int/publications/i/item/WHO-IER-CSDH-08.1
- World Health Organization (2014) Health in All Policies: Framework for Country Action. Geneva: WHO. Available at: https://www.who.int/publications/i/item/9789241506908