
Last Updated May 14, 2026
Flood monitoring systems are hydrological risk-conversion infrastructures designed to observe changing water conditions, interpret when those changes cross from hydrological variation into hazardous consequence, and create actionable lead time before inundation becomes disaster. They combine streamgages, rainfall observations, radar and satellite products, soil-moisture and snowmelt context, hydrological models, inundation mapping, telemetry, forecast systems, warning protocols, and emergency-management workflows in order to transform water movement into risk intelligence. In this sense, flood monitoring is not merely the measurement of stage, discharge, rainfall, or inundation. It is the organized production of flood legibility under uncertainty, spatial variability, and time pressure.
Flooding poses a distinctive observational challenge because it emerges from coupled processes rather than from a single variable. Rainfall intensity, antecedent soil saturation, snowmelt, channel conveyance, floodplain storage, reservoir operations, drainage infrastructure, land use, levee performance, debris blockage, urban imperviousness, and in some settings coastal or tidal interaction can all determine whether water remains contained or becomes damaging inundation. A rising hydrograph does not by itself specify social consequence. Flood monitoring systems must therefore connect hydrological observation to thresholds, spatial extent, exposure, infrastructure vulnerability, and warning logic. They are not simply about observing more water. They are about determining when moving water becomes dangerous, where, how quickly, and for whom.
The deeper significance of flood monitoring lies in the fact that it transforms hydrological change into institutional lead time. A flood is not only a hydrological event; it is also a failure or success of observation, interpretation, coordination, and protective action. Where monitoring systems are strong, rising water becomes visible early enough to support warning, evacuation, infrastructure operation, road closure, reservoir management, and emergency coordination. Where monitoring is weak, uncertainty travels downstream as loss. Flood monitoring systems are therefore infrastructures of public protection, unequal lead time, and hydrological accountability.
Main Library
Publications
Article Map
Environmental Monitoring
Related Topic
Risk & Resilience
Related Topic
Intelligent Infrastructure
Related Topic
Data Systems
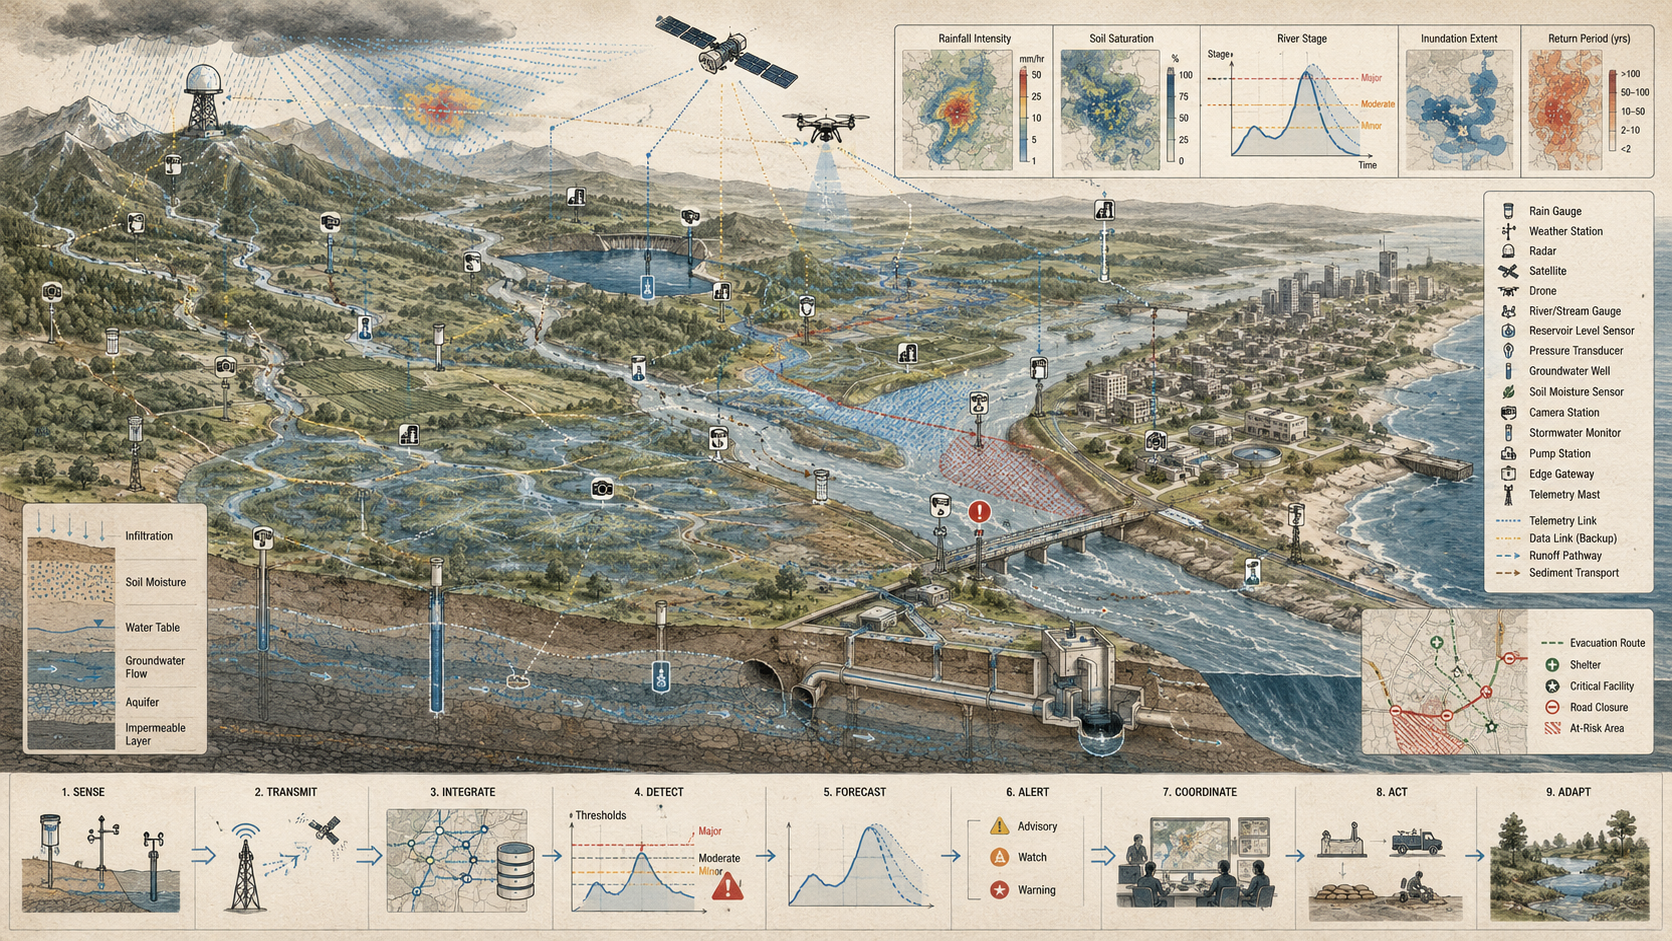
Flood monitoring is where hydrological observation becomes protective intelligence. It asks not only whether water levels are rising, but whether the system can detect the relevant rise, interpret it against local thresholds, forecast its trajectory, translate it into likely inundation and impact, communicate uncertainty clearly, and support action before the available lead time collapses. The central question is not simply whether a basin has gauges, models, maps, or alerts. It is whether those components form an end-to-end warning architecture between changing water conditions and protective response.
Engineering Problem
The engineering problem is how to design flood monitoring systems that can transform distributed, uncertain, rapidly changing hydrometeorological observations into defensible flood-risk intelligence and protective lead time. Flood monitoring is not a single-instrument problem. It is an end-to-end systems problem involving streamgages, rainfall estimation, telemetry, hydrological models, flood-stage thresholds, inundation mapping, forecast uncertainty, local impact interpretation, alert dissemination, emergency response, and public trust.
This problem is difficult because flood risk develops through interacting processes across space and time. Riverine floods may build over days as basin storage, upstream rainfall, snowmelt, reservoir releases, and channel conveyance interact. Flash floods may emerge within minutes or hours from localized intense rainfall, steep terrain, burn scars, urban drainage constraints, or small ungauged basins. Coastal and compound flooding may involve rainfall, river discharge, storm surge, tides, groundwater, drainage impedance, or backwater effects. Flood monitoring must therefore support both cumulative basin-scale interpretation and rapid localized hazard detection.
Weak flood monitoring treats water-level observation as if it automatically produced warning. Strong flood monitoring treats warning as an evidence chain. It asks what is being measured, where gauges and blind spots are located, whether telemetry is current, whether rating curves and flood thresholds remain valid, whether rainfall is well estimated, whether forecast models are calibrated, whether inundation maps are appropriate, whether exposure and vulnerability are understood, whether warnings are understandable, and whether response institutions can act before lead time disappears.
| Engineering Tension | Why It Matters | Required Evidence |
|---|---|---|
| Hydrological observation versus flood consequence | Stage, discharge, and rainfall do not automatically reveal social impact. | Impact thresholds, inundation maps, exposure layers, local consequence statements |
| Riverine forecasting versus flash-flood detection | Main-stem rivers and small fast-response basins require different lead-time logic. | Basin response classification, flash-flood guidance, rainfall intensity and concentration-time analysis |
| Telemetry speed versus data reliability | Fast streams can still mislead if sensors fail, data are stale, or rating relations shift. | Telemetry completeness, QA/QC flags, gauge maintenance, rating-curve status |
| Forecast lead time versus confidence | Earlier warnings may be more useful but less certain; later warnings may be more certain but less useful. | Forecast horizon, uncertainty bands, warning lead-time targets, decision thresholds |
| Flood mapping versus local reality | Inundation maps translate hydrology into space but depend on assumptions about terrain, hydraulics, and infrastructure. | Map source, stage linkage, hydraulic assumptions, validation record, caveat statement |
| Hazard detection versus public action | A detected flood risk does not reduce harm unless warnings are communicated and acted upon. | Alert pathway, emergency-management workflow, public communication plan, response log |
| Network coverage versus unequal protection | Ungauged basins, low-capacity jurisdictions, and unmapped floodplains receive less warning capability. | Coverage audit, vulnerable-area review, ungauged-basin strategy, early-warning capacity plan |
The practical question is therefore: can the flood monitoring system identify hazardous hydrological transitions early enough, clearly enough, and locally enough to support protective action?
Reference Architecture
A practical flood monitoring architecture can be understood as a hydrological early-warning evidence system. The exact implementation may include river gages, rainfall gauges, radar precipitation, satellite rainfall estimates, soil-moisture records, snowpack data, reservoir and dam-operation feeds, streamflow models, flash-flood guidance products, flood inundation maps, telemetry networks, forecast systems, emergency alert systems, road-closure workflows, public dashboards, and post-event validation. The responsibilities remain consistent: observe, transmit, validate, forecast, translate, warn, respond, document, and learn.
| Layer | Engineering Role | Primary Risk | Evidence Artifact |
|---|---|---|---|
| Risk objective layer | Defines flood type, geography, protected population, warning purpose, lead-time goal, and operational use. | Monitoring is designed around available data rather than protective action. | Flood-risk objective manifest, warning-use statement, lead-time target |
| Hydrometeorological observation layer | Collects stage, discharge, rainfall, snowmelt, soil wetness, reservoir state, groundwater, and related drivers. | Key drivers remain unobserved or misaligned with basin response time. | Gauge registry, rainfall-source inventory, driver matrix |
| Telemetry and data acquisition layer | Moves real-time or near-real-time observations into forecast and warning systems. | Stale, missing, delayed, or unflagged data create false confidence. | Telemetry completeness report, latency record, outage log |
| Validation and quality layer | Checks instrument status, rating relations, plausibility, missingness, and model input integrity. | Faulty observations become forecast inputs or warnings. | QA/QC policy, gauge maintenance log, rating-curve review, rainfall validation note |
| Forecast and guidance layer | Projects likely stage, flow, timing, flash-flood potential, and hydrological evolution. | Forecast models are used without understanding uncertainty or basin limits. | Forecast model card, flash-flood guidance record, uncertainty statement |
| Risk translation layer | Links hydrological values to flood categories, inundation extent, local impacts, and exposure. | Hydrological thresholds do not translate into actionable local meaning. | Impact-threshold registry, inundation-map linkage, exposure layer |
| Warning and communication layer | Converts forecast risk into official warnings, public messages, emergency briefings, and decision support. | Risk is technically detected but not communicated clearly or authoritatively. | Warning protocol, message template, alert log, public communication record |
| Response and governance layer | Connects warnings to protective action, agency coordination, road closure, evacuation, operations, and review. | Warnings do not produce timely action or post-event learning. | Response log, coordination plan, post-event review, governance record |
This architecture makes clear that flood monitoring is not only hydrology. It is the management of a warning chain from water movement to protective decision.
Implementation Pattern
A rigorous flood-monitoring implementation begins with the flood hazard and the protective decision. A large river forecast point, a flash-flood-prone canyon, a low-lying urban drainage basin, a leveed floodplain, a reservoir-regulated river, and a compound coastal-river system do not require identical designs. Each context implies different observations, update intervals, forecast models, thresholds, inundation products, alert pathways, emergency partners, and uncertainty communication.
| Artifact | Purpose | Suggested Format |
|---|---|---|
| Flood-risk objective manifest | Defines flood type, geography, lead-time goal, protected population, assets, and decision use. | YAML, Markdown, architecture decision record |
| Gauge and sensor registry | Stores streamgage, rainfall gauge, reservoir, soil-moisture, and related station metadata. | CSV, GeoJSON, SQL table |
| Hydrometeorological driver matrix | Links flood generation processes to measured or modeled variables. | CSV, Markdown table, model configuration |
| Telemetry and latency records | Tracks expected and received observations, outage minutes, stale readings, and update frequency. | CSV, time-series database, observability export |
| Threshold and impact registry | Documents flood stages, local impacts, warning levels, road closures, and action triggers. | CSV, SQL table, emergency-management matrix |
| Forecast and guidance model card | Documents forecast method, inputs, calibration, lead time, uncertainty, and valid-use limits. | Markdown, model card, technical note |
| Inundation-map linkage file | Connects forecast stage or discharge to expected flood extent and exposed infrastructure. | GeoJSON, shapefile, raster metadata, CSV linkage |
| Warning and response log | Tracks warning issuance, communication, protective actions, response timing, and outcomes. | CSV, SQL table, incident-management export |
| Coverage and equity audit | Assesses which basins, communities, tributaries, assets, and vulnerable populations remain weakly observed. | CSV, GIS layer, public evidence memo |
| Governance and post-event review log | Tracks threshold changes, forecast errors, missed events, false alarms, public caveats, and system revisions. | CSV, SQL table, after-action review |
The implementation goal is to make flood warnings reconstructable. A user should be able to move from a warning, evacuation recommendation, road closure, reservoir operation, or emergency briefing back to the observations, thresholds, forecasts, inundation assumptions, uncertainty statements, and response rules that produced it.
Research-Grade Framing: Flood Monitoring as Hydrological Risk Infrastructure
A research-grade account of flood monitoring begins by treating it as hydrological risk infrastructure rather than as a set of water-level instruments. Flood monitoring systems determine which watersheds become visible, which hydrological processes are represented, how quickly hazardous conditions can be recognized, how uncertainty is communicated, and how observations become public warnings or protective actions. They change not only what is measured, but how flood risk is institutionally perceived.
This role is epistemically demanding because flood risk is not directly observed as a single physical quantity. Stage, discharge, rainfall, soil moisture, radar precipitation, model guidance, inundation maps, and impact thresholds each represent partial evidence. Flood risk emerges when those signals are interpreted together in relation to terrain, infrastructure, exposure, vulnerability, and available response time. A flood monitoring system is therefore an inferential system: it converts hydrological evidence into estimates of likely consequence under uncertainty.
This inferential chain is not neutral. Areas with gauges, calibrated forecast points, high-quality maps, and established emergency protocols become more legible to institutions. Ungauged tributaries, informal settlements, rural basins, under-resourced jurisdictions, blocked drainage systems, and rapidly urbanizing floodplains may remain less visible even when their risk is high. Flood monitoring is therefore also a question of unequal protection. Lead time is a technical achievement, but it is also a public good that is unevenly distributed.
| Limited Pattern | Stronger Pattern | Why the Shift Matters |
|---|---|---|
| Measure water level | Link stage, discharge, rainfall, forecast, inundation, impact, and response | Prevents hydrological observation from being mistaken for warning readiness. |
| Report current conditions | Produce actionable lead time through forecast and warning logic | Shifts monitoring from retrospective awareness to protective foresight. |
| Use flood stages | Connect thresholds to local roads, structures, populations, and emergency actions | Translates hydrology into consequence and decision support. |
| Rely on main-stem river gauges | Include flash-flood, urban drainage, tributary, and compound-flood blind spots | Reduces false reassurance in fast-response and poorly gauged areas. |
| Map inundation | Document map assumptions, uncertainty, infrastructure changes, and validation | Prevents model-based maps from being treated as perfect ground truth. |
| Issue alerts | Connect warnings to communication, preparedness, response, and post-event review | Aligns flood monitoring with early-warning and disaster-risk-reduction practice. |
The central research question is not “Can this basin be monitored?” but “What kind of flood risk becomes visible, actionable, and accountable through this monitoring architecture?”
Formal Model: Hazard, Exposure, Lead Time, Uncertainty, and Warning Readiness
A useful formal model separates hydrological hazard, exposure, vulnerability, forecast confidence, telemetry completeness, lead time, inundation translation, communication readiness, and response capacity. Let \(H_f\) represent flood hazard intensity, \(E_x\) exposure, \(V_u\) vulnerability, \(C_f\) forecast confidence, \(C_t\) telemetry completeness, \(L_p\) protective lead time, \(M_i\) inundation-map readiness, \(C_w\) warning communication readiness, and \(R_c\) response capacity. Flood-monitoring quality depends on these dimensions together, not on water-level data alone.
R_{\mathrm{rise}} = \frac{h_t – h_{t-\Delta t}}{\Delta t}
\]
Interpretation: Rate of rise measures how quickly water level is increasing. It is especially important where lead time is short.
C_{\mathrm{telemetry}} = \frac{N_{\mathrm{received\ observations}}}{N_{\mathrm{expected\ observations}}}
\]
Interpretation: Telemetry completeness measures whether enough expected observations are arriving to support operational awareness.
L_{\mathrm{protective}} = T_{\mathrm{impact}} – T_{\mathrm{warning}}
\]
Interpretation: Protective lead time is the time between warning and expected impact. It is one of the central outputs of flood monitoring.
P_{\mathrm{flood}} = f(P_{\mathrm{rain}}, S_{\mathrm{soil}}, Q_{\mathrm{upstream}}, C_{\mathrm{channel}}, O_{\mathrm{operations}})
\]
Interpretation: Flood probability depends on rainfall, antecedent soil wetness, upstream flow, channel conveyance, and operational controls such as reservoirs or gates.
R_{\mathrm{risk}} = H_f \times E_x \times V_u
\]
Interpretation: Flood risk depends on hazard, exposure, and vulnerability. High water is not the same as high consequence unless people, infrastructure, or assets are exposed.
Q_{\mathrm{flood\ warning}} =
w_1C_g +
w_2C_r +
w_3C_t +
w_4C_f +
w_5M_i +
w_6L_p +
w_7C_w +
w_8R_c +
w_9G_r
\]
Interpretation: Flood-warning quality depends on gauge coverage, rainfall coverage, telemetry completeness, forecast confidence, inundation-map readiness, protective lead time, communication readiness, response capacity, and governance readiness.
This formal structure protects against a common error in flood monitoring: treating observed water level as if it directly represented warning readiness. Flood risk intelligence becomes stronger when observation, forecast, threshold, mapping, communication, and response are evaluated together.
What Are Flood Monitoring Systems?
Flood monitoring systems are coordinated systems for observing hydrological conditions, detecting flood emergence, estimating flood behavior, and communicating flood risk in time to support protective action. They integrate direct observations of streamflow and water level with precipitation data, radar and satellite products, hydrological models, flood inundation tools, and warning procedures. A flood monitoring system is therefore not just a gauge, a rainfall product, a model run, or a map. It is an operational chain through which changing water conditions are turned into risk judgments that can support public action.
Such systems may include streamgages and river-stage monitoring stations; rainfall observations from gauges, radar, and satellite-derived products; soil-moisture and snowpack observations where relevant; flash-flood guidance and river forecast models; flood inundation maps and impact-support tools; telemetry and operational dashboards; warning protocols linked to emergency management and public communication; and post-event review systems that update thresholds, maps, and response procedures.
USGS streamflow and flood information systems provide real-time water data that support public understanding of river and flood conditions. NOAA’s National Water Prediction Service extends operational hydrology by connecting observations, forecasts, accumulated precipitation, flood inundation maps, and national-level water prediction services. WMO’s flood and flash-flood guidance programs frame flood monitoring within operational hydrology and end-to-end early warning. UNDRR’s early-warning definition makes clear that monitoring and forecasting must be linked to risk assessment, communication, and preparedness for timely action.
| Monitoring Form | Primary Question | Typical Evidence | Main Risk |
|---|---|---|---|
| River-stage monitoring | How high is the water at a forecast point or gauge location? | Stage, hydrograph, flood category, rate of rise | Stage is mistaken for consequence without local impact context. |
| Streamflow monitoring | How much water is moving through the channel? | Discharge, rating curve, flow trend, upstream contribution | Rating shifts, backwater, or debris alter the stage-discharge relationship. |
| Rainfall and storm monitoring | How much precipitation is falling, where, and how intensely? | Gauge rainfall, radar estimates, satellite rainfall, storm tracks | Localized rainfall maxima are missed or underestimated. |
| Flash-flood guidance | Where can fast-response flooding develop before conventional river forecasts provide enough lead time? | Rainfall intensity, basin response, soil wetness, remote-sensed precipitation, hydrological models | Small ungauged basins and urban drainage failures remain underdetected. |
| Flood forecasting | How will stage, discharge, and timing evolve? | Hydrological model output, forecast hydrographs, ensemble guidance, uncertainty | Forecast confidence and timing are not communicated clearly. |
| Flood inundation mapping | Where is flooding likely to occur at a given stage or forecast condition? | Stage-linked maps, hydraulic models, topography, exposure layers | Map assumptions are treated as exact local reality. |
| Warning and response monitoring | Were warnings issued, received, understood, and acted upon? | Alert logs, response times, road closures, evacuation records, after-action reviews | Hazard detection improves but protective action remains weak. |
Flood monitoring is therefore more than hydrological measurement. It is the structured conversion of changing water conditions into warning, response, and flood accountability.
Why Flood Monitoring Matters
Flood monitoring matters because floods are failures of time as much as failures of water control. Rising water becomes disastrous when observation, interpretation, communication, and response do not align early enough to reduce harm. Monitoring matters because it creates the possibility of recognizing the transition from ordinary hydrological variation to hazardous inundation before that transition is fully realized on the ground.
It also matters because flood processes unfold at very different speeds. Large-river flooding may permit days of buildup, forecast refinement, and inundation planning. Flash floods can develop far more rapidly and may depend on localized intense rainfall, short concentration times, steep terrain, burn scars, urban drainage limitations, or small ungauged tributaries. WMO’s Flash Flood Guidance System exists because fast, small-scale flash flooding requires specialized real-time guidance products based on remote-sensed precipitation and hydrological models, rather than reliance on slower conventional river-forecast structures alone.
Flood monitoring matters institutionally as well. Early warning systems are not only technical systems for sensing hazards. They are integrated systems of monitoring, forecasting, risk assessment, communication, and preparedness that enable timely action. This means flood monitoring is part of the operational backbone of disaster risk reduction and public protection.
| Need | Monitoring Contribution | Risk Without Monitoring |
|---|---|---|
| Protective lead time | Detects hazardous conditions early enough for warning and action. | Communities receive alerts after safe response windows have narrowed. |
| River forecasting | Tracks upstream flows, stage trends, and expected crest timing. | Emergency decisions rely on delayed or incomplete river information. |
| Flash-flood detection | Combines rainfall, basin response, and short-fuse guidance for rapid hazards. | Small basins and urban catchments flood before warning systems respond. |
| Inundation awareness | Translates hydrology into likely flood extent and local consequence. | Warnings remain abstract because people cannot see where water may go. |
| Infrastructure operation | Supports reservoir, gate, pump, road-closure, and drainage decisions. | Infrastructure is operated reactively during high-risk conditions. |
| Emergency coordination | Links forecast agencies, hydrological services, local officials, and responders. | Warnings, thresholds, and response actions remain fragmented. |
| Equitable protection | Identifies gaps in monitoring, mapping, and warning capacity. | Low-capacity and poorly mapped communities receive weaker lead time. |
Flood monitoring matters because the value of hydrological knowledge is measured not only by accuracy, but by whether it arrives early enough and clearly enough to reduce harm.
Flood Monitoring as Hydrological Risk Infrastructure
A deep synthesis of flood monitoring requires treating it as hydrological risk infrastructure. Flood monitoring does not merely record water conditions. It organizes how flood risk becomes knowable early enough to influence decisions. That requires observing hydrological variables, comparing them with thresholds and model expectations, estimating likely spatial consequence, and communicating uncertainty in forms that support road closure, evacuation, reservoir operations, infrastructure protection, or emergency coordination.
This means flood monitoring is inherently inferential. Gauge height is not yet flood consequence. Rainfall intensity is not yet inundation extent. Flood maps themselves are generally model-linked or stage-linked translations from hydrological condition to spatial consequence. Flood systems therefore work by converting multiple forms of evidence into estimates of hazard and exposure. Their task is not perfect certainty, but actionable foresight.
Seen in this way, flood monitoring sits between watershed observation and early warning. It inherits its sensing backbone from hydrological networks, but its operational role is distinct: to detect when observed or forecast conditions are crossing into dangerous hydrological states. Strong systems link hydrology, forecasting, mapping, communication, and preparedness rather than treating them as separate domains.
| Monitoring Choice | What Becomes More Visible | What May Remain Less Visible |
|---|---|---|
| Main-stem streamgages | River stage, hydrograph evolution, forecast-point trends. | Ungauged tributaries, urban drainage failures, localized flash flooding. |
| Radar and satellite rainfall | Storm intensity, spatial rainfall patterns, fast-changing forcing. | Ground-truth uncertainty, small-scale extremes, local drainage response. |
| Hydrological models | Forecast stage, flow, timing, and basin response. | Unmodeled infrastructure, debris, levee failure, local blockages. |
| Flood inundation maps | Likely spatial extent and place-based consequence. | Map uncertainty, terrain errors, changed structures, drainage failures. |
| Warning thresholds | Action levels, flood categories, protective triggers. | Social vulnerability, household capacity, informal exposure. |
| Public dashboards | Current conditions, forecasts, and flood categories. | Interpretive burden on users and uneven access to action guidance. |
Flood monitoring is powerful because it converts water movement into public evidence. It is risky when the system’s partial visibility is mistaken for complete knowledge of flood risk.
Flood Generation, Hydrometeorological Drivers, and Measurement Targets
Flood monitoring systems track multiple variables because flood risk emerges through interacting processes. Relevant drivers include rainfall amount and intensity, antecedent saturation, snowpack and melt, river stage, discharge, rate of rise, reservoir storage and release, channel conveyance, floodplain storage, land-surface runoff, urban drainage performance, groundwater conditions, levee state, and in some settings coastal or tidal backwater effects. Flood interpretation depends on combining observed hydrological conditions with forcing, storage, drainage, infrastructure, exposure, and forecast context.
Core measurement targets include river stage and streamflow; rate of rise and change in water level; rainfall amount, intensity, and accumulation; soil moisture and antecedent wetness where available; snow and melt contribution in relevant basins; reservoir and storage conditions where regulation matters; flood stage thresholds and local impact benchmarks; flood extent or inundation estimates; and warning dissemination and response timing.
These variables interact nonlinearly. Heavy rainfall over dry soils may behave differently from moderate rainfall over saturated catchments. The same stage can imply very different consequences depending on levee condition, backwater influence, urban drainage blockage, or floodplain occupancy. A rapid rate of rise may be operationally more urgent than a high but slowly increasing river level. Flood monitoring is therefore not a single-variable problem; it is a thresholded interpretation problem built around interacting hydrological, infrastructural, and social conditions.
| Driver or Target | Why It Matters | Typical Evidence | Interpretive Risk |
|---|---|---|---|
| Rainfall intensity | Controls flash-flood generation and rapid runoff. | Rain gauges, radar, satellite precipitation, nowcasting | Localized maxima are missed or smoothed. |
| Antecedent soil moisture | Determines how much rainfall becomes infiltration, storage, or runoff. | Soil-moisture sensors, modeled wetness, remote products | Rainfall is interpreted without basin storage context. |
| River stage | Shows water level at a gauge or forecast point. | Streamgage, hydrograph, flood category | Stage is treated as impact without local threshold context. |
| Discharge | Shows volume of water moving through a channel. | Streamflow estimate, rating curve, flow model | Stage-discharge relation shifts during extreme conditions. |
| Rate of rise | Signals urgency and shrinking lead time. | Hydrograph slope, short-interval stage change | High urgency is missed when focus remains on absolute stage alone. |
| Reservoir and storage operations | Influence downstream flow timing and magnitude. | Reservoir level, release schedule, gate status | Operational changes are omitted from forecast interpretation. |
| Inundation extent | Translates hydrology into place-based hazard. | Stage-linked maps, hydraulic models, satellite or aerial confirmation | Mapped extent is treated as exact under changing local conditions. |
| Exposure and vulnerability | Determine who and what is at risk. | Population, roads, critical facilities, social vulnerability, infrastructure layers | Hydrological severity is reported without consequence context. |
Flood risk detection requires a multi-signal architecture because no single variable can answer when water becomes dangerous, where inundation will occur, or who has enough time to act.
Key Analytical Distinctions
Flood monitoring is not the same as general watershed monitoring. Watershed monitoring networks observe basin condition broadly; flood monitoring is specifically oriented toward hazardous water rise, inundation, and protective lead time.
Stage is not the same as discharge, and neither is identical to impact. Stage describes water level at a point, discharge describes flow volume passing through a section, and impact depends on local topography, infrastructure, defenses, and exposure. The same stage can imply different social consequence in different locations.
Observation is not the same as warning. A gauge or rainfall field may show dangerous conditions, but warning requires interpretation, communication, and preparedness capacity.
River-flood monitoring is not the same as flash-flood monitoring. Main-stem floods often allow longer forecast horizons and cumulative basin tracking, whereas flash floods can emerge rapidly from intense rainfall and short response times and require specialized guidance products.
Flood mapping is not the same as flood measurement. Inundation maps are indispensable for consequence translation, but they are generally stage-linked or model-based approximations of likely extent rather than direct measurements of every flooded surface.
Hazard is not the same as risk. Flood hazard concerns water depth, velocity, extent, or timing. Flood risk also depends on exposure, vulnerability, capacity, and the ability to take protective action.
| Distinction | Why It Matters | Design Implication |
|---|---|---|
| Watershed monitoring versus flood monitoring | Broad basin observation does not automatically support warning. | Define flood-specific thresholds, timing, and response workflows. |
| Stage versus discharge | Water level and flow volume answer different questions. | Maintain rating-curve, backwater, and channel-condition context. |
| Hydrological condition versus impact | Flood consequence depends on local exposure and vulnerability. | Link forecasts to inundation, roads, buildings, and social vulnerability. |
| Observation versus warning | Measurements reduce harm only when interpreted and communicated. | Connect data systems to alert protocols and emergency management. |
| Forecast versus certainty | Useful warnings often precede high confidence. | Communicate probability, confidence, scenario range, and action thresholds. |
| Map versus territory | Inundation maps depend on assumptions and local conditions. | Maintain map caveats, validation, and post-event updates. |
These distinctions prevent flood monitoring from being reduced to water-level displays or map layers. The system’s purpose is not only to observe hydrology, but to support protective action under uncertainty.
System Architecture: From Observation to Flood Warning
Flood monitoring systems operate as layered architectures that connect hydrological observation to warning and response. Streamgages, rainfall networks, radar, satellites, soil-moisture products, snow data, and infrastructure sensors collect real-time or near-real-time conditions. Measurements are time-stamped, georeferenced, quality-checked, and transmitted into operational data systems. Observations are interpreted through thresholds, rating relations, hydrological expectations, and forecast models. Model outputs estimate likely future stage, flow, timing, and flood potential. Risk translation layers connect hydrology to inundation, flood categories, exposed assets, and local consequence benchmarks. Warning and action systems then communicate risk and support response, closures, evacuations, or mitigation action.
| Stage | Transformation | Failure Risk |
|---|---|---|
| Hydrometeorological process | Rainfall, runoff, storage, flow, drainage, and infrastructure conditions evolve. | The system monitors too few drivers to detect flood emergence. |
| Observation | Gages, rainfall products, satellites, and sensors capture partial evidence. | Blind spots, failed instruments, ungauged tributaries, or sparse rainfall data. |
| Telemetry | Data are transmitted into operational platforms. | Missing, stale, delayed, or unflagged observations. |
| Validation | Records are checked for plausibility, rating status, and input quality. | Faulty observations become forecast inputs or alerts. |
| Forecasting | Models estimate likely stage, flow, timing, and flood evolution. | Forecasts are used beyond their valid horizon or basin context. |
| Risk translation | Hydrological conditions are linked to flood categories, inundation extent, and impacts. | Forecast values remain abstract and difficult for local action. |
| Warning | Agencies issue alerts, briefings, maps, and public messages. | Messages are late, unclear, inconsistent, or unactionable. |
| Response and review | Emergency actions occur and lessons are used to revise the system. | The system fails to learn from missed events, false alarms, or observed impacts. |
This architecture matters because a flood monitoring system is only as strong as the coupling among its layers. Accurate observation without forecast interpretation may produce weak lead time. Good forecasts without impact translation may be hard to use locally. Warning without maps, thresholds, or preparedness may leave people uncertain about consequence. The system works when sensing, modeling, thresholds, communication, and response are operationally linked.
Core System Elements: Gages, Rainfall, Models, and Mapping
Streamgages provide the hydrological backbone of flood monitoring. They anchor flood-stage comparison, hydrograph tracking, trend detection, forecast calibration, and public situational awareness during events. Streamgages are powerful because they provide direct evidence of channel response, but their meaning depends on station placement, telemetry, rating curves, local flood thresholds, and the representativeness of the monitored reach.
Rainfall observations are essential because many floods are rainfall-driven. Rain gauges, radar, and satellite estimates describe storm forcing across space and time. Flash-flood systems particularly depend on high-frequency rainfall estimation combined with basin-response models because hazardous conditions may develop before downstream river gauges provide sufficient warning.
Hydrological forecast systems extend monitoring from present condition to likely future state. River forecast models, flash-flood guidance systems, and national-scale water models convert hydrometeorological inputs into estimates of stage, discharge, timing, flood potential, and uncertainty. Forecast systems are central because the public value of flood monitoring often depends on knowing what is likely to happen next, not only what is happening now.
Flood inundation mapping provides the bridge from hydrology to place-based consequence. Inundation products help answer not only how high water may get, but where flooding may occur, which roads or facilities may be affected, and how flood categories translate into spatial risk. These maps become most valuable when their assumptions, update logic, uncertainty, and local limitations are clearly documented.
| Element | Role | Evidence Needed | Failure Mode |
|---|---|---|---|
| Streamgages | Measure stage and support streamflow estimation and flood categories. | Gauge metadata, rating curve, flood threshold, telemetry status. | Gauge failure, shifted rating, or poor local representativeness. |
| Rainfall networks | Measure forcing conditions that generate runoff. | Gauge/radar/satellite source, accumulation window, intensity, quality flags. | Small-scale rainfall extremes are missed or underestimated. |
| Soil moisture and snow context | Explain storage conditions that affect runoff generation. | Antecedent wetness, snowpack, melt potential, basin state. | Rainfall is interpreted without storage context. |
| Hydrological models | Estimate future flow, stage, timing, and flood potential. | Model card, inputs, calibration, uncertainty, horizon. | Forecasts are overtrusted beyond valid context. |
| Flash-flood guidance | Supports rapid warning in small fast-response basins. | Remote precipitation, basin thresholds, guidance products, update frequency. | Short-fuse hazards emerge before warnings are actionable. |
| Inundation maps | Translate stage or forecast into expected flood extent. | Map metadata, stage linkage, terrain source, hydraulic assumptions. | Mapped outputs are treated as perfect local measurement. |
| Warning protocols | Convert forecast risk into authoritative public communication. | Alert template, dissemination channel, escalation rules. | Risk is detected but not communicated effectively. |
Together, these elements show that flood monitoring is a composite system. Gages measure channel response, rainfall systems characterize forcing, models project evolution, maps translate hydrology into consequence, and warning protocols connect risk intelligence to action. None of these alone is sufficient for robust flood-risk detection.
Thresholds, Impact Curves, and Protective Lead Time
The operational heart of flood monitoring is threshold interpretation. A system becomes decision-relevant when it can identify when observed or forecast conditions are approaching levels associated with inundation, infrastructure disruption, transportation closure, or danger to life and property. This is why flood stage, local flood categories, impact benchmarks, and inundation products matter so much: they translate hydrological values into operational meaning.
But thresholds are not universal. The same water level can have very different consequences in different places depending on channel geometry, levees, bridges, drainage bottlenecks, floodplain development, road elevation, building placement, and local vulnerability. Thresholds are therefore local consequence curves as much as hydrological markers. They represent judgments about when water movement becomes socially consequential, not just when it becomes numerically notable.
Lead time is the crucial output. The purpose of flood monitoring is not to document a flood perfectly after the fact, but to provide enough time for protective action before impacts peak. Yet lead time always trades against confidence. Warning earlier may increase useful preparation time but often with greater uncertainty; waiting for greater certainty may reduce false alarms but collapse the time window for action. Flood monitoring systems therefore manage a fundamental temporal tradeoff between certainty and usefulness.
| Concept | Meaning | Monitoring Requirement | Failure Risk |
|---|---|---|---|
| Action stage | Water level at which preparedness or operational attention increases. | Local threshold, notification protocol, trend tracking. | Early signals are ignored until flood stage is reached. |
| Flood stage | Water level associated with flooding impacts at a forecast point. | Stage record, impact description, local validation. | Stage category is used without understanding local consequence. |
| Impact curve | Relationship between water level, inundation, and consequences. | Road, structure, infrastructure, and population exposure mapping. | Warnings remain abstract and difficult to act upon. |
| Rate-of-rise trigger | Urgency indicator based on how fast water is rising. | Short-interval stage data, hydrograph slope, alert rule. | Fast-onset events are under-warned. |
| Protective lead time | Time between warning and expected impact. | Forecast timing, warning issuance time, response-time needs. | Warning arrives too late for evacuation or road closure. |
| Warning confidence | Degree of support for a forecast or alert. | Forecast uncertainty, model agreement, rainfall confidence, observation quality. | Uncertainty is hidden, producing either false confidence or inaction. |
The strongest flood monitoring systems treat thresholds as living operational knowledge. They require revision after events, infrastructure changes, land-use change, levee modifications, mapping updates, and observed failures.
Uncertainty, Blind Spots, and Failure Modes
Flood monitoring systems operate under significant uncertainty. Rainfall fields may be unevenly observed, tributaries may be ungauged, rating curves may shift during extreme events, debris and backwater can alter the stage-discharge relationship, levee or drainage-system failure can change flood behavior abruptly, and forecast models may struggle with local channel geometry or urban runoff pathways. Flood risk detection is therefore always conditional rather than absolute.
Flash floods are a particularly demanding failure mode because they compress the entire warning chain. There may be little time between rainfall onset, runoff concentration, and hazardous inundation. This is why flash-flood guidance systems focus on real-time guidance products for small-scale flash flooding using remote-sensed rainfall and hydrological models: conventional main-stem river forecasting alone is often too slow or too coarse for the fastest flood hazards.
Sparse coverage can create false reassurance. A monitored main stem may appear stable while a small ungauged tributary, urban drainage system, or backwater-affected reach produces severe local flooding. Inundation maps can be powerful where topography, thresholds, and hydraulic assumptions are strong, but weaker where local blockage, infrastructure change, levee dynamics, or drainage failure depart from modeled expectations. Strong flood monitoring therefore requires not only better data, but honesty about where observational and modeling blind spots remain.
| Failure Mode | How It Appears | Why It Matters | Mitigation |
|---|---|---|---|
| Gauge failure or telemetry outage | Missing, stale, flatlined, or delayed readings. | Operators may mistake missing data for stable conditions. | Telemetry completeness, redundant observations, stale-data flags. |
| Rating-curve shift | Stage-discharge relation changes during high flow. | Discharge estimates and forecasts become biased. | Post-event rating review, field verification, uncertainty note. |
| Rainfall underestimation | Radar, satellite, or sparse gauge networks miss local intensity. | Flash-flood potential is underestimated. | Multi-source rainfall, gauge correction, nowcasting, local reports. |
| Ungauged tributary flooding | Main-stem observations look normal while local flooding occurs. | Communities receive false reassurance. | Flash-flood guidance, local sensors, basin response screening. |
| Urban drainage failure | Localized flooding occurs from blocked or overloaded drainage. | Flooding is not captured by river-stage monitoring alone. | Urban sensors, stormwater models, field reports, drainage maintenance data. |
| Inundation-map mismatch | Mapped extent differs from observed flooding. | Road closure, evacuation, and public decisions may be misdirected. | Map validation, post-event update, local infrastructure caveats. |
| Warning-action gap | Alerts are issued but not understood or acted upon. | Detection does not translate into reduced harm. | Message testing, preparedness planning, trusted channels, response review. |
Uncertainty does not mean flood monitoring is weak. It means monitoring systems must be designed to expose, communicate, and manage uncertainty rather than hide it behind deterministic maps or single-value forecasts.
Governance, Coordination, and Uneven Protection
Flood monitoring systems are governance infrastructures because their components span meteorological agencies, hydrological services, emergency managers, data providers, forecasters, infrastructure operators, local governments, and public communication systems. Flood basins and storm systems cross boundaries even when warning institutions do not. Upstream observations may be crucial for downstream warnings. River basins may traverse jurisdictions even when emergency protocols are local. Effective flood monitoring therefore depends on interoperable data, shared thresholds, and coordinated operational interpretation rather than isolated local instrumentation alone.
This governance dimension matters because early warning requires more than detection. It requires risk knowledge, monitoring, forecasting, warning dissemination, communication, preparedness, and response capacity. A technically sophisticated forecast that does not reach the right people in actionable form remains incomplete as a public-protection system. Likewise, a warning that reaches people who lack transportation, shelter, trust, language access, or safe evacuation routes may not produce protection equitably.
Uneven lead time is a form of unequal protection. Some communities benefit from dense gauge networks, sophisticated inundation maps, strong emergency-management capacity, and trusted alert systems. Others rely on sparse observation, coarse forecasts, weak communications, or informal local knowledge. Weak flood monitoring is therefore not merely a technical gap. It is a governance vulnerability that distributes safety unevenly across places and populations.
| Governance Responsibility | Question | Evidence |
|---|---|---|
| Coverage governance | Which basins, tributaries, communities, and infrastructure assets are monitored or left blind? | Gauge coverage audit, ungauged-basin list, vulnerable-area review |
| Threshold governance | Who defines flood stages, action levels, and local impact triggers? | Threshold registry, local impact statements, revision history |
| Forecast governance | How are models validated, uncertainty communicated, and limitations documented? | Model card, forecast-performance review, uncertainty statement |
| Mapping governance | How are inundation maps maintained, validated, and caveated? | Map metadata, hydraulic assumptions, post-event updates |
| Warning governance | Who issues warnings, through which channels, and with what action guidance? | Warning protocol, message templates, dissemination log |
| Emergency coordination | Are hydrological services, meteorological services, local officials, and emergency managers aligned? | Coordination plan, exercises, briefing records, contact matrix |
| Equity and accessibility | Can warnings reach and support vulnerable populations? | Language access, evacuation access, trusted channels, social vulnerability review |
| Post-event learning | Does the system revise thresholds, maps, models, and protocols after events? | After-action review, forecast-error log, corrective actions |
Flood monitoring becomes trustworthy when governance connects technical evidence to public responsibility. The warning chain is only complete when people can understand the risk and act on it in time.
Future Directions
The future of flood monitoring lies in tighter integration across gages, rainfall estimation, hydrological modeling, inundation mapping, exposure data, social vulnerability analysis, and warning systems. National water services, expanded flood inundation mapping, flash-flood guidance, and broader early-warning frameworks all point toward more end-to-end, impact-aware flood intelligence.
Artificial intelligence, high-resolution hydrological modeling, satellite rainfall, crowdsourced observations, remote sensing of inundation, digital twins, and coupled infrastructure models will likely expand the ability to detect and forecast flood risk. But they will also make governance more important. If flood systems infer risk from multiple data streams and issue increasingly automated alerts, they must preserve input quality, model version, calibration status, uncertainty, map assumptions, warning authority, and post-event review. More sophisticated modeling does not remove the need for public accountability.
The deeper challenge is not simply to collect more hydrological data. It is to build systems that detect hazardous thresholds earlier, represent flash-flood and urban-drainage dynamics more credibly, map consequence more transparently, and communicate uncertainty in ways that still support action. Future systems will need stronger coverage in poorly observed regions, better coupling between basin monitoring and local warning, and more explicit integration among flood extent, infrastructure exposure, and social vulnerability.
Floods are not simply water events. They are failures of time, interpretation, and protection as much as failures of channel capacity. Where flood monitoring systems are strong, hydrology becomes more visible, more mappable, and more governable before catastrophe unfolds. Where they are weak, uncertainty often arrives downstream as loss. In that sense, flood monitoring systems are infrastructures of hydrological lead time, unequal protection, and flood accountability.
Deployment Readiness Gate
Before a flood monitoring system is used for warning, evacuation support, road closure, reservoir operations, emergency response, public dashboards, insurance or planning claims, or resilience assessment, it should pass a deployment readiness gate. This gate should test whether the system is observationally sufficient, forecast-aware, impact-linked, communication-ready, uncertainty-transparent, and response-capable.
| Readiness Area | Required Question | Pass Evidence |
|---|---|---|
| Purpose readiness | Does the system define flood type, geography, protected population, lead-time goal, and decision use? | Flood-risk objective manifest, decision-use statement, lead-time target |
| Observation readiness | Are stage, discharge, rainfall, soil wetness, snowmelt, reservoir, or relevant driver observations sufficient? | Gauge registry, rainfall inventory, driver matrix, coverage audit |
| Telemetry readiness | Are latency, missingness, stale data, outage status, and update frequency visible? | Telemetry completeness report, stale-data flags, outage log |
| Validation readiness | Are gauge status, rating curves, rainfall products, and model inputs quality-checked? | QA/QC policy, rating review, rainfall validation, sensor maintenance log |
| Forecast readiness | Are forecast models, flash-flood guidance, uncertainty, and forecast horizon documented? | Forecast model card, guidance record, uncertainty statement |
| Impact readiness | Are hydrological thresholds linked to inundation, roads, structures, critical facilities, and exposed populations? | Impact-threshold registry, inundation-map linkage, exposure layer |
| Warning readiness | Are alerts authoritative, understandable, channel-diverse, and tied to action guidance? | Warning protocol, message templates, dissemination plan |
| Response readiness | Are emergency managers, infrastructure operators, and public agencies prepared to act on warnings? | Response plan, coordination matrix, exercises, road-closure and evacuation workflows |
| Governance readiness | Are equity, public caveats, threshold revisions, forecast errors, and post-event learning defined? | Governance log, public evidence package, after-action review process |
This readiness gate prevents flood monitoring from being treated as complete merely because gauges, forecasts, or maps exist. The stronger standard is whether the system can support timely, trusted, and accountable protective action.
Data and Configuration Artifacts
A reproducible flood-monitoring workflow should include explicit artifacts for objectives, observation networks, telemetry, thresholds, forecasts, inundation maps, warnings, response actions, coverage gaps, and governance. These artifacts make flood warnings auditable rather than hidden inside dashboards, forecast products, or informal response routines.
| Artifact | Purpose | Suggested Path |
|---|---|---|
| Flood-risk objective manifest | Defines flood type, geography, protected population, lead-time goal, and decision use. | config/flood_risk_objective.yml |
| Gauge and sensor registry | Stores streamgage, rainfall, reservoir, soil-moisture, and related station metadata. | data/gauge_sensor_registry.csv |
| Hydrometeorological driver matrix | Maps rainfall, soil wetness, snowmelt, streamflow, storage, and infrastructure drivers to flood mechanisms. | data/hydrometeorological_driver_matrix.csv |
| Telemetry status records | Tracks expected observations, received observations, latency, stale data, and outage status. | data/telemetry_status_records.csv |
| Flood observation records | Stores stage, discharge, rainfall, rate of rise, reservoir level, and other event observations. | data/flood_observation_records.csv |
| Threshold and impact registry | Documents action stage, flood stage, local impacts, warning categories, and response triggers. | data/threshold_impact_registry.csv |
| Forecast model card | Documents forecast inputs, model type, calibration, valid horizon, uncertainty, and intended use. | model_cards/flood_forecast_model_card.md |
| Inundation-map linkage | Connects stage or forecast category to expected inundation extent and exposed assets. | data/inundation_map_linkage.csv |
| Warning and response log | Tracks warning issuance, protective action, road closure, evacuation support, and outcomes. | data/warning_response_log.csv |
| Coverage and equity audit | Assesses ungauged basins, vulnerable communities, unmapped areas, and communication gaps. | data/coverage_equity_audit.csv |
| Flood governance log | Tracks threshold revisions, missed events, false alarms, map updates, and after-action findings. | data/flood_monitoring_governance_log.csv |
These artifacts turn flood monitoring into a reproducible early-warning evidence system rather than a loose collection of gauges, forecasts, maps, and emergency messages.
Mathematical Lens: Flood Hazard, Lead Time, Thresholds, and Warning Readiness
Several simple metrics can help evaluate flood-monitoring readiness. These metrics are not substitutes for hydrological expertise, local emergency management, hydraulic modeling, public communication, or lived community knowledge, but they make flood-warning evidence quality more inspectable.
R_{\mathrm{rise}} = \frac{h_t – h_{t-\Delta t}}{\Delta t}
\]
Interpretation: Rate of rise measures how quickly water level is increasing, which is critical for flash-flood and short-fuse warning contexts.
C_{\mathrm{telemetry}} = \frac{N_{\mathrm{received\ observations}}}{N_{\mathrm{expected\ observations}}}
\]
Interpretation: Telemetry completeness shows whether operational systems are receiving enough observations to support warning decisions.
L_{\mathrm{protective}} = T_{\mathrm{impact}} – T_{\mathrm{warning}}
\]
Interpretation: Protective lead time measures how much time remains between a warning and expected flood impact.
R_{\mathrm{risk}} = H_f \times E_x \times V_u
\]
Interpretation: Flood risk depends on hazard, exposure, and vulnerability rather than hazard intensity alone.
Q_{\mathrm{flood\ warning}} =
w_1C_g +
w_2C_r +
w_3C_t +
w_4C_f +
w_5M_i +
w_6L_p +
w_7C_w +
w_8R_c +
w_9G_r
\]
Interpretation: Flood-warning quality depends on gauge coverage, rainfall coverage, telemetry completeness, forecast confidence, inundation-map readiness, protective lead time, communication readiness, response capacity, and governance readiness.
These measures evaluate flood monitoring as an early-warning evidence system. They ask whether the system can produce enough timely, validated, and locally meaningful intelligence to support protective action.
Python Workflow: Flood Monitoring Readiness and Hydrological Risk Evidence Quality
A Python workflow can demonstrate how flood monitoring systems might be evaluated for gauge coverage, rainfall coverage, telemetry completeness, forecast confidence, inundation-map readiness, protective lead time, communication readiness, response capacity, and governance readiness. The purpose is not to create a universal flood-warning score, but to make the evidence-quality dimensions visible.
from dataclasses import dataclass
from typing import List
import pandas as pd

@dataclass
class FloodMonitoringProgram:
    program_id: str
    flood_type: str
    geography: str
    gauge_coverage: float
    rainfall_coverage: float
    telemetry_completeness: float
    forecast_confidence: float
    inundation_map_readiness: float
    protective_lead_time: float
    communication_readiness: float
    response_capacity: float
    governance_readiness: float
    high_stakes_use: bool

def flood_warning_quality(program: FloodMonitoringProgram) -> float:
    return (
        0.12 * program.gauge_coverage +
        0.11 * program.rainfall_coverage +
        0.12 * program.telemetry_completeness +
        0.12 * program.forecast_confidence +
        0.11 * program.inundation_map_readiness +
        0.12 * program.protective_lead_time +
        0.10 * program.communication_readiness +
        0.10 * program.response_capacity +
        0.10 * program.governance_readiness
    )

def classify_review_priority(program: FloodMonitoringProgram, score: float) -> str:
    if program.high_stakes_use and program.telemetry_completeness < 0.80:
        return "high_stakes_telemetry_review"
    if program.gauge_coverage < 0.70:
        return "gauge_coverage_review"
    if program.rainfall_coverage < 0.70:
        return "rainfall_coverage_review"
    if program.forecast_confidence < 0.70:
        return "forecast_confidence_review"
    if program.inundation_map_readiness < 0.70:
        return "inundation_mapping_review"
    if program.protective_lead_time < 0.70:
        return "lead_time_review"
    if program.communication_readiness < 0.75:
        return "communication_readiness_review"
    if program.response_capacity < 0.75:
        return "response_capacity_review"
    if program.governance_readiness < 0.75:
        return "governance_readiness_review"
    if score < 0.75:
        return "flood_warning_quality_review"
    return "routine_monitoring"

programs: List[FloodMonitoringProgram] = [
    FloodMonitoringProgram(
        "mainstem-river-forecast-system",
        "riverine",
        "large_river_basin",
        0.86,
        0.80,
        0.91,
        0.82,
        0.78,
        0.84,
        0.80,
        0.82,
        0.84,
        True,
    ),
    FloodMonitoringProgram(
        "urban-flash-flood-warning",
        "flash_flood",
        "urban_catchments",
        0.64,
        0.78,
        0.82,
        0.68,
        0.62,
        0.58,
        0.76,
        0.70,
        0.74,
        True,
    ),
    FloodMonitoringProgram(
        "reservoir-regulated-river-monitoring",
        "regulated_river",
        "reservoir_downstream_reach",
        0.80,
        0.76,
        0.88,
        0.78,
        0.74,
        0.80,
        0.78,
        0.76,
        0.80,
        True,
    ),
    FloodMonitoringProgram(
        "rural-ungauged-basin-screening",
        "flash_flood",
        "rural_tributaries",
        0.52,
        0.66,
        0.70,
        0.62,
        0.50,
        0.54,
        0.68,
        0.62,
        0.66,
        True,
    ),
]

records = []
for program in programs:
    score = flood_warning_quality(program)
    records.append({
        "program_id": program.program_id,
        "flood_type": program.flood_type,
        "geography": program.geography,
        "gauge_coverage": program.gauge_coverage,
        "rainfall_coverage": program.rainfall_coverage,
        "telemetry_completeness": program.telemetry_completeness,
        "forecast_confidence": program.forecast_confidence,
        "inundation_map_readiness": program.inundation_map_readiness,
        "protective_lead_time": program.protective_lead_time,
        "communication_readiness": program.communication_readiness,
        "response_capacity": program.response_capacity,
        "governance_readiness": program.governance_readiness,
        "flood_warning_quality": round(score, 3),
        "review_priority": classify_review_priority(program, score),
    })

df = pd.DataFrame(records)
print(df.sort_values(["review_priority", "flood_warning_quality"]))
This workflow treats flood monitoring programs as warning systems, not merely data systems. A program is not ready because it has gauges or models. It must preserve enough evidence about coverage, telemetry, forecast confidence, inundation translation, lead time, communication, response, and governance to support the intended protective claim.
R Workflow: Flood Warning, Lead-Time, and Governance Readiness
An R workflow can support flood-monitoring governance by summarizing readiness across riverine, flash-flood, reservoir-regulated, urban-drainage, and ungauged-basin contexts. This is useful for monitoring-program audits, early-warning readiness reviews, emergency planning, and public evidence packages.
library(dplyr)
library(readr)

flood_programs <- tribble(
  ~program_id, ~flood_type, ~geography, ~gauge_coverage, ~rainfall_coverage, ~telemetry_completeness, ~forecast_confidence, ~inundation_map_readiness, ~protective_lead_time, ~communication_readiness, ~response_capacity, ~governance_readiness, ~high_stakes_use,
  "mainstem-river-forecast-system", "riverine", "large_river_basin", 0.86, 0.80, 0.91, 0.82, 0.78, 0.84, 0.80, 0.82, 0.84, TRUE,
  "urban-flash-flood-warning", "flash_flood", "urban_catchments", 0.64, 0.78, 0.82, 0.68, 0.62, 0.58, 0.76, 0.70, 0.74, TRUE,
  "reservoir-regulated-river-monitoring", "regulated_river", "reservoir_downstream_reach", 0.80, 0.76, 0.88, 0.78, 0.74, 0.80, 0.78, 0.76, 0.80, TRUE,
  "rural-ungauged-basin-screening", "flash_flood", "rural_tributaries", 0.52, 0.66, 0.70, 0.62, 0.50, 0.54, 0.68, 0.62, 0.66, TRUE
)

flood_summary <- flood_programs %>%
  mutate(
    flood_warning_quality = round(
      0.12 * gauge_coverage +
      0.11 * rainfall_coverage +
      0.12 * telemetry_completeness +
      0.12 * forecast_confidence +
      0.11 * inundation_map_readiness +
      0.12 * protective_lead_time +
      0.10 * communication_readiness +
      0.10 * response_capacity +
      0.10 * governance_readiness,
      3
    ),
    review_priority = case_when(
      high_stakes_use & telemetry_completeness < 0.80 ~ "high_stakes_telemetry_review",
      gauge_coverage < 0.70 ~ "gauge_coverage_review",
      rainfall_coverage < 0.70 ~ "rainfall_coverage_review",
      forecast_confidence < 0.70 ~ "forecast_confidence_review",
      inundation_map_readiness < 0.70 ~ "inundation_mapping_review",
      protective_lead_time < 0.70 ~ "lead_time_review",
      communication_readiness < 0.75 ~ "communication_readiness_review",
      response_capacity < 0.75 ~ "response_capacity_review",
      governance_readiness < 0.75 ~ "governance_readiness_review",
      flood_warning_quality < 0.75 ~ "flood_warning_quality_review", TRUE ~ "routine_monitoring" ) ) %>%
  arrange(review_priority, flood_warning_quality)

print(flood_summary)

write_csv(
  flood_summary,
  "outputs/flood_monitoring_readiness_summary.csv"
)
The R workflow emphasizes that flood-warning review should account for monitoring coverage, rainfall evidence, telemetry, forecasts, inundation translation, protective lead time, communication readiness, response capacity, and governance. These dimensions help prevent flood monitoring systems from being judged by gauge availability alone.
Systems Code: Gages, Rainfall, Telemetry, Inundation, Alerts, and Governance Logs
Flood monitoring depends on full-stack hydrological and emergency-management systems code. The stack includes gauge registries, telemetry records, rainfall products, streamflow observations, forecast outputs, threshold registries, inundation-map linkages, alert logs, response workflows, warning messages, exposure layers, dashboards, QA/QC rules, and governance records. A serious companion repository should therefore include both analytical workflows and systems-code scaffolding.
| Language / Tool | Role in Companion Repository | Example Use |
|---|---|---|
| Python | Flood-warning readiness scoring, lead-time review, telemetry checks, and risk triage | Operational evidence-quality scoring and review prioritization |
| R | Hydrological readiness summaries, warning-performance tables, and governance reporting | Monitoring-program audit outputs and public evidence summaries |
| SQL | Gauge registries, observation records, thresholds, alerts, response logs, and governance records | Auditable flood-monitoring database schema |
| GeoJSON | Gauge locations, flood-prone areas, inundation zones, exposed assets, and warning geographies | Spatial registry for flood monitoring and inundation context |
| TypeScript | Dashboard and platform data models | Gauge cards, flood-alert panels, lead-time displays, warning-readiness views |
| Go | Lightweight flood-monitoring status endpoint | Expose telemetry, forecast, warning, and response readiness |
| Rust | Safe validation CLI for flood observation and warning records | Validate timestamps, units, quality flags, threshold fields, and alert records |
| C / C++ | Low-level hydrograph and alert-event examples | Demonstrate embedded/edge event records and bounded alert queues |
| Shell scripts | Reproducible directory, validation, and export workflows | One-command scaffold validation and output generation |
This breadth is appropriate because flood monitoring is not only hydrological measurement. It is evidence infrastructure spanning observations, telemetry, models, maps, warnings, emergency management, and public accountability.
GitHub Repository
A companion repository for this article should translate the flood-monitoring framework into reproducible technical scaffolding. The repository should include flood-risk objective manifests, gauge and sensor registries, hydrometeorological driver matrices, telemetry records, flood-observation tables, threshold and impact registries, forecast model cards, inundation-map linkages, warning and response logs, coverage audits, SQL schemas, dashboard data types, and governance records.
Testing and Validation
Testing flood monitoring systems requires more than confirming that gauges transmit readings or forecasts appear on dashboards. It requires validating observation coverage, telemetry, gauge status, rainfall quality, rating curves, model performance, inundation-map assumptions, threshold relevance, warning lead time, communication effectiveness, response capacity, and post-event learning. A flood monitoring program can appear sophisticated while producing weak protection if any part of the chain is undocumented or untested.
| Test Type | Purpose | Example Test |
|---|---|---|
| Gauge coverage test | Ensure important rivers, tributaries, basins, and flood-prone areas are observed. | Compare gauge network with flood history, vulnerable areas, and ungauged basins. |
| Rainfall coverage test | Ensure storm forcing is captured at useful spatial and temporal resolution. | Compare gauge, radar, and satellite rainfall estimates during events. |
| Telemetry test | Ensure expected observations arrive with acceptable latency and completeness. | Calculate received versus expected observations and stale-data intervals. |
| Rating and stage test | Ensure stage-discharge relations and flood categories remain valid. | Review rating curves, high-flow measurements, and post-event shifts. |
| Forecast-performance test | Ensure model timing, crest height, and uncertainty are evaluated. | Compare forecast hydrographs with observed event outcomes. |
| Inundation-map test | Ensure mapped flood extent is plausible and appropriately caveated. | Compare forecast maps with observed inundation, road closures, or remote sensing. |
| Threshold and impact test | Ensure action levels correspond to real local consequences. | Review road, structure, facility, and evacuation impacts at observed stages. |
| Warning dissemination test | Ensure messages reach the right people in understandable and actionable form. | Audit warning channels, language access, message timing, and delivery logs. |
| Response workflow test | Ensure warnings connect to protective action. | Trace warning-to-action time for road closure, evacuation support, or operations. |
| Post-event learning test | Ensure events revise thresholds, maps, models, and protocols. | Review after-action findings and corrective-action completion. |
Validation should test the flood monitoring system as an early-warning chain. The decisive question is not whether hydrological data exist, but whether those data can support timely, trusted, and accountable protective action.
Operational Signals and Flood-Monitoring Observability
Flood monitoring systems must observe themselves. A system that monitors flooding but cannot report gauge health, telemetry completeness, stale data, rainfall-quality confidence, forecast performance, map validity, warning lead time, alert delivery, response outcomes, and post-event revisions is operationally fragile. Monitoring-system observability should track both hydrological evidence health and warning-system health.
| Signal | Why It Matters | Failure Indicator |
|---|---|---|
| Gauge health | Determines whether stage and streamflow signals are current and valid. | Flatline, missing data, drift, damaged station, rating uncertainty. |
| Telemetry completeness | Determines whether operational systems receive expected observations. | Hidden gaps, stale readings, delayed data, communications outage. |
| Rainfall quality | Determines whether storm forcing is accurately represented. | Radar/gauge mismatch, satellite uncertainty, sparse local rainfall data. |
| Rate-of-rise alerts | Determines whether rapidly developing events are recognized early. | Fast hydrograph rise without alert or escalation. |
| Forecast performance | Determines whether forecast timing and crest estimates remain trustworthy. | Repeated timing errors, underestimated crests, poorly calibrated uncertainty. |
| Inundation-map readiness | Determines whether hydrology can be translated into spatial consequence. | No map, stale terrain assumptions, missing exposure layer, weak validation. |
| Warning lead time | Determines whether alerts provide enough time for protective action. | Warning issued too close to impact for effective response. |
| Communication delivery | Determines whether warnings reach intended audiences. | Channel failure, language/access gaps, message ambiguity. |
| Response closure | Determines whether warnings produce action and learning. | Alerts lack documented response, outcome, or after-action review. |
| Coverage equity | Determines whether protection is distributed fairly. | High-risk communities remain ungauged, unmapped, or weakly alerted. |
Operational observability protects flood monitoring from silent evidence degradation. It helps ensure that the appearance of hydrological awareness does not outlast the quality and accountability of the warning system beneath it.
Engineer and Researcher Checklist
- Define flood type, geography, lead-time goal, protected population, critical assets, and decision use before selecting tools.
- Distinguish watershed monitoring, flood monitoring, forecasting, inundation mapping, warning, and emergency response.
- Document gauge locations, rainfall sources, telemetry intervals, units, quality flags, rating status, and maintenance history.
- Track telemetry completeness, stale data, latency, outages, and station health.
- Use rainfall, soil wetness, snowmelt, reservoir, and local drainage context where relevant.
- Maintain flood-stage thresholds, action levels, local impact descriptions, and revision history.
- Connect forecasts to inundation maps, exposure layers, critical infrastructure, and local consequence statements.
- Communicate uncertainty without making warnings unusable.
- Differentiate riverine flood forecasts from flash-flood guidance and urban-drainage detection needs.
- Audit ungauged basins, low-capacity jurisdictions, vulnerable populations, and unmapped floodplain exposure.
- Connect warnings to emergency-management protocols, road closures, evacuation support, reservoir operations, and public communication.
- Use post-event reviews to update thresholds, maps, forecasts, communication protocols, and coverage priorities.
Where This Fits in the Series
This article connects Environmental Monitoring Systems to river and watershed monitoring, climate early-warning systems, smart water systems, environmental data platforms, risk and resilience, intelligent infrastructure, emergency management, and disaster risk reduction. It sits at the hydrological warning layer of the series: the point where water observation becomes protective lead time.
Within the broader series, this article provides the flood-risk framework that supports river and watershed monitoring networks, water quality monitoring systems, climate monitoring systems and environmental observation, climate early warning systems, smart water systems and environmental sensing, environmental data platforms and decision support systems, monitoring environmental risk and resilience, IoT architectures for environmental monitoring, edge computing in environmental monitoring, and embedded monitoring devices for field observation. Its role is to show that flood intelligence does not emerge from gauges alone. It emerges from the relationship among observation, telemetry, forecasting, thresholds, inundation mapping, communication, response, and governance.
Related articles
- Environmental Monitoring Systems
- River and Watershed Monitoring Networks
- Water Quality Monitoring Systems
- Climate Early Warning Systems
- Smart Water Systems and Environmental Sensing
- Environmental Data Platforms and Decision Support Systems
- Environmental Analytics and Monitoring Dashboards
- IoT Architectures for Environmental Monitoring
- Edge Computing in Environmental Monitoring
- Monitoring Environmental Risk and Resilience
Further reading
- National Oceanic and Atmospheric Administration (2026) National Water Prediction Service. Available at: https://water.noaa.gov/
- National Oceanic and Atmospheric Administration (2026) River Forecast Centers. Available at: https://water.noaa.gov/about/rfc
- National Oceanic and Atmospheric Administration (2026) National Water Model. Available at: https://water.noaa.gov/about/nwm
- National Oceanic and Atmospheric Administration Digital Coast (2026) National Water Prediction Service Flood Maps. Available at: https://coast.noaa.gov/digitalcoast/tools/floodmaps.html
- National Weather Service (2026) Flood Inundation Mapping Information. Available at: https://www.weather.gov/dmx/fim_info
- U.S. Geological Survey (2026) Streamflow Monitoring. Available at: https://www.usgs.gov/programs/groundwater-and-streamflow-information-program/streamflow-monitoring
- U.S. Geological Survey (2026) USGS Flood Information. Available at: https://www.usgs.gov/mission-areas/water-resources/science/usgs-flood-information
- U.S. Geological Survey (2026) Water Data for the Nation. Available at: https://waterdata.usgs.gov/
- U.S. Geological Survey (2026) National Water Dashboard. Available at: https://dashboard.waterdata.usgs.gov/
- World Meteorological Organization (2026) Floods. Available at: https://wmo.int/topics/floods
- World Meteorological Organization (2026) Hydrological Services. Available at: https://wmo.int/activities/services-hydrology/hydrological-services
- World Meteorological Organization (2026) Flash Flood Guidance System with Global Coverage. Available at: https://wmo.int/projects/ffgs
- United Nations Office for Disaster Risk Reduction (2026) Early Warnings for All. Available at: https://www.undrr.org/implementing-sendai-framework/sendai-framework-action/early-warnings-for-all
- UNESCO (2024) Early Warning Systems. Available at: https://www.unesco.org/en/disaster-risk-reduction/ews
References
- National Oceanic and Atmospheric Administration (2026) National Water Model. Available at: https://water.noaa.gov/about/nwm (Accessed: 14 May 2026).
- National Oceanic and Atmospheric Administration (2026) National Water Prediction Service. Available at: https://water.noaa.gov/ (Accessed: 14 May 2026).
- National Oceanic and Atmospheric Administration (2026) River Forecast Centers. Available at: https://water.noaa.gov/about/rfc (Accessed: 14 May 2026).
- National Oceanic and Atmospheric Administration Digital Coast (2026) National Water Prediction Service Flood Maps. Available at: https://coast.noaa.gov/digitalcoast/tools/floodmaps.html (Accessed: 14 May 2026).
- National Weather Service (2026) Flood Inundation Mapping Information. Available at: https://www.weather.gov/dmx/fim_info (Accessed: 14 May 2026).
- U.S. Geological Survey (2022) How USGS gages are used in flood forecasting. Available at: https://www.usgs.gov/publications/how-usgs-gages-are-used-flood-forecasting (Accessed: 14 May 2026).
- U.S. Geological Survey (2026) National Water Dashboard. Available at: https://dashboard.waterdata.usgs.gov/ (Accessed: 14 May 2026).
- U.S. Geological Survey (2026) Streamflow Monitoring. Available at: https://www.usgs.gov/programs/groundwater-and-streamflow-information-program/streamflow-monitoring (Accessed: 14 May 2026).
- U.S. Geological Survey (2026) USGS Flood Information. Available at: https://www.usgs.gov/mission-areas/water-resources/science/usgs-flood-information (Accessed: 14 May 2026).
- U.S. Geological Survey (2026) Water Data for the Nation. Available at: https://waterdata.usgs.gov/ (Accessed: 14 May 2026).
- United Nations Office for Disaster Risk Reduction (2026) Early Warnings for All. Available at: https://www.undrr.org/implementing-sendai-framework/sendai-framework-action/early-warnings-for-all (Accessed: 14 May 2026).
- UNESCO (2024) Early Warning Systems. Available at: https://www.unesco.org/en/disaster-risk-reduction/ews (Accessed: 14 May 2026).
- World Meteorological Organization (2026) Flash Flood Guidance System with Global Coverage. Available at: https://wmo.int/projects/ffgs (Accessed: 14 May 2026).
- World Meteorological Organization (2026) Floods. Available at: https://wmo.int/topics/floods (Accessed: 14 May 2026).
- World Meteorological Organization (2026) Hydrological Services. Available at: https://wmo.int/activities/services-hydrology/hydrological-services (Accessed: 14 May 2026).