
Last Updated August 5, 2026
AI infrastructure encompasses the data pipelines, compute systems, storage architectures, orchestration platforms, deployment environments, observability layers, security controls, and governance mechanisms required to operationalize machine learning at scale. At this level, artificial intelligence is not simply a model. It is a continuously running production system that ingests data, validates inputs, schedules compute, trains or updates models, serves predictions, monitors behavior, manages drift, supports rollback, and connects outputs to human, organizational, and institutional decision workflows.
Modern AI infrastructure transforms experimental machine learning into operational capability. A model trained in a notebook is only one artifact within a larger system. Production AI requires data engineering, feature management, distributed training, accelerator scheduling, storage throughput, model serving, version control, metadata capture, reliability engineering, security, access control, documentation, cost management, energy awareness, and lifecycle governance. These requirements make AI infrastructure a systems-engineering discipline that combines machine learning, distributed computing, cloud architecture, MLOps, software reliability, data governance, and organizational accountability.
Main Library
Publications
Article Map
Artificial Intelligence Systems
Related Topic
Data Systems & Analytics
Related Topic
Embedded & Edge Systems
Related Topic
Intelligent Infrastructure Systems
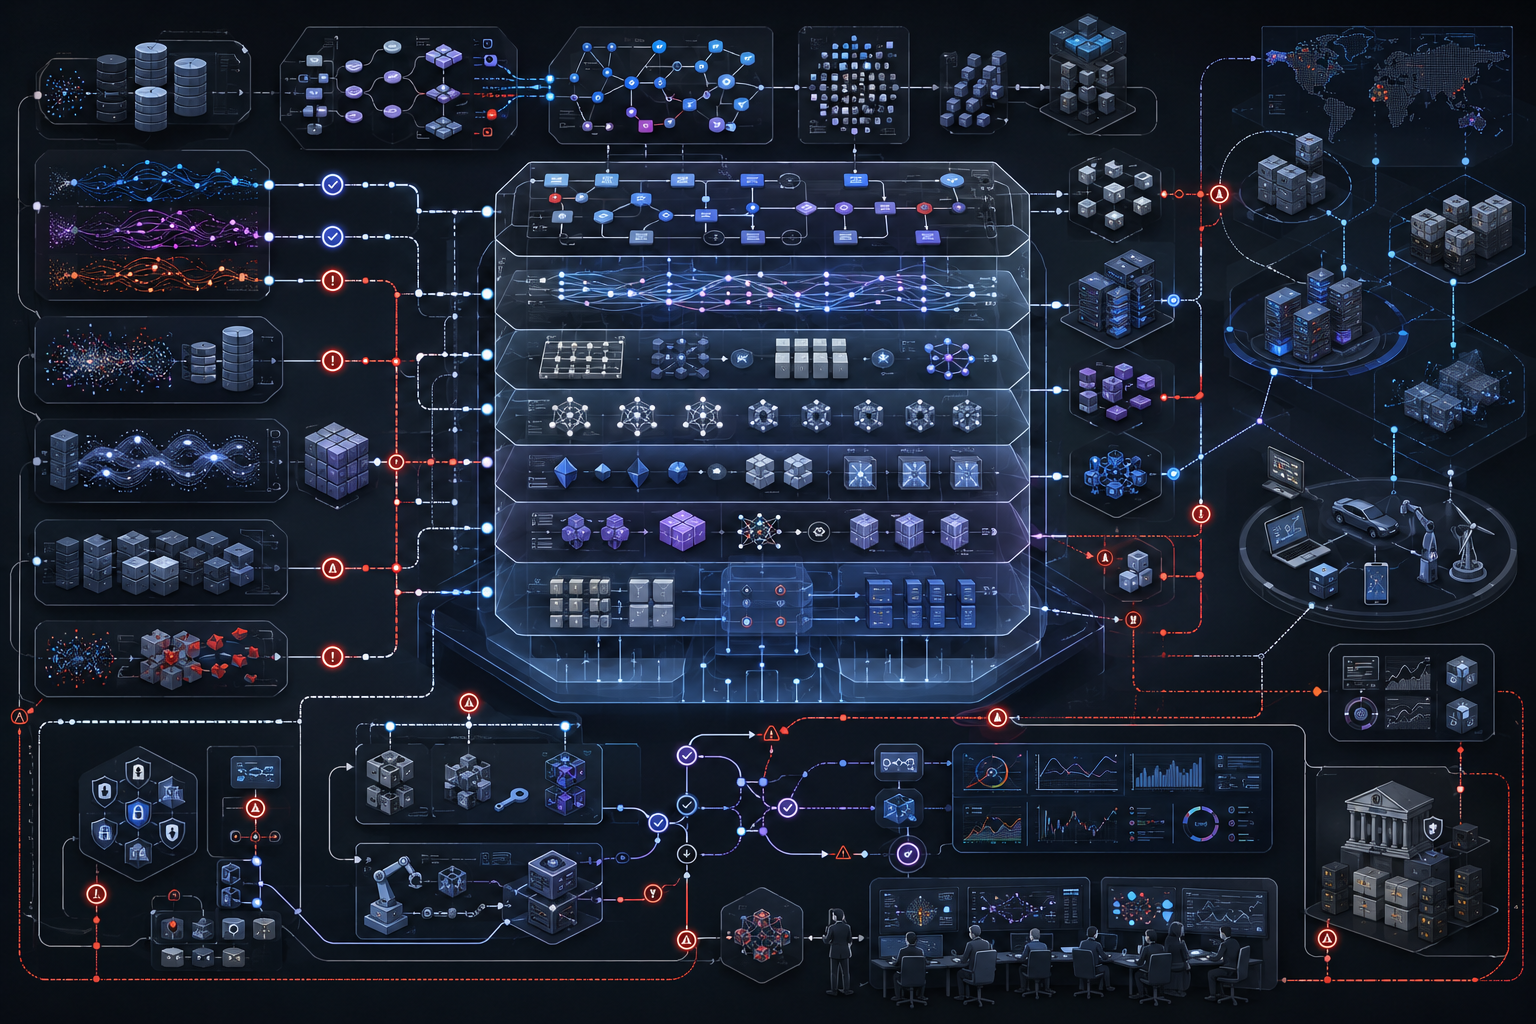
The central argument of this article is that AI infrastructure determines whether AI capability can become trustworthy production capacity. A model may perform well in an experiment, but production systems fail when data pipelines break, features drift, serving latency exceeds budget, accelerator utilization collapses, monitoring misses degradation, rollback is unavailable, governance records are incomplete, or security controls fail. Infrastructure is therefore not background plumbing. It is the operational layer where model capability becomes scalable, observable, reproducible, secure, governable, and accountable.
This article develops AI Infrastructure: Data Pipelines, Compute, and Deployment Systems as an advanced article within the Artificial Intelligence Systems knowledge series. It explains data pipelines, directed acyclic graph systems, distributed compute, GPUs, TPUs, model parallelism, data parallelism, storage architectures, feature stores, model registries, model serving, edge-cloud deployment, MLOps, observability, reliability, monitoring, lineage, governance, cost, energy, security, supply-chain risk, and technical debt. Selected Python and R examples appear here, while the full GitHub repository contains expanded computational scaffolding for pipeline DAG modeling, compute-utilization analysis, serving-capacity estimation, reliability scoring, observability metadata, SQL schemas, governance checklists, and advanced Jupyter notebooks.
Why AI Infrastructure Matters
AI infrastructure matters because machine learning systems only become useful when they can operate reliably outside experimental settings. A trained model may show strong benchmark performance, but production systems require stable data flow, scalable compute, repeatable training, reliable serving, monitoring, rollback, security, cost control, and governance. Without infrastructure, a model remains an artifact. With infrastructure, it becomes an operational system.
The infrastructure layer also determines whether AI can be trusted, maintained, and improved. If data pipelines are brittle, models degrade. If feature definitions differ between training and serving, predictions become unreliable. If monitoring is weak, drift goes unnoticed. If deployment systems lack rollback, failures persist. If lineage is missing, teams cannot reproduce or audit results. If governance is absent, infrastructure can scale risk as quickly as it scales capability.
AI infrastructure is therefore not merely technical plumbing. It is the operational foundation that makes AI systems reproducible, governable, secure, scalable, observable, and accountable.
Production\ AI = Model + Infrastructure + Monitoring + Governance
\]
Interpretation: A model becomes production AI only when it is embedded in reliable infrastructure, monitored continuously, and governed across its lifecycle.
| Infrastructure Layer | Question It Answers | Failure Mode | Production Consequence |
|---|---|---|---|
| Data pipelines | Can valid data reach training and serving systems reliably? | Broken schemas, missing records, stale feeds, silent upstream changes. | Models train or infer from invalid inputs. |
| Compute systems | Can training and inference workloads run efficiently? | Underutilized accelerators, scheduling contention, memory bottlenecks. | Costs rise, experiments slow, deployment becomes unreliable. |
| Storage and feature systems | Can data, features, metadata, and artifacts be retrieved consistently? | Version confusion, feature inconsistency, poor throughput, weak access control. | Training-serving skew and reproducibility failures increase. |
| Deployment systems | Can models serve predictions safely and at scale? | Latency spikes, insufficient replicas, weak rollback, brittle release processes. | Users receive slow, incorrect, or unavailable predictions. |
| Observability | Can teams see what the system is doing? | Drift, degraded performance, latency, and data defects go unnoticed. | Failure persists until discovered through harm or incident. |
| Governance | Can the system be reviewed, audited, and controlled? | Missing lineage, approvals, documentation, or accountability. | Production AI becomes opaque institutional infrastructure. |
Note: AI infrastructure is the difference between a model that works once and a system that can operate responsibly over time.
Foundations of AI Infrastructure
A production AI system can be represented as a lifecycle pipeline:
Data \rightarrow Features \rightarrow Training \rightarrow Evaluation \rightarrow Deployment \rightarrow Monitoring \rightarrow Feedback
\]
Interpretation: AI infrastructure connects data, features, training, evaluation, deployment, monitoring, and feedback into a continuous operational lifecycle.
This lifecycle differs from traditional software deployment because data and model behavior change over time. Classical software systems are usually defined primarily by code. Machine learning systems depend on code, data, model parameters, feature definitions, training configurations, evaluation data, runtime environments, monitoring assumptions, and deployment context.
A production AI artifact can be represented as:
AI_{prod}=f(Code,Data,Model,Features,Environment,Monitoring,Governance)
\]
Interpretation: A production AI system depends on code, data, model artifacts, features, runtime environments, monitoring, and governance.
This is why AI infrastructure must support more than deployment. It must support experimentation, reproducibility, data validation, model versioning, feature consistency, monitoring, incident response, auditability, and lifecycle control.
| Foundation | Function | AI-Specific Concern | Governance Requirement |
|---|---|---|---|
| Data engineering | Moves and transforms data for training, inference, and monitoring. | Data changes over time and may break model assumptions. | Validation, lineage, ownership, and quality thresholds. |
| Feature management | Defines reusable model inputs for training and serving. | Training and serving must use consistent feature logic. | Feature definitions, versioning, and freshness monitoring. |
| Compute orchestration | Schedules training, fine-tuning, inference, and data-processing workloads. | AI workloads require specialized accelerators and distributed scheduling. | Utilization monitoring, access controls, and cost governance. |
| Model lifecycle management | Tracks model artifacts, versions, metrics, and deployment status. | Models evolve through experiments, releases, and retraining. | Model registry, approval gates, rollback, and retirement criteria. |
| Observability | Provides visibility into system, data, and model behavior. | Model failures may appear as drift, skew, calibration loss, or subgroup degradation. | Telemetry, alerts, incident review, and audit trails. |
| Security | Protects data, models, code, credentials, artifacts, and runtime systems. | AI systems introduce data poisoning, model theft, prompt misuse, and supply-chain risk. | Access control, signed artifacts, secrets management, and monitoring. |
| Governance | Defines review, accountability, documentation, and control mechanisms. | AI systems affect decisions, rights, operations, and public trust. | Use-case inventory, risk classification, lineage, and review evidence. |
Note: AI infrastructure is a layered system. Weakness in one layer can invalidate the behavior of the whole system.
Data Pipelines and Directed Acyclic Graph Systems
Data pipelines are the backbone of AI infrastructure. They ingest, clean, validate, transform, join, label, sample, aggregate, and deliver data for training, evaluation, inference, monitoring, and reporting. In production environments, pipelines are often represented as directed acyclic graphs, where nodes are tasks and edges are dependencies.
A pipeline DAG can be represented as:
G_{pipeline}=(V,E)
\]
Interpretation: A pipeline graph contains task nodes \(V\) and dependency edges \(E\).
A simple AI data pipeline can be written as:
Ingest \rightarrow Validate \rightarrow Transform \rightarrow Featureize \rightarrow Train
\]
Interpretation: Raw data must pass through validation, transformation, and feature creation before model training.
Modern AI pipelines may combine batch pipelines for historical data, streaming pipelines for real-time events, feature pipelines for reusable model inputs, training pipelines for automated training and evaluation, inference pipelines for production-time feature retrieval and model serving, and monitoring pipelines for drift, latency, errors, and performance signals.
Pipeline quality shapes model quality. If upstream data breaks, downstream models fail. If a transformation changes silently, predictions shift. If lineage is missing, teams cannot identify which models were affected by a data defect. AI infrastructure therefore requires pipeline observability and governance, not only pipeline automation.
| Pipeline Type | Primary Function | Failure Mode | Control |
|---|---|---|---|
| Batch pipeline | Processes historical data on a schedule. | Late or failed batch jobs produce stale training data. | Scheduling checks, retries, lineage, and freshness alerts. |
| Streaming pipeline | Processes events, logs, sensor streams, or transactions in real time. | Backpressure, lag, duplication, or dropped events. | Throughput monitoring, exactly-once logic where needed, and lag alerts. |
| Feature pipeline | Creates model-ready variables and feature tables. | Training and serving features diverge. | Feature-store versioning and shared transformation logic. |
| Training pipeline | Trains and evaluates model candidates. | Unvalidated data or untracked experiment settings enter models. | Experiment tracking, validation gates, and reproducibility bundles. |
| Inference pipeline | Retrieves features and serves predictions in production. | Latency, missing features, or inconsistent feature definitions. | Latency budgets, feature freshness checks, and serving telemetry. |
| Monitoring pipeline | Collects drift, usage, quality, latency, and performance signals. | Model degradation remains invisible. | Alerts, dashboards, incident triggers, and review cadence. |
Note: AI pipelines are operational evidence chains. They should be automated, observable, versioned, and governable.
Data Quality, Validation, and Training-Serving Skew
Data validation is a first-order infrastructure requirement. Production AI systems need checks for schema validity, missingness, value ranges, label quality, drift, duplicate records, outliers, leakage, and feature consistency. Validation must occur before training, before deployment, and during live inference.
Training-serving skew occurs when features or distributions used during training differ from those used during serving. This is one of the most important production ML failure modes because a model may perform well offline but fail in deployment.
Training-serving skew can be represented as:
P_{train}(X,Y) \neq P_{serve}(X,Y)
\]
Interpretation: Training-serving skew occurs when the training distribution differs from the serving distribution.
Feature consistency can be represented as:
F_{train}(D)=F_{serve}(D)
\]
Interpretation: Training and serving should use equivalent feature definitions for the same underlying data.
This connects directly to Data Quality, Bias, and Measurement in Machine Learning and Data Governance, Provenance, and Lineage in AI Systems. Data infrastructure is not only about volume. It is about validity, lineage, reproducibility, and fitness for use.
| Validation Control | What It Detects | Why It Matters | Infrastructure Pattern |
|---|---|---|---|
| Schema validation | Unexpected types, fields, formats, or categories. | Pipeline assumptions break when upstream systems change. | Contract testing, schema registry, and blocking gates. |
| Range and distribution checks | Values outside expected limits or shifted distributions. | Models may receive inputs unlike training data. | Statistical validation and drift alerts. |
| Missingness checks | Missing fields, incomplete records, or absent populations. | Missing data can create hidden bias or inference failures. | Completeness thresholds and subgroup missingness reports. |
| Feature consistency checks | Differences between training and serving feature logic. | Offline validation may not match online behavior. | Shared feature definitions and feature-store governance. |
| Leakage checks | Future information or target proxies entering training features. | Validation performance becomes inflated. | Temporal split review and feature provenance. |
| Label-quality checks | Noisy, stale, inconsistent, or biased labels. | The model learns unreliable targets. | Label review, adjudication, and documentation. |
| Drift checks | Changes in inputs, outputs, outcomes, or environment over time. | Production behavior degrades after deployment. | Monitoring pipelines and retraining triggers. |
Note: Data validation is a production control. It should prevent invalid data from silently becoming model behavior.
Compute Systems: CPUs, GPUs, TPUs, and Accelerators
AI infrastructure depends heavily on compute architecture. Traditional applications often rely primarily on CPUs. Modern AI workloads use heterogeneous compute systems that may include CPUs, GPUs, TPUs, specialized accelerators, high-bandwidth memory, distributed interconnects, and large-scale clusters.
Training compute can be approximated as:
C \approx kND
\]
Interpretation: Training compute \(C\) depends approximately on model size \(N\), training data \(D\), and architecture-dependent constant \(k\).
Accelerator utilization matters because AI workloads are expensive. If data pipelines cannot feed accelerators quickly enough, compute sits idle. If communication overhead dominates distributed training, adding more devices produces diminishing returns. If model serving is inefficient, inference cost can overwhelm deployment value.
Hardware infrastructure must therefore be designed around workload type: training, fine-tuning, inference, edge deployment, monitoring, and data processing. Compute is not just a resource. It is a constraint that shapes AI architecture, economics, governance, and environmental impact.
| Compute Layer | Best Fit | Infrastructure Concern | Governance Concern |
|---|---|---|---|
| CPUs | General orchestration, preprocessing, lightweight inference, control logic. | Throughput, parallelism, memory, and data movement. | Cost allocation and workload prioritization. |
| GPUs | Deep learning training, fine-tuning, batch inference, vectorized workloads. | Utilization, memory capacity, interconnects, scheduling. | Access governance, cost, energy, and fair allocation. |
| TPUs and specialized accelerators | Large-scale training and optimized inference workloads. | Compiler support, model compatibility, scaling efficiency. | Vendor dependence and workload lock-in. |
| Edge accelerators | Low-latency inference on devices, gateways, or embedded systems. | Power, thermal limits, memory, update constraints. | Security, physical access, and lifecycle maintenance. |
| Distributed clusters | Large-scale training, serving, simulation, and data processing. | Scheduling, stragglers, network partitions, storage throughput. | Resource governance, observability, and incident readiness. |
| Inference serving pools | Production model serving at scale. | Autoscaling, batching, latency, caching, replica placement. | Release control, rollback, access control, and monitoring. |
Note: Compute architecture should follow workload requirements rather than a generic preference for larger clusters or more accelerators.
Distributed Systems and Parallel Computation
Large-scale AI infrastructure is inherently distributed. Training large models may require parallel computation across many accelerators and nodes. Serving models to many users may require replication, load balancing, autoscaling, caching, and regional deployment. Data processing may require distributed batch and stream processing.
Distributed training commonly uses data parallelism, model parallelism, pipeline parallelism, tensor parallelism, parameter servers, and collective communication. Serving systems commonly use replication, autoscaling, regional routing, request batching, caching, fallback, and circuit breakers.
A simple data-parallel update can be represented as:
g_t=\frac{1}{n}\sum_{i=1}^{n} g_{t,i}
\]
Interpretation: In data-parallel training, the global gradient can be computed as the average of gradients from \(n\) workers.
Distributed system efficiency can be represented as:
Efficiency=\frac{T_1}{nT_n}
\]
Interpretation: Parallel efficiency compares single-worker time \(T_1\) with \(n\)-worker time \(T_n\).
Distributed AI systems face classic distributed-systems problems: synchronization, stragglers, network partitions, failures, scheduling, resource contention, communication overhead, consistency, and observability. Machine learning adds additional complications because the system’s behavior depends on evolving data and learned parameters.
| Pattern | How It Works | Benefit | Failure Mode |
|---|---|---|---|
| Data parallelism | Replicates the model across workers; each worker processes different batches. | Scales training over large datasets. | Communication overhead and stragglers reduce efficiency. |
| Model parallelism | Splits parts of a model across devices. | Supports models too large for one device. | Partitioning complexity and synchronization cost. |
| Pipeline parallelism | Divides model stages across devices sequentially. | Improves utilization for very large models. | Pipeline bubbles and stage imbalance. |
| Tensor parallelism | Splits tensor operations within layers across devices. | Accelerates large matrix operations. | Requires fast interconnects and careful implementation. |
| Autoscaled serving | Adds or removes serving replicas based on demand. | Controls latency and cost under variable traffic. | Cold starts, insufficient scaling, or runaway cost. |
| Regional deployment | Places services near users or infrastructure environments. | Reduces latency and supports resilience. | Version drift, regulatory complexity, and operational overhead. |
Note: Distributed AI infrastructure is powerful only when communication, scheduling, failure handling, and observability are designed deliberately.
Storage, Feature Stores, and Data Management Architectures
AI infrastructure requires scalable storage for structured data, unstructured data, logs, embeddings, documents, images, video, audio, metadata, features, model artifacts, evaluation reports, and monitoring outputs. Storage systems must support high throughput, low latency, versioning, access control, retention policies, and reproducibility.
Key storage components include data lakes, object storage, data warehouses, feature stores, model registries, metadata stores, vector databases, artifact stores, observability stores, and governance archives.
Feature availability can be represented as:
Feature\ Availability = f(Freshness,Consistency,Latency,Completeness)
\]
Interpretation: Useful feature infrastructure depends on freshness, consistency, latency, and completeness.
Feature stores matter because they help prevent training-serving skew. If training and inference use the same feature definitions and governed transformation logic, production reliability improves. Model registries matter because they track what model exists, how it was trained, what data it used, how it was evaluated, where it was deployed, and when it should be reviewed or retired.
| Layer | Purpose | AI Infrastructure Role | Governance Concern |
|---|---|---|---|
| Data lake | Stores raw and processed data at scale. | Supports training, analysis, and historical reconstruction. | Access control, lineage, retention, and data quality. |
| Object storage | Stores files, artifacts, logs, and datasets. | Provides scalable storage for models, outputs, and intermediate data. | Versioning, permissions, encryption, and lifecycle policies. |
| Data warehouse | Stores structured analytical data. | Supports reporting, metrics, feature development, and validation. | Schema governance and analytical reproducibility. |
| Feature store | Manages feature definitions and values for training and serving. | Reduces feature duplication and training-serving skew. | Feature ownership, freshness, definitions, and lineage. |
| Model registry | Stores model artifacts, versions, metadata, and approval status. | Controls deployment eligibility and rollback. | Risk classification, approval gates, and retirement criteria. |
| Metadata store | Records experiments, lineage, validation, and governance metadata. | Makes infrastructure auditable and reproducible. | Completeness, consistency, and access to audit evidence. |
| Vector database | Stores embeddings for semantic retrieval. | Supports retrieval-augmented generation and similarity search. | Source provenance, update control, privacy, and relevance drift. |
Note: Storage architecture is part of model behavior because it controls which data, features, embeddings, and artifacts are available at training and serving time.
Deployment, Serving, and Edge–Cloud Systems
Deployment turns model artifacts into production services. Serving systems expose model predictions through APIs, batch jobs, event streams, embedded devices, applications, decision-support tools, or edge systems. A model-serving system must handle latency, throughput, scaling, versioning, monitoring, fallback, rollback, and security.
A serving request can be represented as:
Request \rightarrow Features \rightarrow Model \rightarrow Prediction \rightarrow Response
\]
Interpretation: Serving converts incoming requests into features, model predictions, and responses.
Serving capacity can be represented as:
Capacity = Replicas \times Throughput_{replica}
\]
Interpretation: Total serving capacity depends on the number of replicas and throughput per replica.
Modern AI deployment spans the edge-cloud continuum. Some inference should happen in centralized cloud environments, especially when models are large, requests are not latency-critical, and centralized governance is appropriate. Other inference should happen at the edge when latency, privacy, bandwidth, resilience, or local control is critical.
This connects directly to Edge AI and Distributed Intelligence and Real-Time AI Systems and Autonomous Decision-Making. Deployment architecture should be chosen based on operational constraints, not fashion.
| Deployment Pattern | How It Works | Best Fit | Operational Risk |
|---|---|---|---|
| Online API serving | Models respond to real-time requests. | Interactive applications, decision support, personalization. | Latency, availability, and security exposure. |
| Batch inference | Predictions are generated in scheduled jobs. | Periodic scoring, reporting, forecasting, offline ranking. | Staleness and job failure. |
| Streaming inference | Models process event streams continuously. | Fraud detection, monitoring, sensor analytics, alerting. | Backpressure, dropped events, and state management. |
| Edge deployment | Models run on devices, gateways, or local infrastructure. | Low-latency, privacy-sensitive, or connectivity-limited environments. | Update management, device security, and resource limits. |
| Shadow deployment | New model runs alongside production without affecting decisions. | Safe comparison before release. | Hidden cost and misleading evaluation if traffic differs. |
| Canary release | New model is gradually exposed to a small share of traffic. | Risk-controlled rollout. | Small samples may miss subgroup failures. |
| Blue-green deployment | Traffic switches between two production environments. | Fast rollback and controlled releases. | Version drift and environment mismatch. |
Note: Deployment strategy should reflect decision risk, latency, rollback needs, monitoring maturity, and the consequences of failure.
MLOps and Lifecycle Orchestration
MLOps extends software operations into the machine-learning lifecycle. It combines pipeline orchestration, experiment tracking, model registry, data validation, testing, deployment automation, monitoring, incident response, governance, and continuous improvement.
An MLOps lifecycle can be represented as:
Develop \rightarrow Test \rightarrow Deploy \rightarrow Monitor \rightarrow Retrain \rightarrow Govern
\]
Interpretation: MLOps connects development, testing, deployment, monitoring, retraining, and governance into a managed lifecycle.
Core MLOps practices include pipeline automation, data and model versioning, experiment tracking, feature management, model registry controls, automated testing and validation, deployment approvals, canary releases, shadow deployments, monitoring for drift and degradation, rollback and incident response, retraining triggers, audit logs, and governance review.
MLOps matters because machine-learning systems decay. Data changes, users change, environments change, policies change, upstream systems change, and adversaries adapt. Operational infrastructure must therefore support continuous learning and continuous control.
| Lifecycle Stage | Infrastructure Practice | Evidence Produced | Why It Matters |
|---|---|---|---|
| Development | Experiment tracking, version control, reproducible environments. | Run records, parameters, metrics, code versions. | Supports comparison and scientific reproducibility. |
| Testing | Data validation, model validation, integration tests, fairness review. | Validation report and risk findings. | Prevents weak models from moving into production. |
| Approval | Model registry gates, risk classification, security review. | Approval history and deployment eligibility. | Makes release decisions accountable. |
| Deployment | Automated release, canary, shadow, rollback, infrastructure-as-code. | Deployment record and environment metadata. | Controls production change safely. |
| Monitoring | Metrics, logs, traces, drift, calibration, performance, latency. | Telemetry and alert history. | Detects degradation and operational failure. |
| Retraining | Trigger rules, updated data, evaluation comparison, release review. | New lineage chain and retraining justification. | Prevents uncontrolled model evolution. |
| Retirement | Decommissioning rules, archival, dependency mapping. | Retirement record and replacement evidence. | Prevents obsolete models from remaining embedded. |
Note: Mature MLOps treats models as living production systems rather than static artifacts.
Monitoring, Observability, and Reliability
Observability provides visibility into system behavior through metrics, logs, and traces. In AI systems, observability must include both software-system telemetry and model-specific telemetry. Traditional metrics such as latency, throughput, error rate, CPU usage, memory, and availability are necessary but not sufficient. AI systems also require monitoring for data drift, prediction drift, calibration, subgroup performance, model confidence, feature availability, label delay, and training-serving skew.
An observability set can be represented as:
O=\{Metrics,Logs,Traces,Model\ Signals,Data\ Signals\}
\]
Interpretation: AI observability combines software telemetry with model and data signals.
Reliability can be represented as:
Reliability=1-P(Failure)
\]
Interpretation: Reliability increases as the probability of failure decreases.
Monitoring should answer several questions: Is the service available? Is latency within budget? Are predictions being produced correctly? Are input features present and fresh? Has the data distribution shifted? Has model performance degraded? Are errors concentrated in specific subgroups or environments? Are users relying on the system appropriately? Is retraining required? Should the system be rolled back, paused, or escalated for review?
AI observability connects model behavior to infrastructure behavior. Both must be monitored together.
| Signal Type | Examples | Failure Detected | Review Response |
|---|---|---|---|
| Service metrics | Latency, throughput, error rate, availability, saturation. | Serving instability or capacity shortfall. | Autoscale, rollback, route traffic, or investigate infrastructure. |
| Data signals | Missingness, freshness, schema changes, distribution shift. | Invalid or shifted inputs. | Pause deployment, trigger validation, or correct upstream data. |
| Feature signals | Feature latency, null rates, value ranges, consistency checks. | Training-serving skew or feature-store failure. | Fix feature logic and review affected predictions. |
| Model signals | Prediction distribution, confidence, calibration, drift, uncertainty. | Model degradation or unexpected behavior. | Recalibrate, retrain, roll back, or escalate. |
| Outcome signals | Delayed labels, ground-truth comparison, subgroup performance. | Performance decline and uneven failure. | Evaluation review and governance action. |
| Governance signals | Approval status, audit log completeness, incident records, access logs. | Control failure or undocumented use. | Compliance review and accountability response. |
Note: AI observability must see both the software system and the learned behavior of the model.
Technical Debt and Production ML Failure Modes
Production AI systems accumulate technical debt when shortcuts in data pipelines, feature definitions, model dependencies, monitoring, documentation, and deployment architecture create future maintenance costs. Machine learning systems can accumulate especially hidden forms of technical debt because behavior depends on data and model interactions, not only code.
A technical-debt relationship can be represented as:
Debt_{ML}=f(Glue\ Code,Data\ Dependencies,Feature\ Entanglement,Feedback\ Loops,Monitoring\ Gaps)
\]
Interpretation: ML technical debt arises from glue code, data dependencies, feature entanglement, hidden feedback loops, and monitoring gaps.
Common failure modes include undocumented data dependencies, training-serving skew, feature entanglement, pipeline fragility, silent data drift, feedback loops, undeclared consumers of model outputs, weak reproducibility, poor rollback mechanisms, insufficient monitoring, inconsistent governance ownership, and model updates that change downstream behavior unexpectedly.
Technical debt is not merely an engineering inconvenience. In high-impact AI systems, debt becomes governance risk.
| Failure Mode | How It Appears | System Risk | Mitigation |
|---|---|---|---|
| Glue code | Fragile scripts connect data, features, training, and deployment. | Small changes break the pipeline unpredictably. | Reusable pipeline components and tested interfaces. |
| Hidden data dependencies | Models depend on upstream fields or systems no one tracks. | Upstream changes silently alter model behavior. | Lineage, data contracts, and dependency inventories. |
| Feature entanglement | Features interact in ways that are hard to isolate. | Local fixes produce unexpected system effects. | Feature documentation and controlled change testing. |
| Feedback loops | Model outputs influence future training data. | The system reinforces its own prior decisions. | Feedback monitoring and causal review. |
| Monitoring gaps | System lacks model, data, or subgroup telemetry. | Failure remains invisible until users experience harm. | Model observability and governance alerts. |
| Weak rollback | No tested path to revert model, data, or feature changes. | Defective releases persist in production. | Versioned artifacts, release gates, and rollback drills. |
| Undeclared consumers | Other systems quietly depend on model outputs. | Model changes cause downstream failures. | Consumer registry and impact analysis. |
Note: In production AI, technical debt often hides in data, features, feedback loops, and governance gaps rather than in code alone.
Security, Access Control, and Supply-Chain Risk
AI infrastructure introduces security risks across data, code, models, pipelines, dependencies, deployment environments, and vendors. A compromised dataset can poison training. A compromised dependency can affect model serving. A leaked model can expose intellectual property or enable misuse. A weak access-control regime can expose sensitive data or prediction logs.
A security condition can be represented as:
Access(u,r)=Allowed \iff Role(u)\in Permissions(r)
\]
Interpretation: User \(u\) may access resource \(r\) only if the user’s role satisfies the resource’s permission policy.
AI infrastructure security should include role-based access control, secrets management, network segmentation, data encryption, signed model artifacts, container image scanning, dependency scanning, secure model registry controls, audit logging, runtime anomaly detection, incident response, and supply-chain review.
Security must extend across the full AI lifecycle because each artifact is part of the production system.
| Risk | Where It Appears | Potential Harm | Control |
|---|---|---|---|
| Data poisoning | Training data, feedback data, or external sources. | Model learns corrupted or adversarial patterns. | Data validation, provenance, anomaly detection. |
| Model artifact compromise | Model registry, artifact store, deployment package. | Malicious or unapproved model enters production. | Signed artifacts, registry controls, approval gates. |
| Dependency compromise | Packages, containers, build systems, libraries. | Supply-chain attack reaches training or serving systems. | Dependency scanning, pinned versions, image signing. |
| Credential leakage | Notebooks, pipelines, CI/CD, environment variables. | Unauthorized access to data, compute, models, or APIs. | Secrets management and least-privilege access. |
| Inference abuse | Public or internal serving endpoints. | Model extraction, prompt attacks, data leakage, denial of service. | Rate limits, monitoring, authentication, filtering, and abuse detection. |
| Access-control failure | Data lakes, feature stores, model registries, logs. | Sensitive data or model outputs are exposed. | RBAC, encryption, audit logs, and periodic review. |
| Runtime compromise | Containers, clusters, edge devices, serving hosts. | Prediction behavior, telemetry, or data flows are altered. | Runtime monitoring, patching, segmentation, and incident response. |
Note: AI security must protect the entire artifact chain: data, features, code, models, infrastructure, outputs, and logs.
Governance, Provenance, and Auditability
AI infrastructure must be governable. Governance requires visibility into what data was used, which code transformed it, which model was trained, which evaluation approved it, which deployment served it, which users accessed it, and which monitoring signals triggered review.
A provenance chain can be represented as:
Dataset \rightarrow Features \rightarrow Model \rightarrow Deployment \rightarrow Predictions
\]
Interpretation: Provenance connects data, features, models, deployments, and predictions into an auditable chain.
Current production guidance reinforces lifecycle control rather than model-only management. Kubernetes documents horizontal autoscaling as an intermittent control loop with configurable metrics and stabilization behavior, while vertical autoscaling adjusts workload resource requests and limits. OpenTelemetry provides vendor-neutral traces, metrics, logs, and contextual correlation. SLSA 1.2 is the approved current specification for incrementally improving software-artifact supply-chain security, and NIST reports that AI RMF 1.0 is being revised.
A governance review function can be represented as:
Review=f(Data,Model,Metrics,Risk,Security,Use)
\]
Interpretation: Responsible infrastructure review evaluates data, model artifacts, metrics, risk, security, and intended use.
Governance mechanisms include use-case inventories, model registries, dataset documentation, lineage tracking, approval workflows, risk classification, human oversight design, deployment gates, audit logs, incident reports, retirement criteria, and periodic review.
This connects directly to Data Governance, Provenance, and Lineage in AI Systems and AI Governance and Regulatory Systems. Infrastructure is the layer where governance becomes operational rather than aspirational.
| Evidence Artifact | What It Records | Why It Matters | Review Use |
|---|---|---|---|
| Dataset documentation | Source, scope, collection, limitations, rights, and quality. | Clarifies what data can support. | Data fitness and rights review. |
| Lineage graph | Dependencies from data to features, models, deployments, and outputs. | Supports reproducibility and impact analysis. | Incident tracing and audit. |
| Experiment record | Parameters, metrics, data versions, code versions, environment. | Preserves model-development evidence. | Model comparison and reproducibility. |
| Model card or registry entry | Intended use, evaluation results, limitations, approval status. | Controls production eligibility. | Release review and risk classification. |
| Deployment record | Model version, environment, release time, traffic exposure, rollback path. | Connects production behavior to approved artifacts. | Change control and incident review. |
| Monitoring report | Performance, drift, latency, error rates, subgroup signals, incidents. | Shows whether the system remains valid over time. | Retraining, rollback, escalation, or retirement. |
| Access log | Who accessed data, models, logs, or deployment controls. | Supports security and accountability. | Audit, investigation, and least-privilege review. |
Note: Infrastructure should produce governance evidence automatically as part of normal operation.
Integration with Decision, Infrastructure, and Governance Systems
AI infrastructure is not isolated. It integrates with decision systems, business workflows, public institutions, cyber-physical infrastructure, analytics platforms, security systems, and governance processes.
A full-stack AI system can be represented as:
Data \rightarrow Model \rightarrow Decision \rightarrow Outcome \rightarrow Monitoring \rightarrow Governance
\]
Interpretation: Production AI links data, models, decisions, outcomes, monitoring, and governance in a feedback loop.
This integration makes AI infrastructure sociotechnical. A model-serving endpoint may appear technical, but its outputs may influence hiring, lending, healthcare, transportation, security, environmental monitoring, public services, infrastructure control, or organizational strategy. The infrastructure must therefore support not only uptime and throughput, but also accountability, traceability, contestability, and risk review.
| Connection | Infrastructure Role | System-Level Concern | Governance Response |
|---|---|---|---|
| Decision-support systems | Serves predictions, scores, summaries, or recommendations. | Model outputs shape human and organizational judgment. | Decision logs, human oversight, and appeal pathways. |
| Organizational workflows | Embeds models into queues, approvals, routing, and operations. | AI changes authority, attention, and accountability. | Workflow review and role responsibility mapping. |
| Cyber-physical infrastructure | Connects sensing, inference, control, and monitoring. | Failures can affect physical safety and public services. | Runtime assurance, fail-safe behavior, and incident response. |
| Data governance systems | Records lineage, quality, permissions, and provenance. | Data defects can propagate into models and decisions. | Automated lineage and quality gates. |
| Security systems | Protects data, models, pipelines, identities, and runtime environments. | Attackers can compromise AI behavior or expose sensitive data. | Security monitoring, access control, and supply-chain review. |
| Regulatory and audit systems | Produces evidence for review, compliance, and accountability. | High-impact systems require traceable justification. | Audit logs, documentation, approval records, and monitoring reports. |
Note: Production AI infrastructure should be designed as accountable infrastructure, not merely as scalable computation.
Limits and System-Level Challenges
AI infrastructure faces persistent challenges: high compute and storage cost, accelerator scarcity and scheduling complexity, large data movement and bandwidth constraints, pipeline brittleness, data quality failures, training-serving skew, model drift, distributed-system failure modes, security and supply-chain risk, weak observability, energy and cooling constraints, incomplete governance and auditability, organizational skill gaps, and technical debt accumulation.
A deployment constraint can be represented as:
Deployment \leq \min(Data,Compute,Storage,Serving,Reliability,Governance)
\]
Interpretation: AI deployment is constrained by the weakest infrastructure and governance layer.
The central lesson is that production AI succeeds or fails as a system. The model may be the most visible component, but infrastructure determines whether it can be trusted in operation.
| Challenge | Why It Matters | Risk | Response |
|---|---|---|---|
| Compute scarcity | Advanced workloads depend on expensive accelerators and scheduling capacity. | Training, fine-tuning, or serving becomes bottlenecked. | Workload prioritization, utilization monitoring, and efficient models. |
| Data movement | Large datasets, embeddings, logs, and model artifacts must move across systems. | Bandwidth, latency, and cost overwhelm pipelines. | Data locality, caching, compression, and pipeline design. |
| Pipeline brittleness | AI depends on many upstream systems and transformations. | Small upstream changes break downstream behavior. | Data contracts, validation gates, and lineage. |
| Observability gaps | Teams may see infrastructure metrics but not model behavior. | Drift, bias, or degradation remains hidden. | Model-specific monitoring and outcome review. |
| Energy and cooling | AI compute has physical, economic, and environmental costs. | Infrastructure growth exceeds resource capacity or sustainability goals. | Efficiency, workload governance, and energy-aware design. |
| Security complexity | AI adds artifacts, endpoints, data flows, and dependencies. | Expanded attack surface and supply-chain exposure. | Secure-by-design pipelines, signed artifacts, and access controls. |
| Governance lag | Infrastructure can scale faster than review capacity. | AI systems become embedded before risks are understood. | Governance gates, use-case inventories, and periodic review. |
Note: Production AI is constrained by its weakest operational layer. Infrastructure readiness must be evaluated as a whole system.
Workload Classification and Production Service Contracts
Infrastructure design begins with the workload and the decision it supports. Batch training, online prediction, streaming detection, retrieval-augmented generation, scheduled scoring, simulation, and edge inference place different demands on latency, throughput, consistency, availability, privacy, energy, and recovery.
A production service contract should define request and data characteristics, service-level objectives, peak and sustained load, model and feature versions, acceptable staleness, failure behavior, rollback time, geographic requirements, data rights, human escalation, and the consequence of an incorrect or unavailable result.
Contract = \{Load,Latency,Availability,Freshness,Consistency,Recovery,Governance\}
\]
Interpretation: An AI workload becomes governable when its operating expectations and failure limits are explicit.
Workload classes should not be assigned only by model size. A small model controlling infrastructure can require stronger safeguards than a large model generating optional content. A high-throughput batch process may tolerate hours of latency while a low-volume emergency system cannot tolerate seconds.
Contracts should identify which requirements are hard release gates and which are optimization targets. Safety, lawful use, data integrity, and rollback readiness should not be traded away to improve average utilization.
Service-Level Indicators, Objectives, and Error Budgets
Service-level indicators measure user- or system-visible behavior such as availability, successful request rate, tail latency, freshness, feature completeness, prediction validity, and recovery time. Service-level objectives define acceptable targets over a stated window. Error budgets quantify how much unreliability the service can consume before change must slow or stop.
ErrorBudget = 1-SLO_{availability}
\]
Interpretation: A 99.9 percent availability objective permits 0.1 percent unavailability within the measurement window, subject to the stated definitions and exclusions.
AI services need model-aware indicators beside conventional uptime. A server can return HTTP 200 while features are stale, retrieval is empty, calibration has degraded, or a fallback model is being used outside its approved scope. “Successful” must therefore include semantic validity where it can be measured.
Error-budget policy should connect reliability to release behavior. When a service consumes its budget rapidly, the organization can freeze nonessential changes, reduce traffic, restore a known version, or increase review. Error budgets are not permission to spend harm; consequential systems still require safety constraints and incident thresholds.
Capacity Planning, Queueing, and Demand Uncertainty
Capacity planning connects arrival rate, service time, concurrency, replicas, memory, accelerator availability, data throughput, and burst behavior. Average load is inadequate because queues grow nonlinearly as utilization approaches saturation.
\rho=\frac{\lambda}{c\mu}
\]
Interpretation: Utilization \(\rho\) is the arrival rate \(\lambda\) divided by total service capacity from \(c\) replicas with per-replica service rate \(\mu\).
Capacity models should include warm-up, model loading, cache state, batching, token length, feature lookup, network transfer, retries, and dependency latency. A nominal GPU throughput test does not represent end-to-end serving capacity when retrieval, preprocessing, or postprocessing dominates.
Demand uncertainty should be tested with bursts, regional failures, scheduled jobs, adversarial traffic, and event-driven surges. Capacity reserves should be justified by consequence and recovery time. Excessive idle capacity wastes cost and energy, but insufficient headroom can create cascading timeouts and unsafe fallback behavior.
Tail Latency, Backpressure, and Overload Control
Users and downstream systems experience the tail of the latency distribution, not only the mean. A small number of slow requests can exhaust thread pools, hold accelerator memory, create retry storms, and propagate delay across services.
Tail-latency control includes deadlines, timeouts, bounded queues, admission control, concurrency limits, load shedding, circuit breakers, request prioritization, retry budgets, and fallback behavior. Retries must be designed carefully because automatic retries can multiply load during an outage.
TailPressure=\frac{P_{99}\ latency}{Latency\ SLO}
\]
Interpretation: Tail pressure exceeds one when the 99th-percentile latency is above the service objective.
Backpressure communicates downstream saturation to upstream producers. Dropping, delaying, or degrading work can be safer than accepting unbounded queues. The policy should distinguish critical, deferrable, and optional requests.
Fallbacks require validation. A smaller model, cached response, stale feature, or human queue may change accuracy, rights, and service quality. Infrastructure should record which fallback served each result.
Autoscaling, Control-Loop Stability, and Cold Starts
Autoscaling is a feedback-control problem. Horizontal scaling adjusts replica counts, while vertical scaling adjusts resource requests and limits. Model-serving systems can scale on concurrency, queue depth, token throughput, cache pressure, or request backlog rather than relying only on generic CPU utilization.
A useful scaling signal should be timely, causal, bounded, and connected to capacity. CPU utilization can be misleading for GPU inference. Queue length can respond too late when startup and model-loading times are long. Concurrent requests can ignore variation in input or output tokens.
Stabilization windows, hysteresis, minimum replicas, prewarming, predictive capacity, and controlled scale-down reduce flapping. Cold-start analysis should include image pull, scheduling, accelerator allocation, model download, deserialization, graph compilation, cache warm-up, and readiness checks.
Autoscaling does not remove the need for capacity limits and admission control. A system cannot scale beyond available accelerators, quotas, network, storage, power, or budget. When scaling is constrained, overload policy should activate before queues become unbounded.
Accelerator Memory, Interconnects, and Effective Utilization
Accelerator utilization is multidimensional. A device can report high compute activity while delivering poor useful throughput because memory, communication, preprocessing, synchronization, or padding dominates. Effective utilization should connect hardware activity to completed, valid work.
Training and serving depend on device memory capacity, memory bandwidth, host-to-device transfer, collective communication, topology, precision, activation storage, optimizer state, key-value cache, and fragmentation. Out-of-memory risk can appear only at long sequence lengths or unusual batches.
EffectiveUtilization=\frac{Useful\ model\ work}{Allocated\ accelerator\ time}
\]
Interpretation: Useful utilization discounts idle allocation, failed work, excessive padding, communication stalls, and invalid outputs.
Profiling should separate data loading, kernel execution, communication, synchronization, and idle time. Scheduling should consider topology and memory, not only the number of accelerators. Fractional allocation and multi-tenancy can improve utilization while increasing isolation and interference risk.
Accelerator efficiency is an operational and environmental concern because scarce hardware, energy, cooling, and capital are consumed whether or not useful work is produced.
Distributed Training, Checkpointing, and Fault Tolerance
Distributed training couples computation, communication, storage, and orchestration. Data parallelism, tensor parallelism, pipeline parallelism, expert parallelism, and sharded state each create different failure and recovery boundaries.
Checkpoint design should specify model, optimizer, scheduler, random state, data position, tokenizer, configuration, code, environment, topology assumptions, and integrity metadata. A checkpoint that reloads but does not reproduce training state can silently change the experiment.
Checkpoint interval balances recomputation against storage and synchronization overhead. Large checkpoints can overload object storage or stall workers. Incremental, asynchronous, and sharded approaches can reduce cost but complicate restoration.
Elastic training can continue after worker changes, but statistical and reproducibility effects should be evaluated. Stragglers, preemptions, network faults, corrupt checkpoints, and partial writes require tested recovery. Recovery drills should demonstrate that the team can resume from an approved state within the required time rather than merely confirming that checkpoint files exist.
Storage, Data Locality, and Movement Cost
AI systems move large volumes of training data, features, embeddings, checkpoints, logs, and model weights. Data movement can dominate runtime, cost, and energy even when compute appears to be the main resource.
Storage architecture should distinguish authoritative data, analytical copies, training snapshots, feature values, model artifacts, caches, vector indexes, and observability data. Each requires consistency, durability, access, retention, throughput, and recovery policies.
Time_{pipeline}\geq \max(Time_{compute},Time_{I/O},Time_{network})
\]
Interpretation: Pipeline time cannot be lower than its dominant compute, storage, or network bottleneck.
Locality-aware scheduling can reduce transfer and improve throughput, but replicas and caches create invalidation and governance challenges. Compression, columnar formats, partitioning, prefetching, caching, and tiered storage should be evaluated using end-to-end workload traces.
Storage cost includes read and egress charges, small-object overhead, replication, retention, backups, and abandoned artifacts. Lifecycle policies should not delete evidence required for reproducibility, rollback, audit, or incident review.
Feature, Vector, and Retrieval Serving Consistency
Production predictions increasingly depend on online feature stores, vector indexes, retrieval systems, prompt templates, and external tools. Consistency requires more than using the same column names during training and serving.
Feature governance should track definitions, windows, event time, processing time, freshness, null behavior, leakage constraints, backfills, ownership, and version. Point-in-time correctness is essential when historical training examples must use only information available at the prediction time.
Retrieval systems should record source version, chunking, embedding model, index build, filters, ranking, freshness, access policy, and retrieved context. A model can remain unchanged while output quality degrades because the index is stale or authorization filters fail.
Training-serving and evaluation-serving consistency should be tested with replay. The same request and governed snapshot should produce equivalent features and retrieval context within declared tolerances. Cache hits, fallbacks, and external calls should remain visible in traces.
Progressive Delivery, Release Evidence, and Rollback
Model release should be a controlled experiment with bounded exposure. Shadow, canary, blue-green, champion–challenger, and regional rollout patterns allow comparison before full deployment. Each pattern needs success criteria, stop conditions, traffic allocation, subgroup checks, and rollback authority.
Offline evaluation, load testing, security review, data validation, model-card approval, and infrastructure readiness should be linked to the exact artifact digest. A release gate that references a mutable model name does not prove which version was approved.
Rollback should cover model, feature, prompt, data contract, runtime image, configuration, and policy. Returning to an earlier model while serving incompatible features can worsen failure. Roll-forward may be safer when irreversible schema or data changes have occurred.
Release evidence should include baseline comparison, tail latency, error budget, calibration or task quality, subgroup behavior, cost, energy, fallback use, and incident signals. A canary that lacks representative traffic can produce false reassurance.
Multi-Region Resilience, Disaster Recovery, and State
Regional redundancy can improve availability, latency, and disaster recovery, but it also introduces consistency, replication, privacy, cost, and operational complexity. Stateless model serving is easier to fail over than systems with session memory, online learning, feature state, vector indexes, or workflow queues.
Recovery objectives should distinguish recovery time, recovery point, data consistency, model version, and decision continuity. A service can restart quickly while using stale features, incomplete indexes, or unapproved model versions.
Disaster recovery should test loss of a region, control plane, artifact store, feature store, identity provider, network route, and external model API. Dependencies shared across regions can create hidden common-mode failure.
Active-active systems need conflict and routing policies. Active-passive systems need reliable promotion and current replicas. Data residency and sovereignty requirements can restrict failover destinations. Exercises should verify not only infrastructure restoration but also governance records, monitoring, and rollback capability.
End-to-End Observability with OpenTelemetry
OpenTelemetry provides vendor-neutral instrumentation and collection for traces, metrics, logs, and contextual correlation. These signals can connect application, pipeline, model-serving, retrieval, and infrastructure behavior when shared context propagates across services.
Distributed traces should capture request flow, feature lookup, retrieval, model invocation, tool calls, queueing, fallback, and response. Metrics summarize rates, errors, duration, saturation, model behavior, and resource use. Logs preserve discrete events and diagnostics. Correlation identifiers allow investigators to move among signals.
Observability design must manage cardinality, sampling, privacy, and cost. Recording user identifiers, prompts, features, or retrieved content can expose sensitive data. Excessively sampled traces can miss rare failures, while unsampled telemetry can overwhelm storage.
Telemetry should support action. Dashboards without owners, thresholds, runbooks, or escalation are display systems rather than operational controls. Model and data signals should be correlated with conventional service signals to distinguish infrastructure failure from model or evidence failure.
Incident Response, Runtime Assurance, and Safe Degradation
AI incidents can originate in data, features, models, prompts, retrieval, dependencies, credentials, infrastructure, policy, or human workflow. Incident response should identify the active version, affected requests and decisions, blast radius, containment options, accountable owner, and evidence required for correction.
Runtime assurance can place monitored safety rules, input validation, output constraints, policy checks, rate limits, and human review around a model. These controls should be independent enough to detect failures that the model cannot recognize itself.
Safe degradation defines how service changes under stress. Options include reducing optional features, using a validated smaller model, serving cached results within freshness limits, routing to humans, delaying low-priority work, or stopping automation. Each mode needs an approved scope and visible status.
Post-incident review should connect technical cause to organizational conditions: missing ownership, weak load testing, absent rollback, ignored alerts, incentive pressure, or incomplete governance. Corrective action should include verification and a due date rather than a general recommendation.
Software, Model, and Data Supply-Chain Security
AI infrastructure depends on packages, containers, build systems, base images, drivers, model weights, datasets, APIs, plugins, and external services. Supply-chain security should establish what entered the system, who produced it, how it was built, what review occurred, and whether the artifact changed.
SLSA version 1.2 provides approved, incrementally adoptable guidance for improving software-artifact supply-chain security. Provenance, isolated builds, dependency management, signed artifacts, and verification can reduce tampering and substitution risk. Software bills of materials should connect to model, data, and runtime lineage rather than standing alone.
Model artifacts can execute code or include unsafe serialization. Loading should occur in controlled environments with format restrictions, signature checks, scanning, and least privilege. External models need license, source, safety, and update review.
Data supply chains require source, collection, quality, consent, rights, and poisoning controls. A secure build cannot make an unauthorized or manipulated dataset trustworthy.
Multi-Tenancy, Isolation, Secrets, and Access Boundaries
Shared clusters, accelerators, feature stores, registries, observability systems, and vector databases can improve utilization while increasing confidentiality, integrity, and availability risks. Isolation should address identity, network, storage, compute, namespace, process, model, cache, and telemetry boundaries.
Least-privilege identities should be issued to workloads rather than embedded as long-lived credentials. Secret managers, short-lived tokens, workload identity, rotation, and audit reduce exposure. Notebooks and experiment environments require special controls because interactive access can bypass production boundaries.
GPU and accelerator sharing may expose side channels, memory residue, noisy-neighbor effects, or denial of service. Sensitive workloads may require dedicated devices or stronger isolation. Multi-tenant batching can also mix requests with different privacy or latency requirements.
Access review should include who can deploy, change traffic, read prompts or features, download weights, alter monitoring, approve models, and disable controls. Separation of duties can prevent one compromised identity from creating and approving an unsafe release.
Cost, Energy, Water, and Resource Governance
AI infrastructure consumes capital, accelerator time, storage, network bandwidth, energy, cooling, and operational labor. Unit-cost metrics should connect consumption to useful service, not only total cloud spend.
UnitCost=\frac{Compute+Storage+Network+Operations}{Valid\ service\ units}
\]
Interpretation: Unit cost should divide lifecycle resource consumption by valid completed work such as trained examples, evaluated experiments, or successful governed requests.
FinOps controls include tagging, budgets, quotas, idle-resource detection, rightsizing, reserved capacity, workload scheduling, storage lifecycle, egress review, and showback. Cost reduction should not remove reliability headroom or evidence retention without review.
Environmental assessment should distinguish operational electricity, carbon intensity, cooling, water, hardware utilization, embodied equipment, and avoided work. Carbon-aware scheduling can shift flexible workloads toward lower-carbon periods or regions when data rights, latency, and reliability permit.
Efficiency improvements can create rebound if cheaper inference increases total demand. Absolute consumption, service value, and distribution of benefits should therefore accompany per-request efficiency.
Platform Engineering, Golden Paths, and Organizational Capability
AI platforms should make the safe and observable path easier than unmanaged custom infrastructure. Golden paths can provide approved templates for data ingestion, experiment tracking, feature definitions, model packaging, deployment, telemetry, rollback, security, and governance evidence.
A platform should not force every workload into one architecture. Batch research, real-time inference, regulated decision support, edge systems, and foundation-model services need different controls. The platform can standardize interfaces and evidence while allowing justified variation.
Self-service requires boundaries: quotas, policy checks, environment separation, approved dependencies, model-registry gates, cost visibility, and escalation. Platform teams should measure developer lead time, reliability, reproducibility, control coverage, incident burden, and user outcomes rather than adoption alone.
Organizational capability includes ownership, on-call readiness, data stewardship, security, domain review, governance, procurement, and executive authority to pause unsafe systems. Infrastructure maturity cannot be purchased as software when responsibility and response capacity are absent.
Worked Diagnostic: An Overloaded Retrieval-Augmented AI Service
Consider a public-facing research assistant using an API gateway, retrieval service, vector index, feature and policy checks, a GPU-hosted language model, citations, and human escalation. Traffic rises sharply after a public event, and users report slow, incomplete, and occasionally uncited answers.
Step 1: Reconstruct the service contract
The team confirms latency, availability, citation, freshness, privacy, cost, fallback, and human-review requirements for the affected use case.
Step 2: Trace the critical request path
Distributed traces separate gateway, retrieval, authorization, reranking, model queue, generation, citation assembly, and response time.
Step 3: Diagnose demand and saturation
Arrival rate, token distribution, concurrency, queue depth, GPU memory, cache pressure, retrieval latency, and dependency errors are compared with tested capacity.
Step 4: Check evidence and serving consistency
The active model, prompt, index, embedding model, filters, source versions, cache state, and feature definitions are verified against the approved release.
Step 5: Evaluate autoscaling and cold starts
The team checks whether scaling metrics lead demand, whether accelerator capacity exists, and whether model loading and readiness delay useful replicas.
Step 6: Apply bounded overload controls
Optional work is reduced, low-priority requests are queued, retry budgets are enforced, and uncited or unauthorized fallbacks are blocked.
Step 7: Roll back or progress a repaired release
A known model-and-index bundle is restored or a corrected version is canaried with representative traffic and explicit stop conditions.
Step 8: Validate recovery and institutional learning
Error budget, tail latency, citation coverage, freshness, cost, incidents, and affected user sessions are reviewed before closure and capacity policy is revised.
| Response pattern | Immediate effect | Systems limitation |
|---|---|---|
| Add replicas only | May increase nominal model capacity. | Does not repair retrieval, authorization, cold starts, queue policy, or unavailable accelerators. |
| Increase timeout and retries | Some requests complete eventually. | Can deepen queueing, multiply load, and hide an unavailable service. |
| End-to-end production response | Coordinates tracing, capacity, evidence consistency, overload control, release safety, and user correction. | Requires tested telemetry, rollback, ownership, and authority to degrade or stop service. |
The diagnostic demonstrates that production failure is rarely explained by the model server alone. Data, retrieval, policy, queues, accelerators, releases, and organizational response form one service system.
Mathematical Lens
A pipeline graph can be written as:
G_{pipeline}=(V,E)
\]
Interpretation: AI pipelines can be modeled as task nodes \(V\) connected by dependency edges \(E\).
A production AI system can be represented as:
AI_{prod}=f(Code,Data,Model,Features,Environment,Monitoring,Governance)
\]
Interpretation: Production AI depends on code, data, model artifacts, features, runtime environment, monitoring, and governance.
Training compute can be approximated as:
C \approx kND
\]
Interpretation: Compute demand depends on model size, training data, and architecture-specific constants.
Data-parallel gradient aggregation is:
g_t=\frac{1}{n}\sum_{i=1}^{n} g_{t,i}
\]
Interpretation: The global gradient is computed from worker-level gradients across distributed training nodes.
Parallel efficiency is:
Efficiency=\frac{T_1}{nT_n}
\]
Interpretation: Parallel efficiency measures how effectively additional workers reduce runtime.
Serving capacity can be represented as:
Capacity = Replicas \times Throughput_{replica}
\]
Interpretation: Total inference capacity depends on the number of serving replicas and throughput per replica.
Training-serving skew can be written as:
P_{train}(X,Y) \neq P_{serve}(X,Y)
\]
Interpretation: Production risk increases when training and serving distributions differ.
Reliability is:
Reliability=1-P(Failure)
\]
Interpretation: Reliability is the complement of system failure probability.
Infrastructure readiness can be represented as:
Readiness=f(Data,Compute,Storage,Serving,Observability,Security,Governance)
\]
Interpretation: AI infrastructure readiness depends on data, compute, storage, serving, observability, security, and governance.
This mathematical lens shows that AI infrastructure can be analyzed through pipeline graphs, compute scaling, parallel efficiency, serving capacity, distribution shift, reliability, and readiness.
Variables and System Interpretation
| Symbol or Term | Meaning | Typical Type | System Interpretation |
|---|---|---|---|
| \(G_{pipeline}\) | Pipeline graph | DAG or workflow graph. | Tasks and dependencies in an AI pipeline. |
| \(V\) | Task nodes | Pipeline components. | Ingestion, validation, transformation, training, evaluation, serving, or monitoring tasks. |
| \(E\) | Dependency edges | Directed links. | Ordering and dependency relationships among pipeline tasks. |
| \(C\) | Compute demand | Resource quantity. | Compute required for training or inference. |
| \(N\) | Model size | Parameter count or model scale. | Scale of the learned model or architecture. |
| \(D\) | Training data | Samples, tokens, or records. | Data volume used for model training. |
| \(g_{t,i}\) | Worker gradient | Vector. | Gradient computed by worker \(i\) at training step \(t\). |
| \(T_1\) | Single-worker runtime | Time. | Runtime using one worker or device. |
| \(T_n\) | Runtime with \(n\) workers | Time. | Runtime using distributed compute across \(n\) workers. |
| \(P_{serve}\) | Serving distribution | Probability distribution. | Data distribution observed during production inference. |
| \(O\) | Observability set | Telemetry layer. | Metrics, logs, traces, model signals, and data signals used to understand runtime behavior. |
| \(Readiness\) | Infrastructure readiness | Composite system score. | Production preparedness across data, compute, storage, serving, observability, security, and governance. |
| Observability | System visibility | Telemetry layer. | Metrics, logs, traces, model signals, and data signals used to understand runtime behavior. |
| MLOps | Machine-learning operations | Lifecycle discipline. | Practices for deploying, monitoring, governing, and improving ML systems in production. |
Note: AI infrastructure should be evaluated through system behavior, not model performance alone. Production readiness depends on pipelines, compute, storage, deployment, monitoring, security, and governance.
Supporting Example: Serving Capacity and Latency Budget
Assume a service receives 420 requests per second. Each warmed replica can sustain 75 valid requests per second under the tested input distribution. Eight replicas provide nominal capacity of 600 requests per second and utilization of 0.70.
\rho=\frac{420}{8\times 75}=0.70
\]
Interpretation: Thirty percent nominal headroom remains before accounting for bursts, failures, cold starts, dependency delay, and input-length variation.
| Condition | Interpretation | Required test |
|---|---|---|
| Average utilization 0.70 | Nominal headroom exists. | Verify P95/P99 latency and burst behavior. |
| One replica unavailable | Utilization rises to 0.80. | Test failover and autoscaling lag. |
| Per-request work doubles | Effective capacity can fall by half. | Load-test realistic token or feature distributions. |
| Retrieval adds 300 ms | End-to-end SLO can fail despite model capacity. | Trace the complete request path. |
Computational Modeling
Computational modeling can make AI infrastructure concrete. A pipeline model can represent tasks, dependencies, and failure propagation. A compute model can estimate accelerator utilization and parallel efficiency. A serving model can estimate capacity, latency, and replica requirements. A reliability model can score observability, rollback, monitoring, and incident readiness. A governance model can track data lineage, model registry status, approval gates, access controls, and audit evidence.
The selected examples below use lightweight synthetic workflows so the article remains readable and WordPress-friendly. The GitHub repository extends the same logic into advanced notebooks, pipeline DAG simulation, compute-utilization analysis, serving-capacity planning, reliability diagnostics, observability metadata, SQL schemas, governance checklists, and reproducible outputs.
Infrastructure\ Review = Pipeline + Compute + Serving + Observability + Security + Governance
\]
Interpretation: Production AI infrastructure review should evaluate pipeline health, compute capacity, serving behavior, observability, security, and governance together.
Python Workflow: AI Pipeline, Compute, Serving, and Reliability Diagnostics
Python is useful for modeling AI infrastructure as a system of tasks, resources, dependencies, and service-level constraints.
from __future__ import annotations

import csv
from collections import defaultdict
from pathlib import Path
from statistics import mean

ROOT = Path(__file__).resolve().parents[1]
DATA_FILE = ROOT / "data" / "ai_infrastructure_profiles.csv"
TABLES = ROOT / "outputs" / "tables"

CONTROL_COLUMNS = [
    "data_freshness",
    "feature_consistency",
    "observability_coverage",
    "rollback_readiness",
    "supply_chain_integrity",
    "security_isolation",
    "governance_evidence",
    "energy_efficiency",
]

def clamp(value: float, low: float = 0.0, high: float = 1.0) -> float:
    return max(low, min(high, value))

def load_profiles(path: Path = DATA_FILE) -> list[dict[str, object]]:
    with path.open(newline="", encoding="utf-8") as handle:
        rows = list(csv.DictReader(handle))
    numeric = [
        "arrival_rate_rps", "service_rate_per_replica", "replicas",
        "p50_latency_ms", "p95_latency_ms", "p99_latency_ms",
        "latency_slo_ms", "availability", "availability_slo",
        "error_rate", "max_error_rate", "queue_pressure",
        "autoscaling_lag", "accelerator_utilization", "memory_headroom",
        "cost_per_1000_valid_requests", "consequence", *CONTROL_COLUMNS,
    ]
    for row in rows:
        for column in numeric:
            row[column] = float(row[column])
    return rows

def score_service(row: dict[str, object]) -> dict[str, object]:
    capacity = float(row["service_rate_per_replica"]) * float(row["replicas"])
    utilization = float(row["arrival_rate_rps"]) / capacity if capacity > 0 else 1.0
    headroom = clamp(1.0 - utilization)
    tail_pressure = float(row["p99_latency_ms"]) / max(float(row["latency_slo_ms"]), 1.0)
    allowed_unavailability = max(1.0 - float(row["availability_slo"]), 1e-9)
    availability_budget = max(1.0 - float(row["availability"]), 0.0) / allowed_unavailability
    error_budget = float(row["error_rate"]) / max(float(row["max_error_rate"]), 1e-9)
    control_strength = mean(float(row[c]) for c in CONTROL_COLUMNS)

    saturation_risk = clamp(
        0.45 * clamp((utilization - 0.62) / 0.38)
        + 0.25 * float(row["queue_pressure"])
        + 0.15 * float(row["autoscaling_lag"])
        + 0.15 * (1.0 - float(row["memory_headroom"]))
    )
    service_risk = clamp(
        0.36 * clamp(tail_pressure / 1.8)
        + 0.30 * clamp(availability_budget / 2.5)
        + 0.20 * clamp(error_budget / 2.5)
        + 0.14 * saturation_risk
    )
    evidence_risk = clamp(
        0.24 * (1.0 - float(row["data_freshness"]))
        + 0.22 * (1.0 - float(row["feature_consistency"]))
        + 0.18 * (1.0 - float(row["observability_coverage"]))
        + 0.18 * (1.0 - float(row["rollback_readiness"]))
        + 0.18 * (1.0 - float(row["governance_evidence"]))
    )
    infrastructure_risk = clamp(
        (
            0.40 * service_risk
            + 0.24 * saturation_risk
            + 0.18 * evidence_risk
            + 0.10 * (1.0 - float(row["supply_chain_integrity"]))
            + 0.08 * (1.0 - float(row["security_isolation"]))
        )
        * (0.72 + 0.38 * float(row["consequence"]))
    )

    release_allowed = (
        infrastructure_risk < 0.48
        and tail_pressure <= 1.0
        and availability_budget <= 1.0
        and error_budget <= 1.0
        and float(row["rollback_readiness"]) >= 0.70
        and float(row["observability_coverage"]) >= 0.70
        and float(row["supply_chain_integrity"]) >= 0.70
    )

    if infrastructure_risk >= 0.68:
        risk_band = "severe"
    elif infrastructure_risk >= 0.50:
        risk_band = "high"
    elif infrastructure_risk >= 0.30:
        risk_band = "moderate"
    else:
        risk_band = "lower"

    priorities = {
        "capacity and overload control": saturation_risk,
        "tail latency and service reliability": service_risk,
        "data and feature consistency": max(
            1.0 - float(row["data_freshness"]),
            1.0 - float(row["feature_consistency"]),
        ),
        "observability and rollback": max(
            1.0 - float(row["observability_coverage"]),
            1.0 - float(row["rollback_readiness"]),
        ),
        "security and supply chain": max(
            1.0 - float(row["supply_chain_integrity"]),
            1.0 - float(row["security_isolation"]),
        ),
        "governance evidence": 1.0 - float(row["governance_evidence"]),
    }

    return {
        **row,
        "capacity_rps": round(capacity, 4),
        "utilization": round(utilization, 4),
        "capacity_headroom": round(headroom, 4),
        "tail_pressure": round(tail_pressure, 4),
        "availability_budget_consumption": round(availability_budget, 4),
        "error_budget_consumption": round(error_budget, 4),
        "control_strength": round(control_strength, 4),
        "saturation_risk": round(saturation_risk, 4),
        "service_risk": round(service_risk, 4),
        "evidence_risk": round(evidence_risk, 4),
        "infrastructure_risk": round(infrastructure_risk, 4),
        "release_allowed": int(release_allowed),
        "risk_band": risk_band,
        "priority": max(priorities, key=priorities.get),
    }

def layer_summary(scored: list[dict[str, object]]) -> list[dict[str, object]]:
    groups: dict[str, list[dict[str, object]]] = defaultdict(list)
    for row in scored:
        groups[str(row["workload_type"])].append(row)
    records = []
    for workload, rows in sorted(groups.items()):
        records.append({
            "workload_type": workload,
            "services": len(rows),
            "mean_infrastructure_risk": round(mean(float(r["infrastructure_risk"]) for r in rows), 4),
            "mean_utilization": round(mean(float(r["utilization"]) for r in rows), 4),
            "mean_tail_pressure": round(mean(float(r["tail_pressure"]) for r in rows), 4),
            "mean_control_strength": round(mean(float(r["control_strength"]) for r in rows), 4),
            "release_allowed_rate": round(mean(float(r["release_allowed"]) for r in rows), 4),
        })
    return records

def slo_budget(scored: list[dict[str, object]]) -> list[dict[str, object]]:
    return [{
        "service": row["service"],
        "availability": row["availability"],
        "availability_slo": row["availability_slo"],
        "availability_budget_consumption": row["availability_budget_consumption"],
        "error_rate": row["error_rate"],
        "max_error_rate": row["max_error_rate"],
        "error_budget_consumption": row["error_budget_consumption"],
        "p99_latency_ms": row["p99_latency_ms"],
        "latency_slo_ms": row["latency_slo_ms"],
        "tail_pressure": row["tail_pressure"],
        "release_allowed": row["release_allowed"],
    } for row in scored]

def stress_grid(profiles: list[dict[str, object]]) -> list[dict[str, object]]:
    records = []
    for multiplier in (0.75, 1.00, 1.25, 1.50):
        for base in profiles:
            row = dict(base)
            row["arrival_rate_rps"] = float(row["arrival_rate_rps"]) * multiplier
            scored = score_service(row)
            records.append({
                "demand_multiplier": multiplier,
                "service": scored["service"],
                "utilization": scored["utilization"],
                "tail_pressure": scored["tail_pressure"],
                "saturation_risk": scored["saturation_risk"],
                "infrastructure_risk": scored["infrastructure_risk"],
                "release_allowed": scored["release_allowed"],
                "priority": scored["priority"],
            })
    return records

def scenario_records(profiles: list[dict[str, object]]) -> list[dict[str, object]]:
    scenarios = {
        "Baseline": (0.00, 0.00, 0.00, 0.00, 0.00),
        "Capacity only": (0.25, 0.07, 0.09, 0.00, 0.18),
        "Observability and rollback": (0.00, 0.03, 0.03, 0.18, 0.05),
        "Data and serving consistency": (0.05, 0.08, 0.07, 0.14, 0.04),
        "Integrated production pathway": (0.20, 0.16, 0.16, 0.20, 0.10),
    }
    records = []
    for scenario, (replica_gain, latency_reduction, queue_reduction, control_gain, cost_change) in scenarios.items():
        for base in profiles:
            row = dict(base)
            row["replicas"] = max(1.0, float(row["replicas"]) * (1.0 + replica_gain))
            for column in ("p50_latency_ms", "p95_latency_ms", "p99_latency_ms"):
                row[column] = float(row[column]) * (1.0 - latency_reduction)
            row["queue_pressure"] = clamp(float(row["queue_pressure"]) - queue_reduction)
            row["autoscaling_lag"] = clamp(float(row["autoscaling_lag"]) - queue_reduction)
            for column in CONTROL_COLUMNS:
                row[column] = clamp(float(row[column]) + control_gain)
            row["cost_per_1000_valid_requests"] = float(row["cost_per_1000_valid_requests"]) * (1.0 + cost_change)
            scored = score_service(row)
            records.append({
                "scenario": scenario,
                "service": scored["service"],
                "utilization": scored["utilization"],
                "tail_pressure": scored["tail_pressure"],
                "control_strength": scored["control_strength"],
                "infrastructure_risk": scored["infrastructure_risk"],
                "release_allowed": scored["release_allowed"],
                "cost_per_1000_valid_requests": round(float(scored["cost_per_1000_valid_requests"]), 4),
                "priority": scored["priority"],
            })
    return records

def write_csv(path: Path, rows: list[dict[str, object]]) -> None:
    path.parent.mkdir(parents=True, exist_ok=True)
    if not rows:
        raise ValueError(f"No rows for {path}")
    with path.open("w", newline="", encoding="utf-8") as handle:
        writer = csv.DictWriter(handle, fieldnames=list(rows[0].keys()))
        writer.writeheader()
        writer.writerows(rows)

def main() -> None:
    profiles = load_profiles()
    scored = [score_service(row) for row in profiles]
    scored.sort(key=lambda row: float(row["infrastructure_risk"]), reverse=True)
    write_csv(TABLES / "infrastructure_service_diagnostics.csv", scored)
    write_csv(TABLES / "infrastructure_layer_summary.csv", layer_summary(scored))
    write_csv(TABLES / "infrastructure_slo_budget.csv", slo_budget(scored))
    write_csv(TABLES / "infrastructure_capacity_stress.csv", stress_grid(profiles))
    write_csv(TABLES / "infrastructure_scenarios.csv", scenario_records(profiles))
    print("AI infrastructure workflow complete.")
    print(TABLES / "infrastructure_service_diagnostics.csv")

if __name__ == "__main__":
    main()
This workflow treats AI infrastructure as a production system. The model is only one component within a pipeline of data, compute, serving, monitoring, and governance.
R Workflow: Infrastructure Readiness and MLOps Risk Scoring
R is useful for summarizing readiness, risk, and operational maturity across AI infrastructure components.
# Base R AI infrastructure readiness cross-check.
args <- commandArgs(trailingOnly = FALSE)
file_arg <- grep("^--file=", args, value = TRUE)

if (length(file_arg) > 0) {
  script_path <- normalizePath(sub("^--file=", "", file_arg[1]), mustWork = TRUE)
  article_root <- normalizePath(file.path(dirname(script_path), ".."), mustWork = TRUE)
} else {
  article_root <- getwd()
}

input_file <- file.path(article_root, "data", "ai_infrastructure_profiles.csv")
output_file <- file.path(article_root, "outputs", "tables", "infrastructure_diagnostics_r.csv")

services <- read.csv(input_file, stringsAsFactors = FALSE)
services$capacity_rps <- services$service_rate_per_replica * services$replicas
services$utilization <- services$arrival_rate_rps / services$capacity_rps
services$tail_pressure <- services$p99_latency_ms / services$latency_slo_ms
services$availability_budget_consumption <- (
  (1 - services$availability) /
  pmax(1 - services$availability_slo, 0.000000001)
)
services$error_budget_consumption <- (
  services$error_rate / pmax(services$max_error_rate, 0.000000001)
)
services$control_strength <- rowMeans(
  services[, c(
    "data_freshness", "feature_consistency", "observability_coverage",
    "rollback_readiness", "supply_chain_integrity", "security_isolation",
    "governance_evidence", "energy_efficiency"
  )]
)
services$infrastructure_risk <- pmin(
  1,
  pmax(
    0,
    (
      0.24 * pmin(services$utilization, 1) +
      0.20 * pmin(services$tail_pressure / 1.8, 1) +
      0.18 * pmin(services$availability_budget_consumption / 2.5, 1) +
      0.14 * pmin(services$error_budget_consumption / 2.5, 1) +
      0.14 * (1 - services$control_strength) +
      0.10 * services$queue_pressure
    ) *
    (0.72 + 0.38 * services$consequence)
  )
)
services$release_allowed <- as.integer(
  services$infrastructure_risk < 0.48 &
  services$tail_pressure <= 1 &
  services$availability_budget_consumption <= 1 &
  services$error_budget_consumption <= 1 &
  services$rollback_readiness >= 0.70
)

dir.create(dirname(output_file), recursive = TRUE, showWarnings = FALSE)
write.csv(services, output_file, row.names = FALSE)

cat("Base R infrastructure diagnostics complete.\n")
cat(output_file, "\n")
This workflow treats infrastructure readiness as a measurable system property. High-risk components combine high criticality with high technical debt, making them priorities for governance and engineering attention.
Go Workflow: Lightweight Production Readiness Service
The Go workflow provides a dependency-free operational scoring pattern for capacity, tail latency, availability, freshness, rollback, supply-chain integrity, and release control. It is educational scaffolding rather than a substitute for production telemetry or safety review.
package main

import (
	"encoding/csv"
	"fmt"
	"math"
	"os"
	"path/filepath"
	"strconv"
)

func parse(record map[string]string, key string) float64 {
	value, err := strconv.ParseFloat(record[key], 64)
	if err != nil {
		panic(fmt.Errorf("%s: %w", key, err))
	}
	return value
}

func clamp(value float64) float64 {
	return math.Max(0, math.Min(1, value))
}

func average(values ...float64) float64 {
	total := 0.0
	for _, value := range values {
		total += value
	}
	return total / float64(len(values))
}

func main() {
	input := filepath.Join("..", "data", "ai_infrastructure_profiles.csv")
	output := filepath.Join("..", "outputs", "tables", "infrastructure_scores_go.csv")

	file, err := os.Open(input)
	if err != nil {
		panic(err)
	}
	defer file.Close()

	reader := csv.NewReader(file)
	rows, err := reader.ReadAll()
	if err != nil {
		panic(err)
	}
	headers := rows[0]

	out, err := os.Create(output)
	if err != nil {
		panic(err)
	}
	defer out.Close()

	writer := csv.NewWriter(out)
	defer writer.Flush()
	writer.Write([]string{
		"service", "capacity_rps", "utilization", "tail_pressure",
		"control_strength", "infrastructure_risk", "release_allowed",
	})

	for _, row := range rows[1:] {
		record := map[string]string{}
		for index, header := range headers {
			record[header] = row[index]
		}

		capacity := parse(record, "service_rate_per_replica") * parse(record, "replicas")
		utilization := parse(record, "arrival_rate_rps") / capacity
		tailPressure := parse(record, "p99_latency_ms") / parse(record, "latency_slo_ms")
		allowedUnavailable := math.Max(1-parse(record, "availability_slo"), 0.000000001)
		availabilityBudget := (1 - parse(record, "availability")) / allowedUnavailable
		errorBudget := parse(record, "error_rate") /
			math.Max(parse(record, "max_error_rate"), 0.000000001)
		controlStrength := average(
			parse(record, "data_freshness"),
			parse(record, "feature_consistency"),
			parse(record, "observability_coverage"),
			parse(record, "rollback_readiness"),
			parse(record, "supply_chain_integrity"),
			parse(record, "security_isolation"),
			parse(record, "governance_evidence"),
			parse(record, "energy_efficiency"),
		)

		baseRisk := 0.24*clamp(utilization) +
			0.20*clamp(tailPressure/1.8) +
			0.18*clamp(availabilityBudget/2.5) +
			0.14*clamp(errorBudget/2.5) +
			0.14*(1-controlStrength) +
			0.10*parse(record, "queue_pressure")
		infrastructureRisk := clamp(
			baseRisk * (0.72 + 0.38*parse(record, "consequence")),
		)
		releaseAllowed := infrastructureRisk < 0.48 &&
			tailPressure <= 1 &&
			availabilityBudget <= 1 &&
			errorBudget <= 1 &&
			parse(record, "rollback_readiness") >= 0.70

		writer.Write([]string{
			record["service"],
			fmt.Sprintf("%.4f", capacity),
			fmt.Sprintf("%.4f", utilization),
			fmt.Sprintf("%.4f", tailPressure),
			fmt.Sprintf("%.4f", controlStrength),
			fmt.Sprintf("%.4f", infrastructureRisk),
			strconv.FormatBool(releaseAllowed),
		})
	}

	fmt.Println("Go infrastructure scoring complete.")
	fmt.Println(output)
}
GitHub Repository
The article body includes selected computational examples so the conceptual and mathematical argument remains readable. The full repository contains expanded computational infrastructure: advanced Jupyter notebooks, pipeline DAG simulation, compute-utilization diagnostics, serving-capacity planning, latency-budget modeling, MLOps readiness scoring, observability metadata, SQL schemas, governance checklists, and reproducible outputs.
From Models to Production Systems
AI infrastructure shows that artificial intelligence becomes powerful only when models are embedded in reliable production systems. Data pipelines, feature stores, compute clusters, serving layers, observability systems, security controls, model registries, and governance workflows determine whether a model can operate safely, consistently, and accountably at scale.
The central lesson is that AI is not only a modeling discipline. It is an infrastructure discipline. Production AI requires systems that can ingest data, validate assumptions, schedule computation, deploy models, monitor behavior, detect drift, manage failures, preserve lineage, support audits, and improve over time. Without this infrastructure, even strong models become fragile. With it, AI systems can become reliable components of organizations, platforms, public institutions, and cyber-physical infrastructure.
Within the Artificial Intelligence Systems knowledge series, this article belongs near Data Governance, Provenance, and Lineage in AI Systems, Data Quality, Bias, and Measurement in Machine Learning, Model Training, Optimization, and Evaluation, Model Validation, Benchmarking, and Generalization Theory, Edge AI and Distributed Intelligence, Real-Time AI Systems and Autonomous Decision-Making, and AI Governance and Regulatory Systems. It provides the operational foundation for understanding how AI capability becomes production infrastructure.
The final point is institutional. AI infrastructure determines what an organization can responsibly automate, monitor, audit, and repair. A model without infrastructure is a prototype. A model with weak infrastructure is a liability. A model embedded in robust, observable, secure, and governable infrastructure can become part of accountable systems intelligence.
A Practical Method for Engineering Production AI Infrastructure
1. Define the decision and workload contract
Specify users, consequences, load, latency, availability, freshness, consistency, rights, recovery, fallback, and human authority.
2. Map the complete dependency graph
Connect sources, pipelines, features, indexes, models, tools, services, policies, telemetry, people, and downstream consumers.
3. Establish measurable SLOs and release gates
Define user-visible indicators, windows, error budgets, semantic success, stop conditions, and accountable owners.
4. Model capacity and failure demand
Estimate sustained and burst arrival, service rates, tail latency, memory, storage, network, cold starts, retries, and degraded modes.
5. Validate data and serving consistency
Test schemas, freshness, point-in-time features, training-serving equivalence, index versions, authorization, and fallback behavior.
6. Design scalable but stable control loops
Select meaningful autoscaling signals, stabilization, minimum capacity, quotas, admission control, and bounded queues.
7. Build reproducible artifacts and secure supply chains
Version data, code, environments, models, prompts, policies, images, dependencies, checksums, signatures, and approvals.
8. Instrument the end-to-end service
Correlate traces, metrics, logs, model signals, data signals, cost, energy, decisions, and incidents with controlled cardinality.
9. Use progressive delivery and tested rollback
Shadow or canary representative traffic, compare against a baseline, enforce stop conditions, and restore compatible bundles.
10. Prepare safe degradation and incident response
Define admission control, fallback scope, human routing, service suspension, blast-radius analysis, notification, and remedy.
11. Govern cost, energy, retention, and capacity
Track valid service units, idle resources, storage lifecycle, egress, environmental burden, and reliability headroom.
12. Review outcomes and retire unsafe infrastructure
Use operational evidence to revise architecture, ownership, contracts, and controls; decommission obsolete models and dependencies.
Common Pitfalls in AI Infrastructure Engineering
- Designing around average traffic: Bursts, failures, long inputs, retries, and event-driven surges determine real capacity.
- Measuring model latency alone: Retrieval, features, queues, authorization, networks, and postprocessing shape the user experience.
- Autoscaling on the wrong signal: CPU may not reflect GPU saturation, token load, queueing, or memory pressure.
- Using high accelerator allocation as evidence of efficiency: Communication, padding, idle reservation, and failed work can dominate.
- Assuming a successful health check means semantic validity: Stale features, empty retrieval, and invalid fallbacks can return successful responses.
- Rolling back only the model: Features, indexes, prompts, runtime images, configuration, and policy must remain compatible.
- Retaining telemetry without privacy design: Prompts, features, identifiers, and retrieved content can expose sensitive information.
- Adding retries during overload: Unbounded retries amplify traffic and extend recovery.
- Treating multi-region as automatic resilience: Shared dependencies, stale state, residency rules, and untested promotion can defeat failover.
- Separating security from model and data lineage: Signed software does not validate model weights, datasets, rights, or deployment approval.
- Optimizing unit cost while hiding absolute consumption: Efficiency can coexist with rising total compute, energy, storage, and water use.
- Buying a platform without operational ownership: Tools cannot replace on-call capacity, stewardship, governance, and authority to stop unsafe service.
The central mistake is to treat infrastructure as a collection of products rather than an accountable control system connecting demand, data, compute, serving, evidence, decisions, resources, and response.
Related Articles
- Artificial Intelligence Systems
- Data Governance, Provenance, and Lineage in AI Systems
- Data Quality, Bias, and Measurement in Machine Learning
- Model Training, Optimization, and Evaluation
- Model Validation, Benchmarking, and Generalization Theory
- Edge AI and Distributed Intelligence
- Real-Time AI Systems and Autonomous Decision-Making
- Robustness and Adversarial Resilience in Machine Learning
- Systemic Risk, Feedback Loops, and Cascading Failures in AI Systems
- AI Governance and Regulatory Systems
- Data Systems & Analytics
- Embedded & Edge Systems
- Intelligent Infrastructure Systems
Further Reading
- National Institute of Standards and Technology (2026) AI Risk Management Framework. Available at: https://www.nist.gov/itl/ai-risk-management-framework
- SLSA Community (2025) SLSA Specification Version 1.2. Available at: https://slsa.dev/spec/v1.2/
- OpenTelemetry (2026) Signals. Available at: https://opentelemetry.io/docs/concepts/signals/
- Kubernetes (2026) Vertical Pod Autoscaling. Available at: https://kubernetes.io/docs/concepts/workloads/autoscaling/vertical-pod-autoscale/
- Kubernetes (2026) Horizontal Pod Autoscaling. Available at: https://kubernetes.io/docs/concepts/workloads/autoscaling/horizontal-pod-autoscale/
- Abadi, M. et al. (2016) ‘TensorFlow: Large-Scale Machine Learning on Heterogeneous Distributed Systems’. Available at: https://arxiv.org/abs/1603.04467
- Sculley, D. et al. (2015) ‘Hidden Technical Debt in Machine Learning Systems’, Advances in Neural Information Processing Systems. Available at: https://papers.neurips.cc/paper/5656-hidden-technical-debt-in-machine-learning-systems
- Baylor, D. et al. (2017) ‘TFX: A TensorFlow-Based Production-Scale Machine Learning Platform’, Proceedings of the 23rd ACM SIGKDD International Conference on Knowledge Discovery and Data Mining. Available at: https://dl.acm.org/doi/10.1145/3097983.3098021
- Breck, E. et al. (2017) ‘The ML Test Score: A Rubric for ML Production Readiness and Technical Debt Reduction’. Available at: https://research.google/pubs/the-ml-test-score-a-rubric-for-ml-production-readiness-and-technical-debt-reduction/
- Zaharia, M. et al. (2018) ‘Accelerating the Machine Learning Lifecycle with MLflow’. Available at: https://people.eecs.berkeley.edu/~matei/papers/2018/ieee_mlflow.pdf
- Kubernetes (2026) Kubernetes Documentation. Available at: https://kubernetes.io/docs/home/
- Kubeflow (2026) Kubeflow Documentation. Available at: https://www.kubeflow.org/
- OpenTelemetry (2026) OpenTelemetry Documentation. Available at: https://opentelemetry.io/docs/
- NIST (2023) Artificial Intelligence Risk Management Framework (AI RMF 1.0). Available at: https://www.nist.gov/publications/artificial-intelligence-risk-management-framework-ai-rmf-10
References
- National Institute of Standards and Technology (2026) AI Risk Management Framework. Available at: https://www.nist.gov/itl/ai-risk-management-framework
- SLSA Community (2025) SLSA Specification Version 1.2. Available at: https://slsa.dev/spec/v1.2/
- OpenTelemetry (2026) Signals. Available at: https://opentelemetry.io/docs/concepts/signals/
- Kubernetes (2026) Vertical Pod Autoscaling. Available at: https://kubernetes.io/docs/concepts/workloads/autoscaling/vertical-pod-autoscale/
- Kubernetes (2026) Horizontal Pod Autoscaling. Available at: https://kubernetes.io/docs/concepts/workloads/autoscaling/horizontal-pod-autoscale/
- Abadi, M. et al. (2016) ‘TensorFlow: Large-Scale Machine Learning on Heterogeneous Distributed Systems’. Available at: https://arxiv.org/abs/1603.04467
- Baylor, D. et al. (2017) ‘TFX: A TensorFlow-Based Production-Scale Machine Learning Platform’, Proceedings of the 23rd ACM SIGKDD International Conference on Knowledge Discovery and Data Mining. Available at: https://dl.acm.org/doi/10.1145/3097983.3098021
- Breck, E. et al. (2017) ‘The ML Test Score: A Rubric for ML Production Readiness and Technical Debt Reduction’. Available at: https://research.google/pubs/the-ml-test-score-a-rubric-for-ml-production-readiness-and-technical-debt-reduction/
- Kubeflow (2026) Kubeflow Documentation. Available at: https://www.kubeflow.org/
- Kubernetes (2026) Kubernetes Documentation. Available at: https://kubernetes.io/docs/home/
- NIST (2023) Artificial Intelligence Risk Management Framework (AI RMF 1.0). Available at: https://www.nist.gov/publications/artificial-intelligence-risk-management-framework-ai-rmf-10
- OpenTelemetry (2026) OpenTelemetry Documentation. Available at: https://opentelemetry.io/docs/
- Sculley, D. et al. (2015) ‘Hidden Technical Debt in Machine Learning Systems’, Advances in Neural Information Processing Systems. Available at: https://papers.neurips.cc/paper/5656-hidden-technical-debt-in-machine-learning-systems
- Zaharia, M. et al. (2018) ‘Accelerating the Machine Learning Lifecycle with MLflow’. Available at: https://people.eecs.berkeley.edu/~matei/papers/2018/ieee_mlflow.pdf