
Last Updated May 14, 2026
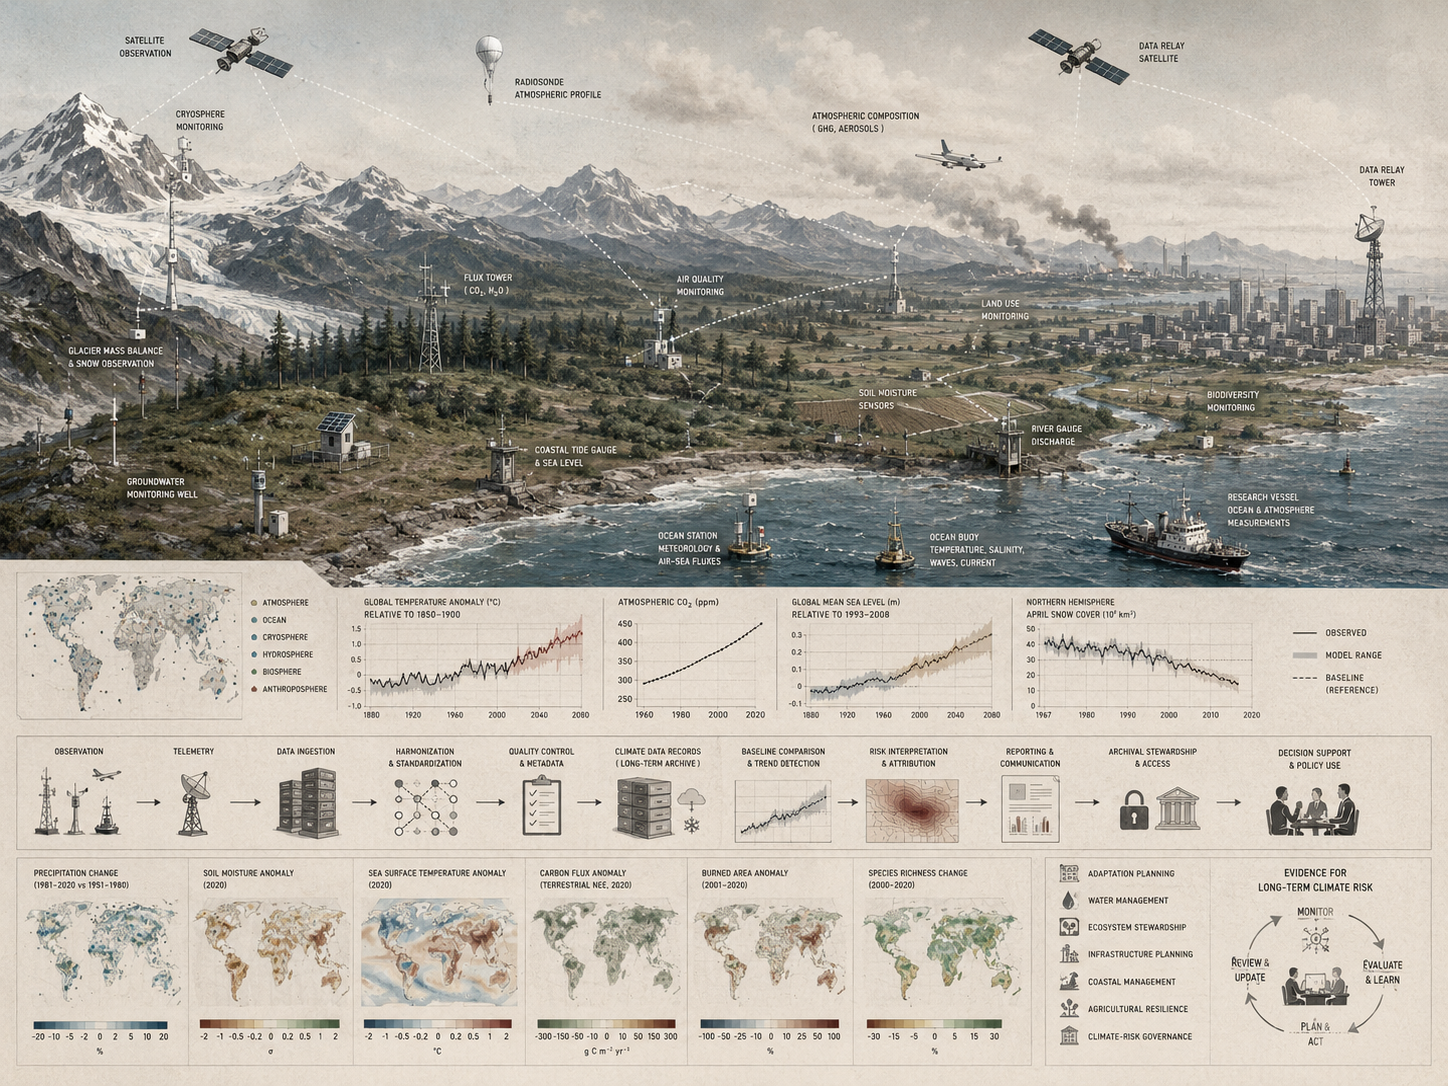
Climate monitoring infrastructure consists of the observing systems, measurement standards, data archives, analytical frameworks, computational services, and institutional arrangements required to detect, compare, and interpret long-term changes in the climate system. It includes surface stations, upper-air observations, ocean measurements, satellite systems, cryosphere observations, greenhouse-gas measurements, data-recovery efforts, calibration standards, reanalysis systems, climate data services, metadata governance, and the institutional structures that sustain continuity across decades. In this sense, climate monitoring is not simply a branch of weather observation. It is the infrastructure through which societies establish baselines, detect long-duration change, assess variability against historical records, and support adaptation, mitigation, infrastructure planning, and climate-risk governance.
Climate change can only be understood where observations are accurate, sustained, comparable, and interpretable across time. A single hot year, drought, flood, or storm says little on its own. Climate knowledge emerges from persistent observation of atmosphere, land, ocean, and cryosphere systems over long time horizons, using methods stable enough to distinguish true climatic change from short-run weather variability, instrument shifts, data gaps, station relocation, or changes in observing practice. Climate monitoring infrastructure is therefore an evidentiary system: it makes long-term environmental change visible, contestable, comparable, and usable for public decision-making.
This article develops Climate Monitoring Infrastructure: Baselines, Observation, and Long-Term Climate Risk as an advanced article within the Intelligent Infrastructure Systems knowledge series. It examines climate monitoring as long-duration public knowledge infrastructure rather than as ordinary environmental data collection. It connects Essential Climate Variables, observing networks, standards, metadata, archives, reanalysis, climate services, baseline continuity, satellite and in situ measurement, governance, data quality, risk detection, and decision support. Selected Python and R examples appear here, while the companion GitHub repository can support reproducible workflows for climate-station metadata, anomaly calculation, quality-control checks, baseline comparison, long-term indicator records, SQL-backed climate archives, sensor-network validation, and systems engineering scaffolds for observation continuity.
Main Library
Publications
Article Map
Intelligent Infrastructure
Related Article Map
Environmental Monitoring
Related Article Map
Data Systems
Related Article Map
Risk & Resilience
For that reason, climate monitoring infrastructure should not be reduced to weather stations alone. It is a layered observational architecture that links in situ measurements, satellite records, instrument metadata, homogenized time series, archives, reanalysis products, and climate services. Its purpose is not merely to collect environmental data, but to preserve the continuity and interpretability of the records through which climate change becomes scientifically, operationally, and politically legible.
Climate monitoring infrastructure therefore sits at the intersection of Earth observation, public policy, risk governance, data stewardship, and long-horizon institutional memory. Where records are sparse, broken, poorly standardized, or inaccessible, climate assessment becomes uncertain and institutionally vulnerable. Where observations are sustained, openly accessible, well documented, and analytically robust, institutions gain a firmer basis for adaptation planning, mitigation tracking, infrastructure design, and climate-risk governance.
Engineering Problem
The engineering problem is how to build climate monitoring systems that can sustain scientifically credible, operationally useful, and institutionally trusted observations across decades. This requires much more than deploying sensors. It requires durable observing networks, stable calibration practices, complete metadata, controlled instrument transitions, interoperable archives, quality-control workflows, reanalysis products, data services, and governance arrangements capable of preserving record integrity over long time horizons.
The difficulty is that climate signals are often interpreted through small changes accumulated over long periods. A station move, instrument replacement, altered observation time, undocumented maintenance gap, degraded sensor, changed satellite retrieval algorithm, or missing metadata record can introduce artificial shifts that complicate trend analysis. Climate monitoring must therefore distinguish environmental change from measurement change. It must also support cross-domain interpretation: atmosphere, ocean, land, cryosphere, hydrology, carbon-cycle variables, and ecosystem indicators all interact in ways that require integrated records rather than isolated measurements.
Strong climate monitoring infrastructure therefore requires an end-to-end operating model. It must define what variables matter, where and how they are observed, how instruments are calibrated, how records are archived, how discontinuities are documented, how quality is assessed, how baselines are calculated, how anomalies are interpreted, and how climate information becomes usable for infrastructure design, adaptation planning, public communication, and climate-risk governance.
| Engineering Tension | Why It Matters | Required Evidence |
|---|---|---|
| Real-time measurement versus long-term record integrity | Operational observations may be useful immediately while still requiring metadata, calibration, and continuity controls for climate analysis. | Station metadata, instrument history, quality-control logs, archive policy |
| Instrument modernization versus comparability | New sensors can improve precision but may introduce discontinuities if transitions are not documented and cross-calibrated. | Overlap records, calibration certificates, transition notes, homogenization records |
| Spatial coverage versus temporal continuity | Expanded coverage is valuable, but climate baselines also require stable long-running records. | Network coverage map, station continuity table, missingness report |
| Raw observations versus decision-ready climate services | Decision-makers often need anomalies, trends, indicators, uncertainty, and context rather than raw measurements alone. | Indicator catalog, reanalysis product documentation, climate-service metadata |
| Scientific precision versus public trust | Climate records influence policy, infrastructure, regulation, and public debate, so transparency and reproducibility matter. | Open data policy, provenance records, reproducible workflows, public evidence package |
The practical question is therefore: can climate monitoring infrastructure preserve the evidentiary chain from measurement to climate knowledge across decades of technological, environmental, and institutional change?
Reference Architecture
A practical reference architecture for climate monitoring infrastructure links observing systems to long-term interpretation. The exact design varies across atmospheric stations, ocean observing networks, glacier monitoring, satellite retrieval systems, carbon-cycle measurements, hydrological records, and climate data services, but the responsibilities remain consistent: observe key variables, document measurement context, preserve records, assess quality, compute baselines and anomalies, interpret trends, and provide decision-ready climate information.
| Layer | Engineering Role | Primary Risk | Evidence Artifact |
|---|---|---|---|
| Variable-definition layer | Defines which climate variables must be observed and why they matter for climate assessment and services. | Monitoring becomes opportunistic rather than tied to climate-system requirements. | Essential Climate Variable map, indicator catalog, measurement objective manifest |
| Observing network layer | Collects in situ, remote-sensing, upper-air, ocean, land, and cryosphere observations. | Records are spatially incomplete, short-lived, or unevenly maintained. | Station inventory, satellite product register, network coverage map |
| Calibration and metadata layer | Documents instruments, siting, maintenance, observing practices, algorithm versions, and measurement uncertainty. | Artificial shifts are mistaken for climate signals or real trends are obscured. | Station metadata, instrument history, calibration log, algorithm-change record |
| Archive and provenance layer | Stores observations, versions, provenance, quality flags, and access rules over long time horizons. | Records become inaccessible, undocumented, or non-reproducible. | Archive manifest, provenance table, data-retention policy, quality-flag schema |
| Analytical and reanalysis layer | Transforms observations into anomalies, baselines, trends, reanalysis products, and climate indicators. | Raw data are used without context or analytical products conceal uncertainty. | Anomaly workflow, reanalysis metadata, trend-analysis notebook, uncertainty note |
| Climate-service layer | Delivers usable climate information for adaptation, mitigation, infrastructure design, risk assessment, and public communication. | Climate data remain scientifically rich but operationally unused. | Climate-service catalog, public dashboard, API documentation, decision-support report |
| Governance and continuity layer | Defines responsibilities, standards, funding, access, review cycles, institutional ownership, and public accountability. | Monitoring systems degrade as budgets, agencies, instruments, and political priorities change. | Governance charter, continuity plan, public evidence package, review log |
This architecture makes clear that climate monitoring is not a sensor network alone. It is an end-to-end knowledge infrastructure that must preserve measurement credibility from observing platform to long-term public use.
Implementation Pattern
A rigorous implementation pattern begins by defining the climate question, not the sensor. A monitoring system should identify which variable is being observed, what climate process it represents, what baseline or indicator it supports, what temporal continuity is required, what metadata are needed, how quality will be assessed, and how the resulting information will support research, public reporting, infrastructure planning, adaptation, mitigation, or risk governance.
| Artifact | Purpose | Suggested Format |
|---|---|---|
| Climate monitoring objective manifest | Defines scope, variables, decision uses, valid-use limits, and public evidence needs. | YAML, Markdown, architecture decision record |
| Essential Climate Variable map | Links observed variables to atmosphere, ocean, land, cryosphere, and carbon-cycle domains. | CSV, YAML, controlled vocabulary |
| Station and platform inventory | Documents observing sites, satellites, buoys, towers, instruments, owners, and operational status. | CSV, SQL table, GeoJSON, sensor registry |
| Instrument metadata and calibration log | Tracks instrument type, siting, calibration, maintenance, replacement, and uncertainty. | CSV, JSON, SQL table, calibration certificate archive |
| Climate record archive manifest | Documents datasets, versions, provenance, quality flags, access rules, and retention commitments. | YAML, SQL table, data catalog |
| Baseline and anomaly workflow | Computes reference-period baselines, anomalies, missingness, and station-level indicators. | Python, R, notebooks, SQL views |
| Continuity and homogeneity review | Identifies station breaks, instrument transitions, missing data, and possible artificial shifts. | Markdown, CSV, statistical report |
| Climate-service evidence package | Explains indicators, assumptions, caveats, uncertainty, decision uses, and governance owner. | Markdown, HTML, PDF, dashboard metadata |
The implementation goal is to make climate-monitoring claims reconstructable. A reader should be able to move from a climate indicator, trend statement, anomaly map, baseline comparison, or public risk claim back to the observations, metadata, quality controls, processing decisions, archive versions, and governance records that support it.
Research-Grade Framing: Climate Monitoring as Long-Duration Public Knowledge Infrastructure
A research-grade account of climate monitoring begins by treating it as public knowledge infrastructure rather than as a passive data stream. Climate records are not self-explanatory. They must be produced through measurement choices, sustained networks, institutional standards, statistical interpretation, and public data stewardship. The credibility of climate knowledge depends on the strength of this infrastructure.
This framing matters because climate monitoring is inherently temporal. It requires continuity across scientific generations, budget cycles, technologies, data systems, and political contexts. Weather observing can tolerate some forms of operational substitution because its main task is immediate forecasting. Climate monitoring cannot be treated the same way. A climate record must remain comparable across decades, which means metadata, calibration, siting, algorithm change, and archive governance become part of the scientific instrument itself.
Climate monitoring also requires humility. No observing network is complete. Some regions are under-observed. Some records contain breaks. Satellite records require retrieval assumptions. Reanalysis products integrate observations through model systems that carry their own uncertainties. Climate services must therefore communicate evidence clearly without pretending that data volume eliminates uncertainty. The objective is not perfect observation, but transparent, sustained, quality-controlled, and interpretable observation.
| Limited Pattern | Stronger Pattern | Why the Shift Matters |
|---|---|---|
| Collect environmental readings | Preserve long-duration climate records with metadata and provenance | Climate evidence depends on comparability over time. |
| Focus on current conditions | Compute baselines, anomalies, trends, and uncertainty | Climate interpretation requires context, not measurements alone. |
| Deploy isolated sensors | Coordinate atmosphere, ocean, land, cryosphere, and satellite systems | Climate change is a coupled Earth-system process. |
| Archive raw data opportunistically | Govern archives as durable public evidence systems | Records must remain discoverable, reproducible, and interpretable. |
| Publish climate products | Document assumptions, uncertainty, versioning, and valid decision uses | Climate services require trust, not only access. |
The central research question is therefore: how can societies sustain climate evidence systems that remain scientifically credible, operationally useful, and publicly trustworthy across generations?
Formal Model: Baselines, Anomalies, Trends, Continuity, and Data Quality
A useful formal model separates observed value, baseline, anomaly, trend, uncertainty, completeness, and quality. Let \(X_{i,t}\) represent an observed climate variable at station or grid cell \(i\) and time \(t\), \(B_i\) a reference-period baseline, \(A_{i,t}\) an anomaly, \(Q_{i,t}\) a quality weight, \(M_{i,t}\) a missingness indicator, and \(\beta_i\) a trend estimate.
A_{i,t} = X_{i,t} – B_i
\]
Interpretation: A climate anomaly compares an observed value with a reference-period baseline. The baseline must be documented and appropriate for the variable and region.
B_i = \frac{1}{N}\sum_{t \in T_{\mathrm{ref}}} X_{i,t}
\]
Interpretation: A baseline is typically computed over a defined reference period. Its usefulness depends on data completeness, station continuity, and methodological consistency.
X_{i,t} = \alpha_i + \beta_i t + \epsilon_{i,t}
\]
Interpretation: A simple trend model estimates long-term change while recognizing residual variability. More advanced models may account for seasonality, autocorrelation, spatial structure, and known breakpoints.
C_i = \frac{\sum_{t=1}^{T} I(X_{i,t}\ \mathrm{observed})}{T}
\]
Interpretation: Record completeness measures the share of expected observations that are available. Sparse or uneven records require caution in climate interpretation.
Q_{\mathrm{record}} =
w_1C +
w_2M +
w_3K +
w_4H +
w_5P +
w_6A
\]
Interpretation: Record quality can be treated as a composite of completeness \(C\), metadata \(M\), calibration \(K\), homogeneity \(H\), provenance \(P\), and archive integrity \(A\).
This formal structure protects against a common mistake in climate communication: treating an observed value as self-evident. Climate interpretation depends on the baseline, the continuity of the record, the quality of the metadata, and the analytical method used to distinguish signal from variability.
What Is Climate Monitoring Infrastructure?
Climate monitoring infrastructure is the observing and data-management architecture through which long-term changes in the climate system are measured and interpreted. It includes measurement networks on land, at sea, in the upper atmosphere, and from space, but it also includes calibration systems, metadata standards, archival processes, quality control, data rescue, reanalysis, climate services, and the institutions that maintain continuity across generations of instruments and observing programs.
This is broader than ordinary operational weather observation. Weather systems prioritize near-term forecasting and warning, whereas climate monitoring must also preserve the continuity and comparability of records over decades. The difference matters because climate assessment depends not only on real-time measurements, but on whether observations remain methodologically stable enough to support trend analysis, anomaly detection, attribution, cross-period comparison, and decision-relevant climate services.
Climate monitoring infrastructure is therefore best understood as the institutionalization of long-horizon environmental observability. It creates the conditions under which temperature trends, precipitation shifts, cryosphere change, sea-level rise, ocean heat content, atmospheric composition, land-cover change, and other climate signals become measurable in a way that can support science, services, and policy.
Why Climate Monitoring Requires Long-Duration Infrastructure
Climate monitoring requires long-duration infrastructure because climate change is fundamentally a problem of persistent change against a background of natural variability. A hot season or anomalous storm may be notable, but it becomes climatologically meaningful only when interpreted against long records, regional context, and broader system behavior. This is why discontinuous, poorly documented, or short-lived observations are often insufficient for climate assessment even when they are operationally useful for weather forecasting or local environmental management.
This matters because climate signals can be subtle at first and strongly differentiated across regions, seasons, and variables. Detecting long-run warming, shifts in precipitation regimes, changes in ocean conditions, atmospheric composition change, cryosphere decline, or sea-level rise requires baselines that remain comparable over time. Climate monitoring is not simply about observing unusual events. It is about building a durable evidentiary record against which change can be recognized, tested, interpreted, and defended analytically.
Climate monitoring is infrastructural not simply because it uses instruments, but because it depends on continuity, maintenance, interoperability, and institutional memory. A record broken by untracked instrument changes, station relocation, changed sampling methods, or missing metadata may still contain information, but its usefulness for climate diagnosis is diminished. The challenge is not only to observe the climate, but to observe it in ways that remain scientifically credible over decades.
| Requirement | Climate Function | Failure If Missing |
|---|---|---|
| Long time series | Distinguishes climate trends from short-term variability. | Events are interpreted without sufficient climatological context. |
| Stable metadata | Documents station moves, instrument changes, siting, sampling, and processing history. | Artificial discontinuities may be mistaken for environmental change. |
| Calibration and quality control | Supports measurement comparability and uncertainty assessment. | Records lose analytical credibility and cross-network comparability. |
| Archive continuity | Preserves observations and provenance across decades. | Historical climate evidence becomes inaccessible or non-reproducible. |
| Analytical services | Transforms observations into baselines, anomalies, indicators, and risk context. | Climate data remain difficult to use for planning and governance. |
Climate monitoring becomes credible when the entire record-production chain is treated as infrastructure.
Core Architecture of Climate Monitoring Systems
Climate monitoring systems can be understood through a layered architecture that links observation to interpretation and public use. Each layer matters because weaknesses in one part of the record chain can undermine the credibility of climate analysis later.
Observing Layer
This layer includes surface stations, radiosondes, ocean buoys, ships, aircraft observations, cryosphere measurement systems, flux towers, hydrological gauges, greenhouse-gas monitoring sites, and Earth-observing satellites. It is the physical basis of climate observability and must span atmosphere, land, ocean, and frozen-water systems rather than focusing on a single environmental domain.
Standards and Metadata Layer
This layer includes calibration protocols, station metadata, siting standards, instrument histories, algorithm versions, quality-control procedures, and uncertainty documentation. It is essential because climate analysis depends on understanding whether apparent changes in data reflect real climatic change or shifts in instrumentation and observation practices.
Data and Archive Layer
At this layer, observations are stored, documented, standardized, versioned, and preserved in ways that support long-term access and comparison. Climate data stores and archives matter because climate knowledge depends on recovering and maintaining records across time rather than merely viewing current conditions.
Analytical Layer
This layer includes homogenization, anomaly calculation, reanalysis, trend assessment, climate indicators, uncertainty analysis, visualization, and reporting. It is where observations become evidence of climate state and climate change rather than isolated raw values.
Service and Decision Layer
This layer includes climate services, adaptation planning, infrastructure design standards, risk disclosure, public communication, and policy support. Climate monitoring becomes infrastructurally meaningful when it informs decisions about risk, resilience, mitigation, and long-run stewardship.
| Layer | Core Capability | Maturity Question |
|---|---|---|
| Observation | Atmosphere, ocean, land, cryosphere, hydrology, and satellite measurement | Are the variables needed for climate assessment being observed reliably? |
| Metadata and standards | Calibration, siting, instrument history, processing versions, quality flags | Can apparent changes be separated from measurement-system changes? |
| Archive and provenance | Long-term storage, versioning, access, documentation, and preservation | Can climate records be recovered, audited, and reproduced over time? |
| Analysis and reanalysis | Baselines, anomalies, trends, gridded products, uncertainty, indicators | Can observations be transformed into credible climate evidence? |
| Services and governance | Climate services, public reporting, adaptation planning, standards, stewardship | Can climate information support responsible decisions and remain trusted? |
This architecture shows that climate monitoring is not simply about taking repeated measurements. It is about preserving the chain of credibility from observation to interpretation to public use.
Essential Climate Variables and System Design
One of the most important organizing ideas in climate monitoring is the concept of Essential Climate Variables. ECVs identify the variables required to systematically observe Earth’s changing climate and organize them across atmosphere, ocean, and terrestrial domains. This framework matters because no monitoring system can observe everything equally; ECVs provide a disciplined basis for deciding what must be observed consistently to support climate assessment, climate services, and long-term risk governance.
The ECV framework also makes clear that climate monitoring is inherently multi-domain. Surface temperature alone is not enough. Climate observation requires precipitation, water vapor, surface radiation, sea level, ocean heat content, glaciers, snow, soil moisture, land cover, greenhouse gases, ocean chemistry, and many other variables whose interactions shape climate behavior.
This gives climate monitoring infrastructure a distinctive design logic. It must support breadth across domains, continuity across time, and sufficient comparability across regions to allow integrated analysis. In that sense, the ECV framework is not just a scientific list. It is an infrastructure-planning concept for climate observability.
| Domain | Example Variables | Infrastructure Implication |
|---|---|---|
| Atmosphere | Temperature, precipitation, water vapor, radiation, wind, greenhouse gases | Requires surface stations, upper-air systems, atmospheric composition networks, satellites, and calibration continuity. |
| Ocean | Sea level, sea-surface temperature, ocean heat content, salinity, ocean color, acidity | Requires buoys, floats, ships, tide gauges, satellites, and long-term marine data systems. |
| Land | Soil moisture, land cover, terrestrial water storage, vegetation, fire disturbance | Requires satellite products, field validation, hydrological observations, land-surface networks, and metadata integration. |
| Cryosphere | Glaciers, snow cover, sea ice, permafrost, ice sheets | Requires remote sensing, field measurements, mass-balance records, and high-latitude observing continuity. |
| Carbon and ecosystems | Greenhouse gases, biomass, ecosystem productivity, ocean carbon, land-use change | Requires atmospheric measurement, flux towers, satellite monitoring, field inventories, and carbon-cycle data services. |
Climate monitoring systems should therefore be evaluated not only by how many sensors they deploy, but by whether they maintain the variables needed for integrated climate-system understanding.
Atmosphere, Ocean, Land, and Cryosphere Observation
Climate monitoring infrastructure spans several major Earth-system domains, each with different observing requirements, time horizons, and interpretive challenges. The strength of climate evidence depends on how these domains are coordinated.
Atmosphere
Atmospheric monitoring includes surface temperature, water vapor, pressure, radiation, wind, precipitation, aerosols, and atmospheric composition. This domain is central because many climate indicators are first experienced through atmospheric conditions. Yet atmospheric data also require long continuity to distinguish structural warming, circulation shifts, and hydrological change from short-term weather noise.
Ocean
Ocean observation is essential because the climate system depends heavily on ocean heat uptake, circulation, sea level, salinity, acidification, and coupled atmosphere-ocean processes. Ocean monitoring differs from atmospheric monitoring because observations often require ships, buoys, floats, tide gauges, moorings, autonomous platforms, and satellite systems over enormous spatial scales and longer temporal structures. It is indispensable for understanding planetary heat imbalance and long-run sea-level change.
Land
Land monitoring includes soil moisture, land cover, terrestrial water storage, surface temperature, vegetation, fire disturbance, snow, and related variables. These observations matter because climate change is mediated through land-atmosphere exchange, hydrology, agriculture, ecosystems, wildfire risk, and human settlement. Land records often connect climate monitoring directly to food systems, drought, fire risk, infrastructure exposure, and adaptation planning.
Cryosphere
Cryosphere monitoring includes glaciers, snow cover, permafrost, sea ice, ice sheets, and related frozen-water systems. This domain is especially important because cryospheric change often acts as a visible indicator of long-run climatic transformation while also influencing sea level, water resources, albedo, ecosystems, and regional climate processes.
| Domain | Primary Observing Challenge | Example Monitoring Infrastructure |
|---|---|---|
| Atmosphere | Maintaining dense, calibrated, comparable records across regions and elevations | Surface stations, radiosondes, aircraft observations, atmospheric composition networks, satellites |
| Ocean | Observing large, deep, dynamic systems with sparse direct access | Argo floats, buoys, ships, tide gauges, moorings, satellite altimetry, ocean reanalysis |
| Land | Linking climate variables to hydrology, vegetation, land use, ecosystems, and human exposure | Soil-moisture networks, flux towers, remote sensing, hydrological gauges, land-cover products |
| Cryosphere | Monitoring remote, rapidly changing, seasonally variable frozen systems | Glacier mass-balance stations, snow networks, ice-sheet remote sensing, sea-ice satellites, permafrost boreholes |
The key point is that climate monitoring is irreducibly cross-domain. No single observing system can substitute for coordinated measurement of atmosphere, ocean, land, and cryosphere together.
Continuity, Baselines, and Long-Term Climate Records
What distinguishes climate monitoring most clearly from many other forms of monitoring is the central importance of long-term records. Climate signals are interpreted against baselines, normals, anomalies, and trends. That requires time series that are long enough to capture variability, stable enough to support comparison, and well documented enough to remain interpretable despite technological change.
This matters because climate records are vulnerable to subtle forms of damage. Station moves, instrument replacement, observational practice changes, undocumented breaks, missing data, changed retrieval algorithms, and incomplete metadata can compromise comparability even when data collection continues. The challenge of climate monitoring is therefore not just maintaining measurement volume, but maintaining record integrity.
Baseline continuity is itself a form of infrastructure stewardship. Preserving climate records, recovering historical observations, documenting changes in measurement systems, and maintaining archives are all part of sustaining the evidentiary basis of climate knowledge. A climate-monitoring system with strong current coverage but weak temporal continuity may remain operationally useful while still being inadequate for long-run climate diagnosis.
| Continuity Threat | How It Affects Interpretation | Governance Response |
|---|---|---|
| Station relocation | Changes exposure, elevation, land cover, or microclimate context. | Document move, maintain overlap period, flag breakpoint, evaluate homogenization. |
| Instrument replacement | Introduces measurement shifts due to different sensor behavior. | Cross-calibrate instruments and preserve transition metadata. |
| Changed observing practice | Alters sampling time, frequency, aggregation, or reporting convention. | Record practice changes and adjust processing where appropriate. |
| Missing observations | Reduces baseline reliability and trend confidence. | Track completeness, avoid unsupported baselines, document imputation. |
| Archive or version loss | Weakens reproducibility and public trust. | Use versioned archives, persistent identifiers, provenance records, and retention policy. |
Climate records should therefore be treated as long-lived public assets requiring maintenance, stewardship, and governance.
Climate Data Services, Reanalysis, and Interpretation
Climate monitoring does not end with observation. Climate data services translate records into usable public knowledge. They provide information about past and present climate conditions, long-term trends, anomalies, uncertainty, and future-oriented context that can support both mitigation and adaptation.
Reanalysis and related analytical products are especially important because they combine observations with physically consistent modeling frameworks to generate spatially and temporally coherent pictures of climate conditions. These products do not replace direct observation, but they make climate information more interpretable and more usable across regions and sectors.
Interpretation matters because climate monitoring is valuable only when observations can support reasoning about trend, anomaly, risk, and action. Climate data services are therefore part of climate monitoring infrastructure itself, not just secondary communication products.
| Service or Product | Function | Risk If Poorly Governed |
|---|---|---|
| Climate data archive | Preserves observations, metadata, quality flags, and dataset versions. | Records become difficult to audit or reproduce. |
| Climate normal and baseline products | Provide reference periods for anomaly and change analysis. | Baseline choice becomes unclear or inconsistent. |
| Reanalysis products | Integrate observations and models into coherent spatial-temporal fields. | Users may treat model-assisted products as direct observations without caveats. |
| Climate indicators | Summarize trends, extremes, anomalies, and risks for public use. | Indicators may obscure uncertainty or methodological assumptions. |
| Climate service dashboards and APIs | Deliver usable information to planners, researchers, engineers, and the public. | Data may be used beyond valid scope without documentation. |
Climate services are strongest when they connect usable information to transparent methods, documented uncertainty, and clear decision-use boundaries.
Governance, Standards, and Institutional Capacity
Climate monitoring is a governance problem as much as a technical one. Institutions must decide which variables to sustain, where to observe, how to calibrate, how to archive, how to share access, how to coordinate across countries and agencies, and how to preserve monitoring continuity across changing political and financial conditions. These decisions shape what becomes visible and what remains uncertain.
Standards matter because climate observations must be comparable across time and space. Without calibration, metadata, methodological continuity, and quality-control procedures, climate records lose value for trend assessment. Climate-observing systems therefore depend on standards not as administrative detail, but as part of the epistemic foundation of climate knowledge.
Institutional capacity matters just as much. A country can possess instruments and still lack effective climate monitoring if archives are weak, data access is restricted, staffing is unstable, maintenance is underfunded, or analytical capability is thin. Climate monitoring infrastructure is therefore not only technical infrastructure. It is institutional infrastructure for continuity, interpretation, and public trust.
| Capability | Purpose | Evidence Artifact |
|---|---|---|
| Variable stewardship | Defines which climate variables must be sustained and why. | Essential Climate Variable map, observing strategy |
| Measurement standards | Ensures calibration, siting, sampling, uncertainty, and comparability. | Calibration policy, station metadata, quality-control protocol |
| Archive governance | Preserves datasets, versions, provenance, metadata, and access. | Archive manifest, retention policy, persistent identifiers |
| Open data and reproducibility | Supports public trust, scientific review, and reuse. | Access policy, API documentation, reproducible workflow repository |
| Continuity planning | Protects records from budget cycles, agency changes, and technology transitions. | Continuity plan, funding record, transition review log |
The governance question is whether climate monitoring can remain credible across the very time horizons that climate change itself requires us to understand.
Climate Risk Detection and Public Decision-Making
One of the most consequential public functions of climate monitoring infrastructure is climate-risk detection. Long-run warming, shifting precipitation regimes, changing extremes, sea-level rise, ocean heat uptake, drought risk, and cryosphere decline all matter because they shape infrastructure standards, adaptation planning, agriculture, water management, insurance, public safety, and ecosystem stewardship. Climate monitoring supports these decisions by making long-term change legible before it becomes politically or operationally impossible to ignore.
This differs from short-term early warning, though the two are related. Weather forecasting helps societies manage immediate events; climate monitoring helps them understand the changing background conditions against which those events occur. Without climate monitoring, extreme events can still be forecast, but their relationship to long-run change is harder to assess. Infrastructure design may continue relying on obsolete baselines, adaptation planning may be reactive, and risk communication may become vulnerable to isolated-event interpretation.
Climate monitoring infrastructure therefore supports public decision-making not simply by generating data, but by changing what governments, planners, engineers, and institutions can plausibly know about long-run risk. It provides the baseline evidence that allows adaptation and mitigation decisions to be evaluated against reality rather than assumption.
| Decision Domain | Monitoring Contribution | Example Use |
|---|---|---|
| Infrastructure design | Provides changing baselines for heat, rainfall, flood, drought, wind, and sea-level conditions. | Updating design standards and asset-risk models. |
| Adaptation planning | Identifies long-run exposure trends and emerging regional risk. | Prioritizing drainage, cooling, water, and coastal resilience investments. |
| Mitigation tracking | Supports atmospheric composition monitoring and emissions-related indicators. | Assessing greenhouse-gas trends and policy-relevant indicators. |
| Water and agriculture | Tracks precipitation, soil moisture, drought, snowpack, and hydrological change. | Planning water allocation, drought response, and agricultural risk management. |
| Public communication | Provides baselines, anomalies, trends, and uncertainty context. | Explaining climate change without relying only on isolated events. |
Climate monitoring is therefore a prerequisite for responsible long-term public planning. It transforms environmental observation into institutional foresight.
Deployment Readiness Gate
Before climate monitoring systems are used for public reporting, infrastructure standards, climate-risk assessment, adaptation planning, mitigation tracking, or policy decision-making, they should pass a readiness gate. The purpose is not to delay data use, but to make sure climate claims are supported by documented observations, reliable metadata, suitable baselines, and transparent methods.
| Readiness Check | Pass Condition | Evidence |
|---|---|---|
| Variable scope | Climate variables, domains, indicators, and decision uses are defined. | Climate monitoring objective manifest, ECV map |
| Station and platform inventory | Observing assets, locations, ownership, variables, and operational status are documented. | Station inventory, platform register, GeoJSON layer |
| Metadata completeness | Instrument, siting, calibration, maintenance, and processing metadata are available. | Metadata table, calibration log, quality-control record |
| Record continuity | Missingness, station moves, instrument changes, and known breakpoints are reviewed. | Continuity review, completeness report, breakpoint notes |
| Baseline validity | Reference period, calculation method, and data completeness thresholds are documented. | Baseline policy, anomaly workflow, reproducible notebook |
| Archive and provenance | Datasets are versioned, preserved, and traceable to source observations. | Archive manifest, provenance table, persistent identifiers |
| Uncertainty and caveats | Limitations, uncertainty, coverage gaps, and valid decision uses are stated. | Uncertainty note, public evidence package, model card |
| Governance ownership | Responsible institutions, update cycles, maintenance duties, and public access rules are defined. | Governance log, continuity plan, access policy |
A climate monitoring system that cannot pass this readiness gate may still produce useful operational data, but its outputs should be treated cautiously when used for long-term climate interpretation.
Data and Configuration Artifacts
The companion repository can use a data-first structure so climate-monitoring claims can be examined rather than merely asserted. Each artifact has a specific role in making the record chain reconstructable across observing systems, metadata, baselines, anomalies, archives, governance, and public evidence.
| Artifact | File | Purpose |
|---|---|---|
| Climate monitoring objective manifest | config/climate_monitoring_objective.yml |
Defines variables, domains, decision uses, valid-use caveats, and public evidence needs. |
| Essential Climate Variable map | data/essential_climate_variable_map.csv |
Links observed variables to climate domains and monitoring purposes. |
| Station and platform inventory | data/climate_observation_platforms.csv |
Tracks stations, buoys, satellites, towers, gauges, domains, variables, and ownership. |
| Instrument metadata log | data/instrument_metadata_calibration_log.csv |
Documents instrument type, calibration status, siting, maintenance, and transition notes. |
| Climate observations sample | data/climate_observations_sample.csv |
Provides example station observations for anomaly and quality-control workflows. |
| Archive manifest | data/climate_archive_manifest.csv |
Documents dataset versions, provenance, quality flags, and access conditions. |
| SQL schema | sql/schema.sql |
Creates a local SQLite database for climate monitoring records and metadata. |
These artifacts are intentionally simple enough to audit and extend. They can be replaced with institutional data sources later, but the scaffold makes the logic of climate monitoring explicit from the beginning.
Mathematical Lens: Climate Baselines, Anomalies, and Observation Quality
A lightweight mathematical lens helps distinguish raw measurement from climate evidence. The point is not to reduce climate monitoring to a single equation, but to make visible the relationships among observation, baseline, anomaly, trend, completeness, metadata, calibration, and archive quality.
A_{i,t} = X_{i,t} – B_i
\]
Interpretation: An anomaly compares an observation with a baseline. The baseline period and method must be documented.
C_i = \frac{N_{\mathrm{observed},i}}{N_{\mathrm{expected},i}}
\]
Interpretation: Record completeness affects confidence in baselines, anomalies, and trends. Missingness should be measured, not ignored.
Q_{\mathrm{station}} =
w_1C +
w_2M +
w_3K +
w_4H +
w_5P
\]
Interpretation: Station quality depends on completeness \(C\), metadata \(M\), calibration \(K\), homogeneity \(H\), and provenance \(P\).
This mathematical framing should be used as a structured diagnostic, not as a substitute for climatological expertise, station-history review, uncertainty analysis, or local observing knowledge.
Python Workflow: Climate Baseline and Anomaly Review
The Python workflow in the companion repository can read station metadata and observation records, compute baseline values, calculate anomalies, evaluate completeness, and flag records that require review before they are used for long-term interpretation. The sample below illustrates the core logic.
from pathlib import Path
import pandas as pd

ARTICLE_DIR = Path("articles/climate-monitoring-infrastructure-baselines-observation-and-long-term-climate-risk")
DATA_DIR = ARTICLE_DIR / "data"
OUTPUT_DIR = ARTICLE_DIR / "outputs"
OUTPUT_DIR.mkdir(parents=True, exist_ok=True)

observations = pd.read_csv(DATA_DIR / "climate_observations_sample.csv", parse_dates=["date"])
metadata = pd.read_csv(DATA_DIR / "instrument_metadata_calibration_log.csv")

reference_start = "1991-01-01"
reference_end = "2020-12-31"

reference = observations[
    (observations["date"] >= reference_start) &
    (observations["date"] <= reference_end)
]

baseline = (
    reference
    .groupby(["station_id", "variable"])["value"]
    .mean()
    .reset_index()
    .rename(columns={"value": "baseline_value"})
)

record_counts = (
    observations
    .groupby(["station_id", "variable"])
    .agg(
        observed_count=("value", "count"),
        first_date=("date", "min"),
        last_date=("date", "max")
    )
    .reset_index()
)

expected_count = observations["date"].nunique()

record_counts["record_completeness"] = (
    record_counts["observed_count"] / expected_count
)

review = (
    observations
    .merge(baseline, on=["station_id", "variable"], how="left")
    .merge(record_counts, on=["station_id", "variable"], how="left")
    .merge(metadata, on="station_id", how="left")
)

review["anomaly"] = review["value"] - review["baseline_value"]

review["quality_review_flag"] = (
    (review["record_completeness"] < 0.80) |
    (review["calibration_status"] != "current") |
    (review["metadata_status"] != "complete")
)

review.to_csv(OUTPUT_DIR / "climate_anomaly_quality_review.csv", index=False)

station_summary = (
    review
    .groupby(["station_id", "station_name", "variable"])
    .agg(
        mean_anomaly=("anomaly", "mean"),
        max_anomaly=("anomaly", "max"),
        min_anomaly=("anomaly", "min"),
        record_completeness=("record_completeness", "first"),
        quality_review_flag=("quality_review_flag", "max")
    )
    .reset_index()
)

station_summary.to_csv(OUTPUT_DIR / "climate_station_summary.csv", index=False)

print(station_summary)
This workflow is intentionally transparent. It shows how a climate anomaly depends on baseline choice, observation completeness, metadata quality, and calibration status rather than on measurement values alone.
R Workflow: Climate Station Summary and Trend Reporting
The R workflow can summarize station-level anomaly records and estimate simple trends for exploratory reporting. It is designed for transparent climate-record review rather than operational climate attribution.
library(readr)
library(dplyr)
library(lubridate)
library(broom)

article_dir <- "articles/climate-monitoring-infrastructure-baselines-observation-and-long-term-climate-risk"
data_dir <- file.path(article_dir, "data")
output_dir <- file.path(article_dir, "outputs")
dir.create(output_dir, recursive = TRUE, showWarnings = FALSE)

observations <- read_csv(file.path(data_dir, "climate_observations_sample.csv"), show_col_types = FALSE) %>%
  mutate(date = as.Date(date), year = year(date))

metadata <- read_csv(file.path(data_dir, "instrument_metadata_calibration_log.csv"), show_col_types = FALSE)

reference <- observations %>%
  filter(date >= as.Date("1991-01-01"), date <= as.Date("2020-12-31"))

baseline <- reference %>%
  group_by(station_id, variable) %>%
  summarise(baseline_value = mean(value, na.rm = TRUE), .groups = "drop")

annual_anomalies <- observations %>%
  left_join(baseline, by = c("station_id", "variable")) %>%
  mutate(anomaly = value - baseline_value) %>%
  group_by(station_id, variable, year) %>%
  summarise(mean_anomaly = mean(anomaly, na.rm = TRUE), .groups = "drop")

trend_summary <- annual_anomalies %>%
  group_by(station_id, variable) %>%
  do(tidy(lm(mean_anomaly ~ year, data = .))) %>%
  ungroup() %>%
  filter(term == "year") %>%
  transmute(
    station_id,
    variable,
    annual_trend = estimate,
    p_value = p.value
  ) %>%
  left_join(metadata, by = "station_id")

write_csv(annual_anomalies, file.path(output_dir, "annual_climate_anomalies.csv"))
write_csv(trend_summary, file.path(output_dir, "station_trend_summary.csv"))

print(trend_summary)
The purpose is not to produce definitive climate attribution. It is to demonstrate how station records, baseline periods, anomalies, and trend summaries can be made reproducible and auditable.
Systems Code: Climate Records, Sensor Networks, and Data Services
The companion repository can extend the article into a reproducible systems scaffold. Python and R support analytical review; SQL stores evidence; YAML files define objectives and scoring policies; GeoJSON provides spatial placeholders; TypeScript can support dashboard interfaces; Go can support climate-data service endpoints; Rust can support strict record validation; C can support embedded station-quality checks; Fortran can support numerical climate calculations; MicroPython can support edge observing nodes; PYNQ and HDL can support hardware-accelerated stream validation where appropriate.
| Directory | Role | Example Use |
|---|---|---|
python/ |
Baseline, anomaly, quality-control, and station-summary workflows | Compute anomalies and flag low-quality records |
r/ |
Trend summaries, station diagnostics, climate reporting | Estimate annual anomaly trends and generate summaries |
sql/ |
Evidence tables and auditable queries | Join stations, observations, metadata, baselines, and archive records |
c/ and embedded_c/ |
Sensor-quality checks and embedded observation logic | Validate station readings and threshold basic range checks |
rust/ |
Strict validation and CLI scaffolding | Validate climate records, metadata, and value ranges |
go/ |
Climate-data service scaffold | Expose station-status or indicator metadata over a lightweight API |
fortran/ |
Numerical climate calculations | Prototype baseline, anomaly, and trend routines |
micropython/ |
Edge observing-node scaffold | Prototype low-power climate sensor telemetry |
pynq/ and hdl/ |
Hardware-assisted stream validation | Prototype FPGA checks for missingness, bounds, and quality flags |
typescript/ |
Dashboard/interface scaffold | Display station completeness, anomaly status, and quality review flags |
The code should be understood as an engineering scaffold for reproducible climate-monitoring workflows, not as a replacement for validated climate data systems or official climate services.
GitHub Repository
Complete Code Repository
The companion repository contains reproducible scaffolding for climate-observation inventories, Essential Climate Variable maps, station metadata, calibration records, baseline and anomaly workflows, SQL-backed climate archives, quality-control checks, sensor-network validation, and multi-language climate monitoring infrastructure examples.
Testing and Validation
Testing climate monitoring infrastructure requires more than checking whether observations exist. Validation should examine whether the records are complete, calibrated, documented, comparable, versioned, and appropriate for the intended climate interpretation. Climate data systems should also be tested for provenance, archive durability, metadata completeness, station continuity, and reproducibility of analytical outputs.
| Validation Area | Test Question | Failure Signal |
|---|---|---|
| Station and platform inventory | Are observing assets, locations, variables, owners, and status documented? | Observations appear without clear source context. |
| Metadata completeness | Are instrument type, siting, calibration, maintenance, and algorithm versions recorded? | Trend interpretation cannot distinguish climate signal from observing-system change. |
| Record completeness | Are missing values, gaps, and coverage limitations measured? | Baselines or trends are computed from sparse or uneven records. |
| Baseline validity | Is the reference period, method, and completeness threshold documented? | Anomalies are published without baseline transparency. |
| Archive provenance | Can products be traced back to source observations and processing versions? | Climate products cannot be reproduced or audited. |
| Decision-use caveats | Are limitations, uncertainty, and valid-use boundaries communicated? | Climate data are used beyond their appropriate scale, period, or uncertainty range. |
Validation should be repeated after instrument changes, station relocation, dataset version changes, new reanalysis products, archive migrations, and major changes in public-facing climate services.
Operational Signals and Climate Monitoring Observability
Climate monitoring observability means being able to see whether the observing system itself is functioning as a trustworthy infrastructure. This includes station uptime, telemetry delay, missingness, calibration status, metadata completeness, archive versioning, quality flags, and user access to climate services.
| Signal | What It Reveals | Operational Use |
|---|---|---|
| Station uptime and telemetry latency | Whether observing systems are producing timely and continuous records | Maintenance scheduling and network reliability review |
| Record completeness | Whether a time series has enough observations for baseline and trend use | Baseline eligibility and data-quality flagging |
| Calibration status | Whether instruments remain within accepted measurement standards | Instrument maintenance, uncertainty review, record qualification |
| Metadata completeness | Whether observations can be interpreted across time | Climate record continuity and homogenization review |
| Archive version and provenance | Whether data products are traceable and reproducible | Scientific audit, public trust, and reproducible climate services |
| Climate-service access | Whether users can retrieve and interpret climate records | Public data governance and decision-support improvement |
Climate monitoring observability is strongest when the infrastructure can monitor not only the climate system, but also the health and credibility of its own observing and data systems.
Engineer and Researcher Checklist
- Define the climate variables, domains, indicators, and decision uses the monitoring system must support.
- Document stations, platforms, satellites, sensors, locations, owners, and operational status.
- Preserve instrument metadata, calibration records, siting information, maintenance logs, and algorithm versions.
- Measure missingness, station continuity, known breakpoints, and record completeness before computing baselines.
- Document baseline periods, anomaly methods, trend models, uncertainty, and valid-use limits.
- Use versioned archives and provenance records so climate products can be audited and reproduced.
- Distinguish raw observations, quality-controlled records, homogenized records, reanalysis products, and public indicators.
- Design climate services around decision needs without hiding assumptions or uncertainty.
- Protect long-running records from short-term funding, institutional, and technology disruptions.
- Publish public evidence that explains what is known, what is uncertain, and how records are maintained.
This checklist is intentionally practical. It keeps climate monitoring focused on durable evidence rather than data accumulation alone.
Where This Fits in the Series
Climate monitoring infrastructure connects several major threads within the Intelligent Infrastructure Systems knowledge series. It relies on environmental monitoring to observe atmospheric, oceanic, land, and cryosphere systems; data platforms to preserve and interpret records; digital infrastructure to distribute climate services; risk and resilience frameworks to translate long-term change into public planning; and governance systems to sustain trust, continuity, and standards.
This article therefore functions as a bridge between observation and long-term decision-making. It shows that intelligent infrastructure is not only about real-time sensing, automation, or optimization. It is also about preserving the baselines, records, and institutions that allow societies to understand how environmental conditions are changing over decades.
Related Articles
- Infrastructure for Environmental Monitoring Systems
- Infrastructure Data Platforms and Analytics
- Digital Infrastructure Systems
- Urban Sensor Networks and Infrastructure Monitoring
- Infrastructure Systems for Urban Resilience
- Infrastructure Systems for Climate Adaptation
- Flood and Disaster Early Warning Infrastructure
- Infrastructure Governance and Policy Systems
These connections are substantive rather than decorative. Climate monitoring is not an isolated scientific niche, but a systems domain connecting observation, baselines, risk, data infrastructure, and long-horizon public governance.
Future Directions
The future of climate monitoring infrastructure will likely involve tighter integration of satellites and in situ systems, stronger open climate-data services, continued refinement of Essential Climate Variables, improved recovery of historical records, better station metadata, more transparent reanalysis products, and more extensive use of climate indicators in adaptation and infrastructure planning. It will also require stronger attention to under-observed regions, ocean and cryosphere continuity, urban climate baselines, compound-risk indicators, and the long-term governance of public climate archives.
The deeper challenge, however, is not simply producing more climate data. It is preserving comparability, continuity, and institutional usefulness over time. Climate monitoring infrastructure will matter most where it supports durable records, credible interpretation, and better public decisions under growing climatic pressure rather than merely increasing the volume of available observations. The long-run goal is not observation for its own sake. It is a climate intelligence system capable of detecting change early, interpreting it responsibly, and supporting adaptation and mitigation across generations.
Further Reading
- World Meteorological Organization (WMO) (n.d.) Global Observing System. Available at: https://wmo.int/site/knowledge-hub/programmes-and-initiatives/global-observing-system-gos.
- World Meteorological Organization (WMO) (n.d.) Global Climate Observing System. Available at: https://wmo.int/site/knowledge-hub/programmes-and-initiatives/global-climate-observing-system-gcos-0.
- Global Climate Observing System (GCOS) (n.d.) Essential Climate Variables. Available at: https://gcos.wmo.int/site/global-climate-observing-system-gcos/essential-climate-variables.
- Copernicus Climate Change Service (C3S) (n.d.) Climate Data Store. Available at: https://cds.climate.copernicus.eu/.
- Copernicus Climate Change Service (C3S) (n.d.) Climate Bulletins. Available at: https://climate.copernicus.eu/climate-bulletin.
- Intergovernmental Panel on Climate Change (IPCC) (2021) Climate Change 2021: The Physical Science Basis. Available at: https://www.ipcc.ch/report/ar6/wg1/.
References
- Copernicus Climate Change Service (C3S) (n.d.) Climate Data Store. Available at: https://cds.climate.copernicus.eu/.
- Copernicus Climate Change Service (C3S) (n.d.) Climate Bulletin. Available at: https://climate.copernicus.eu/climate-bulletin.
- Global Climate Observing System (GCOS) (n.d.) Essential Climate Variables. Available at: https://gcos.wmo.int/site/global-climate-observing-system-gcos/essential-climate-variables.
- Intergovernmental Panel on Climate Change (IPCC) (2021) Climate Change 2021: The Physical Science Basis. Available at: https://www.ipcc.ch/report/ar6/wg1/.
- World Meteorological Organization (WMO) (n.d.) Global Observing System (GOS). Available at: https://wmo.int/site/knowledge-hub/programmes-and-initiatives/global-observing-system-gos.
- World Meteorological Organization (WMO) (n.d.) Global Climate Observing System (GCOS). Available at: https://wmo.int/site/knowledge-hub/programmes-and-initiatives/global-climate-observing-system-gcos-0.