
Last Updated May 14, 2026
Infrastructure for environmental monitoring systems consists of the physical, digital, analytical, and institutional systems required to observe environmental conditions, detect change, assess risk, and support stewardship across air, water, land, climate, biodiversity, pollution, and ecosystem domains. It includes observing stations, field instrumentation, remote-sensing platforms, laboratory systems, sensor networks, sampling regimes, telemetry, communications systems, databases, geospatial platforms, indicator frameworks, modeling tools, public-reporting systems, and the governance arrangements that connect them. In this sense, environmental monitoring infrastructure is not merely a scientific support function. It is part of the public infrastructure through which societies understand environmental conditions, detect degradation, protect public health, and govern environmental risk.
Environmental systems are dynamic, spatially uneven, and often only partially visible without organized observation. Air pollution can vary sharply across districts. Water quality can deteriorate long before visible signs appear. Climate trends emerge across long time horizons, while storms, droughts, heat extremes, wildfire smoke, and flood conditions can unfold rapidly. Ecosystems can degrade incrementally until thresholds are crossed. Without monitoring infrastructure, environmental change remains difficult to detect, compare, interpret, and govern. Public institutions may generate scattered measurements without building the durable environmental intelligence needed for stewardship.
This article develops Infrastructure for Environmental Monitoring Systems: Observation, Risk, and Stewardship as an advanced article within the Intelligent Infrastructure Systems knowledge series. It examines environmental monitoring as public knowledge infrastructure rather than as isolated measurement activity. It connects observing networks, telemetry, laboratory systems, remote sensing, standards, metadata, quality assurance, indicators, risk detection, public reporting, environmental justice, institutional capacity, and management action. Selected Python and R examples appear here, while the companion GitHub repository can support reproducible workflows for monitoring-site inventories, observation records, threshold analysis, indicator construction, quality-control checks, sensor validation, geospatial metadata, SQL-backed archives, embedded monitoring devices, and multi-language systems-engineering scaffolds.
Main Library
Publications
Article Map
Intelligent Infrastructure
Related Article Map
Environmental Monitoring
Related Article Map
Data Systems
Related Article Map
Risk & Resilience
For that reason, environmental monitoring should not be reduced to disconnected stations, occasional reports, or dashboards detached from action. A monitoring system becomes infrastructurally meaningful when observations are sustained over time, connected across scales, aligned to standards, made interpretable through indicators and analysis, and linked to institutional decisions about public health, environmental protection, adaptation, enforcement, and resource management.
Infrastructure for environmental monitoring systems therefore sits at the intersection of environmental science, digital infrastructure, public policy, risk governance, community exposure, and long-term stewardship. Where these layers remain fragmented, institutions may generate data without building real environmental intelligence. Where they are integrated thoughtfully, monitoring infrastructure can support earlier detection of risk, more credible policy, stronger accountability, and better protection of environmental systems under growing pressure.
Engineering Problem
The engineering problem is how to build environmental monitoring systems that can observe conditions reliably, preserve measurement credibility, integrate heterogeneous data, detect meaningful change, and support timely stewardship decisions across complex environmental domains. This is not a narrow problem of deploying sensors or publishing dashboards. It is a systems problem involving field instrumentation, sampling design, remote sensing, telemetry, laboratory workflows, metadata, calibration, quality assurance, geospatial integration, threshold logic, indicator design, institutional authority, community exposure, and decision pathways.
This problem is difficult because environmental systems vary across space, time, scale, and domain. A water-quality sample may depend on upstream discharge, land use, rainfall, wastewater loading, and seasonal dynamics. Air-quality exposure may vary block by block. Soil moisture, habitat condition, vegetation stress, fire risk, heat exposure, and hydrological change often require combined remote and in situ observation. Environmental risk may accumulate slowly and then cross thresholds suddenly. A monitoring system must therefore distinguish ordinary variability from meaningful change, local noise from systemic deterioration, and raw measurement from policy-relevant evidence.
Strong environmental monitoring infrastructure requires a full-chain operating model. It must define what is measured, why it matters, where observations occur, how instruments are calibrated, how samples are collected, how records are transmitted, how metadata are preserved, how quality is assessed, how indicators are constructed, how thresholds are interpreted, and how findings trigger stewardship, enforcement, public-health response, adaptation, or resource-management decisions.
| Engineering Tension | Why It Matters | Required Evidence |
|---|---|---|
| Observation density versus interpretability | More sensors do not automatically produce better environmental intelligence if records lack metadata, standards, or decision context. | Monitoring objective manifest, site metadata, indicator catalog |
| Real-time sensing versus long-term comparability | Immediate telemetry can support alerting, but long-term stewardship requires continuity, calibration, and record quality. | Calibration logs, station history, quality-control records |
| Remote sensing versus field validation | Satellite and aerial data extend coverage but require ground truth and domain-specific interpretation. | Validation dataset, field sampling protocol, uncertainty note |
| Raw data versus usable indicators | Environmental governance often needs status, trend, threshold, and exposure indicators rather than raw readings alone. | Indicator definitions, baseline methods, threshold policy |
| Network coverage versus environmental justice | Spatial averages can hide disproportionate exposure and monitoring gaps in vulnerable communities. | Exposure map, coverage equity review, community monitoring record |
| Scientific monitoring versus institutional action | Monitoring systems remain incomplete if results do not inform enforcement, remediation, public reporting, or stewardship. | Governance protocol, response workflow, after-action log |
The practical question is therefore: can environmental monitoring infrastructure transform observations into credible, comparable, actionable evidence before degradation becomes harder to reverse?
Reference Architecture
A practical reference architecture for environmental monitoring infrastructure links observation to stewardship action. The exact system varies across air quality, water quality, hydrology, climate observation, biodiversity, land condition, pollution, waste, and ecosystem monitoring, but the responsibilities remain consistent: define variables, observe conditions, transmit records, preserve metadata, assess quality, integrate data, construct indicators, detect risk, report findings, and support management decisions.
| Layer | Engineering Role | Primary Risk | Evidence Artifact |
|---|---|---|---|
| Monitoring objective layer | Defines environmental domains, variables, use cases, thresholds, and decision needs. | Monitoring becomes opportunistic rather than aligned to stewardship requirements. | Monitoring objective manifest, domain-variable map, indicator catalog |
| Observing and sampling layer | Collects field, laboratory, satellite, drone, station, gauge, and sensor observations. | Environmental conditions remain under-observed, biased, or incomparable. | Site inventory, sampling protocol, sensor register, laboratory method record |
| Telemetry and communications layer | Moves observations from field sites, sensors, laboratories, and platforms into data systems. | Records are delayed, lost, fragmented, or inaccessible during critical periods. | Telemetry log, network status, device-health register, field reporting workflow |
| Metadata and quality layer | Documents methods, instruments, calibration, uncertainty, quality flags, site context, and provenance. | Observed differences are misinterpreted because measurement context is missing. | Metadata table, calibration log, quality-control schema, provenance record |
| Data integration and archive layer | Stores, standardizes, links, versions, and preserves environmental records across domains and time. | Environmental data exist but cannot be compared, audited, or reused. | SQL schema, data catalog, archive manifest, geospatial layer |
| Analytics and indicator layer | Creates trends, exceedance flags, baselines, indices, risk scores, maps, and public indicators. | Raw observations do not become intelligible environmental evidence. | Indicator workflow, threshold table, anomaly report, risk model note |
| Governance and action layer | Connects monitoring outputs to enforcement, remediation, public reporting, warning, adaptation, and stewardship. | Monitoring generates information without institutional response. | Governance log, response protocol, stewardship action register |
This architecture makes clear that environmental monitoring is not a collection of measurements. It is a multi-layer infrastructure through which environmental conditions become visible, interpretable, and actionable.
Implementation Pattern
A rigorous implementation pattern begins by defining the environmental decision problem, not the device. Public agencies, utilities, researchers, and infrastructure teams should identify which environmental domain is being monitored, which variables are decision-relevant, which spatial and temporal resolutions are required, which standards apply, which populations or ecosystems are exposed, and what institutional action may follow from the findings.
| Artifact | Purpose | Suggested Format |
|---|---|---|
| Environmental monitoring objective manifest | Defines monitoring scope, domains, variables, decision uses, thresholds, and valid-use limits. | YAML, Markdown, architecture decision record |
| Monitoring site inventory | Documents sites, instruments, domains, coordinates, operators, and operational status. | CSV, SQL table, GeoJSON, sensor registry |
| Observation record table | Stores timestamped measurements, variables, units, quality flags, and source identifiers. | CSV, SQL table, Parquet, time-series database |
| Sampling and laboratory method register | Documents sample collection, preservation, analysis methods, detection limits, and laboratory QA/QC. | CSV, PDF archive, laboratory information system export |
| Calibration and device-health log | Tracks instrument calibration, maintenance, battery status, telemetry, replacement, and drift. | CSV, SQL table, device-management platform |
| Threshold and indicator catalog | Defines environmental thresholds, indicators, baselines, exceedance logic, and reporting categories. | YAML, CSV, SQL table |
| Coverage and equity review | Evaluates whether monitoring coverage captures unequal exposure and vulnerable communities. | GeoJSON, CSV, map layer, community review |
| Governance and stewardship log | Documents findings, response actions, responsible institutions, review cycles, and public notes. | CSV, SQL table, public evidence package |
The implementation goal is to make monitoring claims reconstructable. A reader should be able to move from an indicator, exceedance alert, trend report, exposure map, or stewardship recommendation back to the observation record, method, site metadata, calibration history, threshold rule, quality flag, and governance decision that support it.
Research-Grade Framing: Environmental Monitoring as Public Stewardship Infrastructure
A research-grade account of environmental monitoring begins by treating it as public stewardship infrastructure rather than as passive data collection. Environmental monitoring systems do not merely record external conditions. They shape what institutions can know, where risks become visible, which burdens are recognized, and when intervention becomes possible. The credibility of environmental governance depends heavily on the strength, continuity, accessibility, and interpretability of this infrastructure.
This framing matters because environmental degradation often becomes politically and operationally visible only when evidence systems make it visible. A community may experience pollution before it appears in official records. A watershed may deteriorate before public reporting detects the trend. A heat island may harm residents while regional averages remain moderate. An ecosystem may lose resilience before collapse is obvious. Monitoring infrastructure therefore has epistemic and civic significance: it determines what kinds of environmental harm can be documented, compared, contested, and addressed.
Environmental monitoring also requires humility. No monitoring network is complete. Field data may be sparse. Remote-sensing products require validation. Sensors drift. Sampling regimes can miss episodic pollution. Indicators simplify complex environmental dynamics. Public dashboards may conceal uncertainty. A strong monitoring system therefore does not pretend to eliminate uncertainty. It makes uncertainty visible, records data quality, documents gaps, and supports transparent institutional learning.
| Limited Pattern | Stronger Pattern | Why the Shift Matters |
|---|---|---|
| Deploy sensors | Build sustained observing systems with standards, metadata, and governance | Environmental intelligence depends on continuity and comparability. |
| Publish readings | Construct indicators, thresholds, trends, and stewardship evidence | Raw measurements require interpretation before they can guide action. |
| Monitor average conditions | Detect spatial variation, cumulative burden, and unequal exposure | Environmental harm is often unevenly distributed. |
| Use isolated datasets | Integrate air, water, land, climate, pollution, and biodiversity records | Environmental risks interact across domains. |
| Treat monitoring as technical support | Connect monitoring to enforcement, remediation, adaptation, public health, and stewardship | Monitoring matters because it changes what institutions can do. |
The central research question is therefore: how can environmental monitoring infrastructure make environmental change visible early enough, credibly enough, and equitably enough to support better stewardship?
Formal Model: Observation, Baselines, Thresholds, Quality, and Risk
A useful formal model separates observation, baseline, anomaly, threshold, data quality, exposure, vulnerability, and response capacity. Let \(X_{i,t}\) represent an environmental observation at site \(i\) and time \(t\), \(B_i\) a baseline or reference condition, \(A_{i,t}\) an anomaly, \(T_v\) a threshold for variable \(v\), \(Q_{i,t}\) a quality score, \(E_i\) exposure, \(V_i\) vulnerability, and \(G_i\) governance response capacity.
A_{i,t} = X_{i,t} – B_i
\]
Interpretation: An environmental anomaly compares an observed condition with a baseline or reference condition. The baseline must be documented and appropriate for the domain.
I_{i,t} =
\begin{cases}
1, & X_{i,t} \geq T_v \\
0, & X_{i,t} < T_v
\end{cases}
\]
Interpretation: A threshold indicator flags whether an observation exceeds a domain-specific environmental threshold, such as a pollution, temperature, turbidity, nutrient, or water-quality limit.
Q_{\mathrm{record}} =
w_1C +
w_2K +
w_3M +
w_4P +
w_5S
\]
Interpretation: Monitoring record quality can be treated as a composite of completeness \(C\), calibration \(K\), metadata \(M\), provenance \(P\), and sampling design adequacy \(S\).
R_{i,t} = H_{i,t} \times E_i \times V_i \times (1 – G_i)
\]
Interpretation: Environmental risk depends on hazard or stressor intensity \(H\), exposure \(E\), vulnerability \(V\), and the absence or weakness of governance response capacity \(G\).
M_{\mathrm{coverage}} =
\frac{A_{\mathrm{monitored}}}{A_{\mathrm{relevant}}}
\]
Interpretation: Spatial monitoring coverage compares monitored area or population with the area or population relevant to the environmental risk question.
This formal structure protects against a common mistake in environmental monitoring: treating data availability as evidence adequacy. Monitoring infrastructure must evaluate observation quality, coverage, interpretation, exposure, and governance use together.
What Is Infrastructure for Environmental Monitoring Systems?
Infrastructure for environmental monitoring systems refers to the observing, measurement, communications, data, analytical, and institutional architectures through which environmental conditions are tracked over time. These systems may include weather stations, atmospheric observatories, water-quality networks, hydrological gauges, laboratory analysis facilities, biodiversity monitoring systems, satellite platforms, remote-sensing workflows, pollution sampling sites, soil monitoring stations, ecological plots, field instruments, and indicator dashboards tied to public reporting.
What makes these systems infrastructural is not simply the presence of devices. It is the persistence, comparability, quality, interpretability, and institutional usability of the information they generate. A one-time reading may reveal a local condition, but an environmental monitoring system creates the possibility of trend detection, threshold awareness, anomaly recognition, cross-site comparison, spatial exposure assessment, and policy-relevant interpretation.
Environmental monitoring infrastructure is best understood as the modernization and institutionalization of environmental observability. It extends the capacity of states, cities, regulators, utilities, scientists, land managers, public-health agencies, and communities to see changing environmental conditions with enough continuity and credibility to support action. It is therefore an evidentiary infrastructure for environmental stewardship.
Why Environmental Monitoring Must Be Infrastructural
Environmental monitoring must be infrastructural because environmental risk is systemic, cumulative, spatially uneven, and often slow-moving until it becomes acute. Water contamination can spread before users understand its extent. Atmospheric pollutants may produce chronic harm over years even when daily changes seem minor. Climate signals emerge through long records rather than isolated events. Ecological degradation may become visible only after thresholds are crossed. Soil degradation, habitat fragmentation, nutrient loading, chemical contamination, and biodiversity loss may all require sustained observation before their full significance becomes clear.
This matters because environmental conditions underpin health, agriculture, infrastructure planning, water security, biodiversity protection, climate adaptation, pollution control, disaster risk reduction, and resource management. Monitoring is therefore not a narrow technical specialty. It is a precondition for credible governance. Indicators, trend records, comparable baselines, and spatial exposure maps help institutions move from conjecture toward evidence-based diagnosis.
Environmental monitoring is infrastructural in the same sense that transport, water, or digital systems are infrastructural: it creates the conditions under which coordination, diagnosis, accountability, and public action become possible. Without it, environmental governance becomes speculative, uneven, and reactive. With it, institutions can detect change earlier, evaluate interventions, communicate risk, and sustain public stewardship over time.
| Infrastructure Need | Monitoring Function | Failure If Missing |
|---|---|---|
| Sustained observation | Tracks environmental conditions across time and detects trends. | Change is visible only after harm becomes severe. |
| Spatial coverage | Identifies variation across watersheds, neighborhoods, ecosystems, and exposure zones. | Averages hide localized burden and monitoring gaps. |
| Measurement standards | Supports comparability across instruments, sites, laboratories, and time periods. | Data cannot support credible trend or threshold interpretation. |
| Data integration | Links field, laboratory, remote-sensing, and administrative records. | Environmental intelligence remains fragmented by domain and agency. |
| Governance connection | Connects monitoring outputs to stewardship, enforcement, public health, and adaptation. | Monitoring produces data without institutional consequence. |
Environmental monitoring becomes credible when the entire chain from observation to action is treated as public infrastructure.
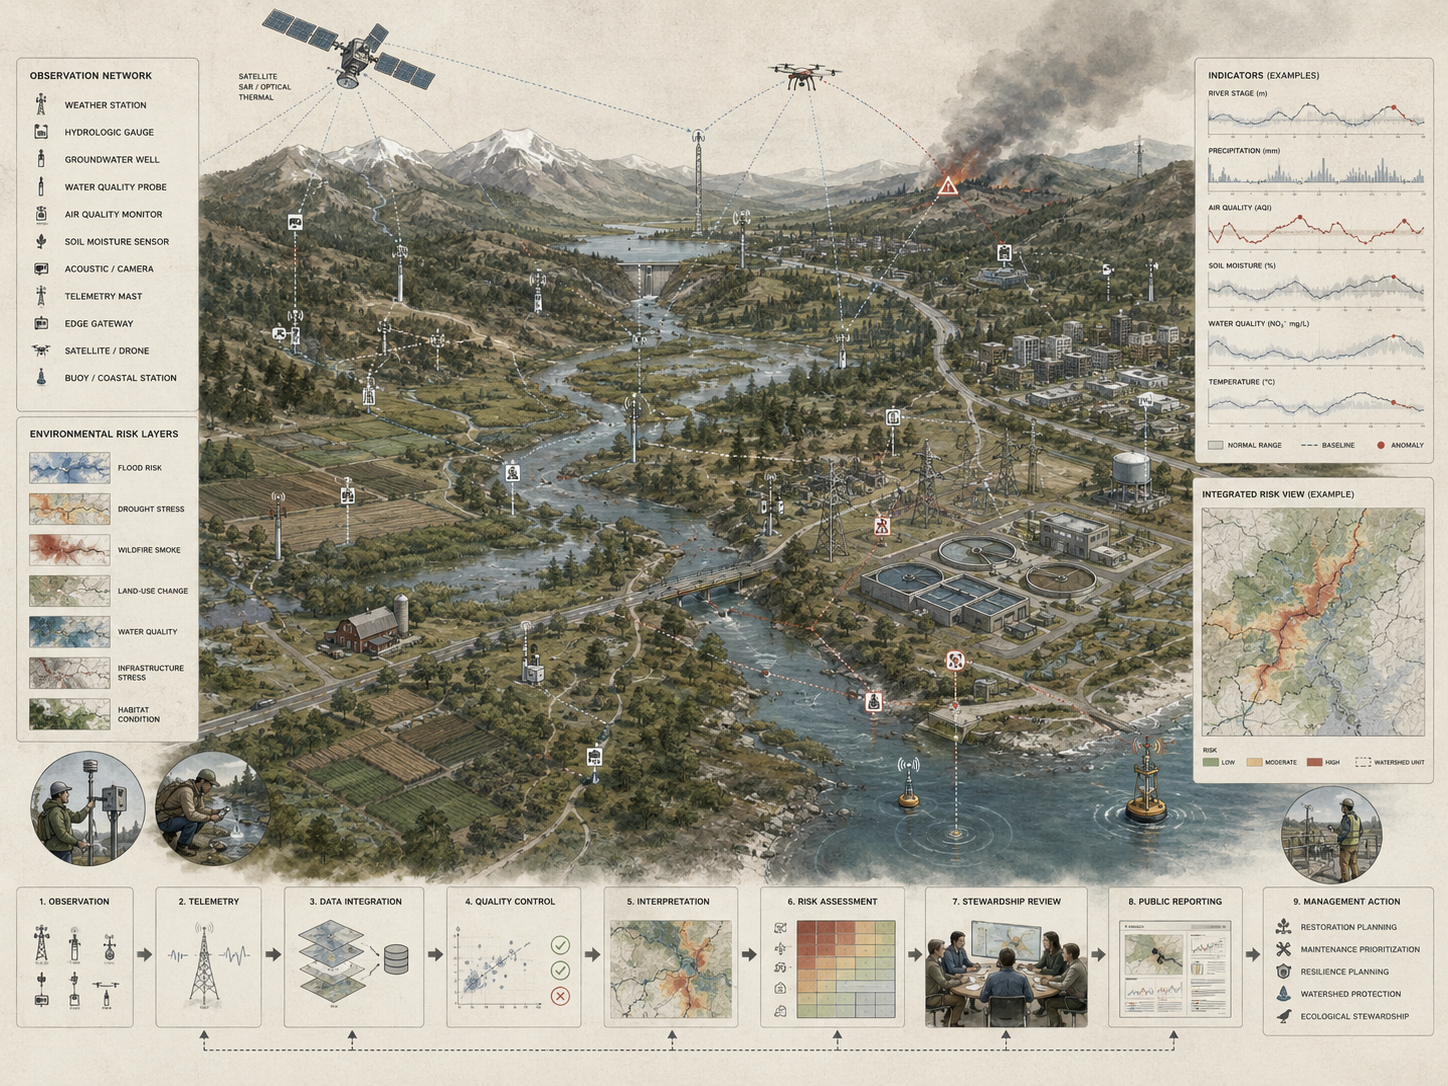
Core Architecture of Environmental Monitoring Systems
Environmental monitoring systems can be understood through a layered architecture that links observation to institutional response. Each layer matters because weaknesses in one part of the monitoring chain can undermine the credibility or usefulness of the whole system.
Observing and Sampling Layer
This layer includes field stations, gauges, air samplers, water-quality probes, laboratory sampling points, ecological plots, buoys, weather stations, soil sensors, camera traps, drones, satellites, and aerial platforms. It is where environmental conditions become measurable. It also includes the sampling designs that determine whether observations are representative, comparable, and relevant to the risk question.
Communications and Transmission Layer
Signals and records must move through telemetry systems, data relays, field reporting systems, digital networks, mobile devices, satellite links, and laboratory reporting workflows so observations can be aggregated across sites and time. Without reliable transmission, monitoring remains local, delayed, and difficult to interpret systemically.
Data Management and Integration Layer
At this layer, environmental measurements are timestamped, quality-checked, standardized, linked to metadata, and integrated into repositories or platforms. This includes databases, archives, geospatial systems, catalogs, APIs, and other structures that turn raw observations into usable records. Continuity and comparability are as important here as the measurements themselves.
Analytics and Indicator Layer
This layer includes trend analysis, threshold detection, anomaly recognition, modeling, indicator construction, forecasting, mapping, and public reporting. It is where environmental observations become intelligible as evidence of status, change, risk, exposure, or stewardship performance.
Decision and Governance Layer
Monitoring becomes infrastructurally meaningful only when it supports action: pollution control, public-health response, early warning, adaptation planning, environmental enforcement, restoration, infrastructure design, or resource-management decisions. This layer connects evidence to authority and accountability.
| Layer | Core Capability | Maturity Question |
|---|---|---|
| Observing and sampling | Field, lab, satellite, sensor, gauge, and ecological measurements | Are the right conditions being observed at the right spatial and temporal resolution? |
| Communications and telemetry | Transmission, field reporting, device status, telemetry, and data relay | Can records move from field or platform to data system reliably? |
| Metadata and quality | Calibration, methods, uncertainty, site context, quality flags, provenance | Can observations be interpreted and compared over time? |
| Data integration | Archives, databases, APIs, geospatial layers, catalogs, interoperability | Can records from multiple domains be linked, audited, and reused? |
| Analytics and indicators | Baselines, anomalies, thresholds, trends, exposure maps, risk scores | Can measurements become meaningful environmental evidence? |
| Governance and response | Public reporting, enforcement, remediation, adaptation, stewardship | Can evidence support responsible action and institutional learning? |
Together these layers show that environmental monitoring systems are socio-technical infrastructures linking observation, interpretation, and public decision-making.
Environmental Domains and Monitoring Applications
Environmental monitoring spans multiple domains, each with distinct observing needs, temporal rhythms, spatial dynamics, data standards, and policy uses. A mature monitoring architecture must support these differences while also enabling cross-domain interpretation.
Atmosphere and Air Quality
Air-quality and atmospheric monitoring may include particulate matter, ozone, nitrogen oxides, sulfur compounds, greenhouse gases, atmospheric chemistry, aerosols, smoke, temperature, humidity, wind, and boundary-layer conditions. This domain often depends on dense spatial coverage in urban areas, regional coordination to understand pollutant transport, and long-duration records to track atmospheric change. It is especially important because atmospheric monitoring links local exposure with broader climate, chemistry, health, and infrastructure-risk systems.
Water Quality and Hydrology
Water monitoring includes chemical, biological, and physical parameters in rivers, lakes, aquifers, wetlands, reservoirs, and coastal zones, alongside flow, level, temperature, turbidity, nutrients, pathogens, dissolved oxygen, salinity, and hydrological conditions. Water systems are shaped by upstream land use, runoff, wastewater discharge, agriculture, infrastructure, seasonal variability, and extreme events. Sustained sampling and long records are critical because water deterioration may not be visible at the point of use until ecological or public-health damage is already underway.
Climate Observation
Climate monitoring requires long-term, standardized observations across atmosphere, land, ocean, cryosphere, hydrology, and carbon-cycle systems. Its purpose is not simply to describe current conditions, but to establish baselines, detect long-duration trends, identify anomalies, and support adaptation and mitigation planning. Climate monitoring is distinguished by the importance of comparability across decades. A system with irregular methods or broken records may remain locally useful while failing to support credible climate assessment.
Land, Ecosystems, and Biodiversity
Land-use change, habitat condition, soil degradation, vegetation dynamics, biodiversity loss, invasive species, wetland function, wildfire risk, and ecosystem stress require monitoring systems that often combine remote sensing with field observation. These systems are particularly important because ecological decline may be spatially widespread and only partially visible through administrative reporting alone. They often require fine-grained local knowledge, field protocols, taxonomic expertise, and large-scale spatial data.
Pollution, Waste, and Resource Use
Waste, chemicals, freshwater condition, coastal contamination, industrial discharge, nutrient loading, plastics, toxic substances, and resource-use efficiency all require monitoring systems capable of linking environmental status with sources, flows, exposure pathways, and policy performance. This domain is especially dependent on institutional coordination because the most important signals often lie at the boundary between environmental condition and production, consumption, disposal, or enforcement systems.
| Domain | Example Variables | Infrastructure Requirement |
|---|---|---|
| Air and atmosphere | PM2.5, ozone, NOx, SOx, greenhouse gases, smoke, aerosols | Air stations, mobile monitors, atmospheric networks, calibration, spatial exposure maps |
| Water and hydrology | Flow, stage, turbidity, nutrients, pathogens, dissolved oxygen, salinity | Gauges, probes, sampling protocols, laboratories, watershed data systems |
| Climate | Temperature, precipitation, soil moisture, sea level, snow, drought indicators | Long-term stations, satellites, archives, baselines, anomaly workflows |
| Land and ecosystems | Land cover, vegetation health, biodiversity, habitat condition, soil degradation | Remote sensing, ecological plots, field surveys, classification systems |
| Pollution and waste | Chemicals, plastics, waste flows, industrial discharge, nutrient loading | Sampling networks, laboratory analysis, source inventories, enforcement data |
The key point is that environmental observability becomes more powerful when it supports cross-domain understanding rather than isolated sectoral reporting. Pollution, climate, water, biodiversity, and ecosystem risks often interact, and the monitoring architecture should reflect that reality.
Data Integration, Indicators, and Environmental Interpretation
Environmental monitoring does not create environmental intelligence automatically. Observations become useful when they can be standardized, compared, linked to baselines, and interpreted in ways that support diagnosis and action. A jurisdiction may possess air-quality readings, climate records, water measurements, ecosystem data, and pollution samples, but without integration these remain partial and difficult to use collectively.
Indicator systems matter because they translate heterogeneous observations into interpretable signals about status, trend, exposure, threshold proximity, and policy relevance. They help institutions move from raw readings to questions such as whether conditions are improving or deteriorating, whether thresholds are being approached, whether vulnerable communities face disproportionate exposure, and whether policy interventions are changing outcomes. Indicators are especially valuable when rooted in long-duration, comparable records rather than one-off measurement campaigns.
Interpretation also matters because environmental data can be noisy, incomplete, uncertain, and scale-dependent. Monitoring becomes valuable not because it produces more numbers, but because it helps institutions distinguish ordinary variability from meaningful change and connect environmental observation to stewardship, planning, enforcement, adaptation, and intervention.
| Data Stage | Function | Governance Value |
|---|---|---|
| Raw observation | Records a measured value at a site, time, and method. | Provides the basic evidentiary unit. |
| Quality-controlled record | Applies flags, calibration checks, range checks, and method review. | Improves credibility and comparability. |
| Integrated dataset | Links observations across sites, domains, methods, and time. | Supports cross-system interpretation. |
| Indicator | Summarizes status, trend, threshold, exposure, or risk. | Supports public reporting and decision-making. |
| Stewardship action | Connects evidence to enforcement, restoration, adaptation, public health, or management. | Turns monitoring into institutional response. |
Environmental monitoring infrastructure should therefore be evaluated by the strength of the interpretive chain, not simply by the existence of data streams.
Risk Detection, Early Warning, and Environmental Change
One of the most important roles of environmental monitoring infrastructure is earlier detection of risk. Environmental deterioration often becomes actionable only when change is visible against a baseline or when emerging anomalies can be identified before they become crises. This includes detecting shifts in atmospheric composition, contamination in inland waters, intensifying heat, altered rainfall patterns, wildfire smoke, harmful algal blooms, soil moisture deficits, ecosystem stress, or cumulative pollutant burden.
This matters because early warning and environmental monitoring overlap but are not identical. Monitoring systems provide the sustained observational record upon which warning systems depend. Forecasts and alerts may be time-sensitive outputs, but they are more credible when grounded in durable observing infrastructure and high-quality records. A jurisdiction that can detect short-run anomalies but lacks long-run baselines may remain operationally alert while still being strategically blind.
Risk detection is therefore not separate from monitoring infrastructure; it is one of its most consequential public functions. A monitoring system that cannot support timely interpretation of change remains scientifically useful, but institutionally incomplete. It may collect data without improving preparedness, stewardship, or protective action.
| Risk Type | Monitoring Signal | Possible Institutional Action |
|---|---|---|
| Air pollution exposure | Elevated particulate matter, ozone, smoke, or industrial pollutants | Public-health advisory, enforcement review, traffic or industrial mitigation |
| Water-quality deterioration | Rising turbidity, nutrients, pathogens, conductivity, or chemical contaminants | Source investigation, treatment response, watershed intervention |
| Climate stress | Temperature anomalies, drought indicators, heat exposure, precipitation shifts | Adaptation planning, cooling strategy, infrastructure design updates |
| Ecosystem degradation | Habitat fragmentation, vegetation stress, biodiversity decline, invasive species | Restoration, conservation targeting, land-use intervention |
| Compound environmental burden | Overlapping pollution, heat, flood, housing, and infrastructure vulnerability | Environmental justice review, targeted investment, public accountability |
Monitoring infrastructure becomes more valuable when it can detect not only single-variable exceedances, but interacting risks across environmental, social, and infrastructure systems.
Governance, Standards, and Institutional Capacity
Environmental monitoring is a governance problem as much as a technical one. Institutions must decide what to measure, where to monitor, how often to sample, which standards to use, how to ensure quality assurance, how to manage access, how to communicate uncertainty, and how to connect results to policy, enforcement, stewardship, or public-health response. These decisions shape what becomes visible and what remains ignored.
Standards matter because environmental observations have limited policy value if they are not comparable across time or space. A station network with inconsistent calibration, irregular sampling, weak metadata, shifting methodologies, or undocumented instrument changes may generate activity without producing durable evidence. The credibility of monitoring depends heavily on standardization, quality control, methodological continuity, and transparent data governance.
Institutional capacity matters just as much. A jurisdiction can procure instruments and still fail to build monitoring capability if laboratories are weak, metadata are poor, staff turnover is high, data governance is fragmented, community trust is low, or no one is empowered to interpret and act on findings. Environmental monitoring systems are therefore not only technical systems. They are institutional systems whose quality depends on governance, skills, coordination, public accountability, and long-term maintenance.
| Capability | Purpose | Evidence Artifact |
|---|---|---|
| Monitoring mandate | Defines the environmental domains, public purposes, and decision uses of monitoring. | Governance charter, monitoring objective manifest |
| Standards and QA/QC | Ensures methods, calibration, sampling, and quality flags are comparable. | Quality-control protocol, calibration log, sampling method register |
| Data stewardship | Preserves records, metadata, access, versions, and provenance. | Archive manifest, SQL schema, data catalog, retention policy |
| Public reporting | Communicates indicators, uncertainty, thresholds, and limitations. | Public evidence package, dashboard metadata, reporting schedule |
| Response authority | Connects findings to enforcement, remediation, warnings, or stewardship actions. | Response protocol, governance log, stewardship action register |
| Community accountability | Ensures monitoring addresses exposure, trust, participation, and unequal burden. | Community monitoring review, exposure equity map, public feedback record |
The governance question is whether environmental monitoring can remain credible, comparable, accessible, and consequential across the time horizons that environmental stewardship requires.
Exposure, Pollution, and Uneven Environmental Burden
Environmental monitoring also matters because environmental burden is distributed unevenly. Pollution exposure, water contamination, heat stress, flood risk, ecosystem degradation, toxic releases, waste siting, and poor infrastructure often affect some populations more than others. Spatially coarse averages can conceal these differences, especially in cities and regions where industrial activity, traffic, poor housing, limited services, and historical disinvestment overlap.
This matters because monitoring infrastructure can change what institutions are able to see about unequal exposure. Better monitoring can reveal where pollution loads are concentrated, where water quality is weakest, where heat exposure is most severe, where flood risk intersects with poor drainage, and where environmental deterioration overlaps with social vulnerability. Without this visibility, environmental governance can remain formally comprehensive while substantively blind to unequal burden.
Environmental monitoring infrastructure should therefore be judged not only by technical sophistication, but by whether it improves visibility into who is exposed, which ecosystems are degrading, and where public action is most urgently needed. Equity is not an optional reporting layer. It is part of the monitoring system’s public purpose.
| Equity Question | Monitoring Requirement | Failure Mode |
|---|---|---|
| Who is exposed? | Link environmental observations to population, land use, infrastructure, and vulnerability data. | Monitoring detects environmental stress but not who bears the burden. |
| Where are monitoring gaps? | Map site coverage against vulnerable communities and environmental risk zones. | High-burden areas remain under-monitored. |
| Are averages hiding extremes? | Use spatially resolved data and local monitoring where possible. | Regional indicators conceal neighborhood-scale exposure. |
| Can communities interpret and contest findings? | Provide accessible public reporting, metadata, methods, and feedback pathways. | Monitoring remains expert-controlled and publicly opaque. |
| Does monitoring lead to action? | Connect exposure findings to enforcement, remediation, public health, or investment. | Unequal burden is documented but not addressed. |
A monitoring system that cannot reveal unequal burden cannot fully support environmental stewardship.
Measurement Quality, Coverage, and Monitoring Performance
Measurement matters because environmental monitoring systems need ways to assess their own adequacy. Relevant indicators may include spatial coverage, temporal continuity, calibration quality, data completeness, interoperability, timeliness, metadata completeness, threshold relevance, indicator usability, public accessibility, and the capacity of systems to support analysis, forecasting, enforcement, stewardship, and public reporting.
But monitoring quality cannot be reduced to the number of stations or datasets alone. A system may collect large amounts of information yet remain weak in quality assurance, interpretation, coverage equity, or policy uptake. Coverage without comparability is limited. Data without institutional use are incomplete. Timely readings without standards may support awareness but not durable evidence. The performance of a monitoring system therefore depends not only on observational density, but on whether observations are credible, sustained, comparable, accessible, and actionable.
Indicators are most useful when they help institutions learn where environmental observability is strong, where gaps remain, and how monitoring can be improved to support stewardship under changing conditions.
| Metric Type | Example Measure | Interpretive Caution |
|---|---|---|
| Coverage | Share of relevant geography, population, watershed, or habitat covered by monitoring | Coverage may not align with highest exposure or vulnerability. |
| Continuity | Record length, missingness, sampling frequency, and station uptime | Short or broken records may not support trend interpretation. |
| Quality assurance | Calibration status, method documentation, quality flags, laboratory QA/QC | Unflagged data can produce false confidence. |
| Interoperability | Use of shared units, metadata, identifiers, APIs, and geospatial references | Non-interoperable data remain difficult to integrate across domains. |
| Indicator relevance | Alignment between indicators, thresholds, public-health needs, ecological conditions, and policy questions | Indicators may be technically valid but institutionally unused. |
| Governance uptake | Evidence of response actions, public reporting, enforcement, adaptation, or restoration | Monitoring may generate data without changing outcomes. |
Good monitoring performance measures the health of the entire monitoring-action chain, not only the abundance of measurements.
Deployment Readiness Gate
Before environmental monitoring systems are used for public reporting, regulatory enforcement, stewardship planning, early warning, exposure analysis, infrastructure-risk assessment, or environmental justice review, they should pass a readiness gate. The purpose is not to delay monitoring. It is to confirm that monitoring outputs are supported by documented methods, credible measurements, usable metadata, and a pathway to interpretation and action.
| Readiness Check | Pass Condition | Evidence |
|---|---|---|
| Monitoring purpose | Domains, variables, indicators, thresholds, and decision uses are defined. | Monitoring objective manifest, indicator catalog |
| Site and platform inventory | Monitoring sites, instruments, coordinates, operators, and status are documented. | Site inventory, GeoJSON layer, sensor register |
| Sampling and measurement methods | Sampling design, laboratory methods, sensor methods, detection limits, and units are documented. | Sampling protocol, laboratory method register, device metadata |
| Quality assurance | Calibration, quality flags, range checks, field blanks, laboratory QA/QC, and uncertainty are tracked. | Calibration log, quality-control schema, QA/QC report |
| Data integration | Records are standardized, timestamped, versioned, georeferenced, and linked to metadata. | SQL schema, archive manifest, data catalog |
| Coverage and equity | Monitoring coverage is reviewed against exposure, vulnerability, and environmental burden. | Coverage map, exposure equity review, community feedback |
| Interpretation and thresholds | Indicators, baselines, thresholds, caveats, and valid-use limits are documented. | Indicator catalog, threshold policy, public evidence package |
| Governance and response | Responsible institutions, review cycles, reporting duties, and action pathways are defined. | Governance log, stewardship action register, response protocol |
A monitoring system that cannot pass this readiness gate may still produce useful data, but its outputs should be treated cautiously when used for public claims, enforcement, or long-term stewardship decisions.
Data and Configuration Artifacts
The companion repository can use a data-first structure so environmental monitoring claims can be examined rather than merely asserted. Each artifact has a specific role in making the monitoring-action chain reconstructable across field observations, sensors, laboratory methods, remote sensing, quality assurance, thresholds, indicators, governance, and public evidence.
| Artifact | File | Purpose |
|---|---|---|
| Environmental monitoring objective manifest | config/environmental_monitoring_objective.yml |
Defines domains, variables, use cases, valid-use limits, and public evidence requirements. |
| Monitoring site inventory | data/monitoring_site_inventory.csv |
Tracks sites, instruments, domains, coordinates, operators, and operational status. |
| Environmental observations sample | data/environmental_observations_sample.csv |
Stores timestamped observations with variable, unit, site, value, and quality flag. |
| Threshold and indicator catalog | data/environmental_threshold_indicator_catalog.csv |
Documents thresholds, indicators, domain categories, and interpretation rules. |
| Calibration and device-health log | data/calibration_device_health_log.csv |
Tracks calibration, telemetry status, battery status, sensor drift, and maintenance needs. |
| Coverage and equity review | data/coverage_equity_review.csv |
Evaluates whether monitoring coverage captures exposure, vulnerability, and burden. |
| Governance and stewardship log | data/environmental_governance_log.csv |
Documents findings, response actions, responsible institutions, and public reporting needs. |
| SQL schema | sql/schema.sql |
Creates a local SQLite database for environmental monitoring records and metadata. |
These artifacts are designed to make environmental monitoring auditable. They can be replaced with institutional data sources later, but the scaffold makes the logic of monitoring, interpretation, and stewardship explicit from the beginning.
Mathematical Lens: Monitoring Quality and Environmental Risk
A lightweight mathematical lens helps distinguish measurement from monitoring adequacy. The point is not to reduce environmental systems to a single score, but to make visible the relationships among observation, baseline, exceedance, quality, coverage, exposure, and governance response.
A_{i,t} = X_{i,t} – B_i
\]
Interpretation: An anomaly compares an environmental observation with a reference condition. This is useful for detecting departures from normal conditions.
I_{i,t} =
\begin{cases}
1, & X_{i,t} \geq T_v \\
0, & X_{i,t} < T_v
\end{cases}
\]
Interpretation: A threshold indicator marks whether an observation exceeds a relevant environmental standard, trigger, or management threshold.
Q_{\mathrm{monitoring}} =
w_1C +
w_2K +
w_3M +
w_4P +
w_5S
\]
Interpretation: Monitoring quality depends on completeness \(C\), calibration \(K\), metadata \(M\), provenance \(P\), and sampling adequacy \(S\).
R_{i,t} = H_{i,t} \times E_i \times V_i \times (1 – G_i)
\]
Interpretation: Environmental risk remains high when hazard intensity, exposure, and vulnerability are high and governance response capacity is weak.
This mathematical framing should be used as a diagnostic tool, not as a substitute for environmental science, field validation, community knowledge, or regulatory judgment.
Python Workflow: Environmental Indicator and Risk Review
The Python workflow in the companion repository can read monitoring-site metadata, observation records, threshold definitions, calibration logs, and coverage reviews; compute exceedance flags, record completeness, monitoring quality, and risk-review flags; and export stewardship watchlists for institutional review. The sample below illustrates the core logic.
from pathlib import Path
import pandas as pd

ARTICLE_DIR = Path("articles/infrastructure-for-environmental-monitoring-systems-observation-risk-and-stewardship")
DATA_DIR = ARTICLE_DIR / "data"
OUTPUT_DIR = ARTICLE_DIR / "outputs"
OUTPUT_DIR.mkdir(parents=True, exist_ok=True)

sites = pd.read_csv(DATA_DIR / "monitoring_site_inventory.csv")
observations = pd.read_csv(DATA_DIR / "environmental_observations_sample.csv", parse_dates=["timestamp"])
thresholds = pd.read_csv(DATA_DIR / "environmental_threshold_indicator_catalog.csv")
calibration = pd.read_csv(DATA_DIR / "calibration_device_health_log.csv")
coverage = pd.read_csv(DATA_DIR / "coverage_equity_review.csv")

review = (
    observations
    .merge(sites, on="site_id", how="left")
    .merge(thresholds, on=["domain", "variable"], how="left")
    .merge(calibration, on="site_id", how="left")
    .merge(coverage, on="monitoring_zone_id", how="left")
)

review["threshold_exceeded"] = review["value"] >= review["threshold_value"]

record_counts = (
    review
    .groupby(["site_id", "variable"])
    .agg(
        observed_count=("value", "count"),
        flagged_count=("threshold_exceeded", "sum")
    )
    .reset_index()
)

expected_count = review["timestamp"].nunique()

record_counts["record_completeness"] = (
    record_counts["observed_count"] / max(expected_count, 1)
)

review = review.merge(record_counts, on=["site_id", "variable"], how="left")

review["monitoring_quality_score"] = (
    0.25 * review["record_completeness"] +
    0.20 * review["calibration_score"] +
    0.20 * review["metadata_score"] +
    0.20 * review["provenance_score"] +
    0.15 * review["sampling_design_score"]
)

review["environmental_risk_score"] = (
    review["hazard_intensity"] *
    review["exposure_score"] *
    review["vulnerability_score"] *
    (1 - review["governance_response_score"])
)

review["stewardship_review_flag"] = (
    (review["threshold_exceeded"]) |
    (review["monitoring_quality_score"] < 0.75) |
    (review["coverage_gap_score"] >= 0.35) |
    (review["environmental_risk_score"] >= 0.25)
)

review.to_csv(OUTPUT_DIR / "environmental_monitoring_indicator_review.csv", index=False)

watchlist = (
    review[review["stewardship_review_flag"]]
    .sort_values(["environmental_risk_score", "monitoring_quality_score"], ascending=[False, True])
)

watchlist.to_csv(OUTPUT_DIR / "environmental_stewardship_watchlist.csv", index=False)

print(watchlist[[
    "site_id",
    "site_name",
    "domain",
    "variable",
    "value",
    "threshold_value",
    "environmental_risk_score",
    "monitoring_quality_score"
]])
This workflow is intentionally transparent. It allows analysts to see whether environmental concern arises from threshold exceedance, weak monitoring quality, coverage gaps, exposure, vulnerability, or weak governance response.
R Workflow: Monitoring Coverage, Thresholds, and Stewardship Reporting
The R workflow can summarize monitoring coverage by domain, identify threshold exceedances, evaluate quality gaps, and create stewardship-oriented reports for public agencies, researchers, and infrastructure planners.
library(readr)
library(dplyr)

article_dir <- "articles/infrastructure-for-environmental-monitoring-systems-observation-risk-and-stewardship"
data_dir <- file.path(article_dir, "data")
output_dir <- file.path(article_dir, "outputs")
dir.create(output_dir, recursive = TRUE, showWarnings = FALSE)

sites <- read_csv(file.path(data_dir, "monitoring_site_inventory.csv"), show_col_types = FALSE)
observations <- read_csv(file.path(data_dir, "environmental_observations_sample.csv"), show_col_types = FALSE)
thresholds <- read_csv(file.path(data_dir, "environmental_threshold_indicator_catalog.csv"), show_col_types = FALSE)
calibration <- read_csv(file.path(data_dir, "calibration_device_health_log.csv"), show_col_types = FALSE)
coverage <- read_csv(file.path(data_dir, "coverage_equity_review.csv"), show_col_types = FALSE)

review <- observations %>%
  left_join(sites, by = "site_id") %>%
  left_join(thresholds, by = c("domain", "variable")) %>%
  left_join(calibration, by = "site_id") %>%
  left_join(coverage, by = "monitoring_zone_id") %>%
  mutate(
    threshold_exceeded = value >= threshold_value,
    monitoring_quality_score =
      0.25 * record_completeness +
      0.20 * calibration_score +
      0.20 * metadata_score +
      0.20 * provenance_score +
      0.15 * sampling_design_score,
    environmental_risk_score =
      hazard_intensity *
      exposure_score *
      vulnerability_score *
      (1 - governance_response_score),
    stewardship_review_flag =
      threshold_exceeded |
      monitoring_quality_score < 0.75 |
      coverage_gap_score >= 0.35 |
      environmental_risk_score >= 0.25
  )

domain_summary <- review %>%
  group_by(domain) %>%
  summarise(
    sites = n_distinct(site_id),
    observations = n(),
    threshold_exceedances = sum(threshold_exceeded, na.rm = TRUE),
    mean_monitoring_quality = mean(monitoring_quality_score, na.rm = TRUE),
    mean_environmental_risk = mean(environmental_risk_score, na.rm = TRUE),
    review_flags = sum(stewardship_review_flag, na.rm = TRUE),
    .groups = "drop"
  ) %>%
  arrange(desc(mean_environmental_risk))

write_csv(review, file.path(output_dir, "environmental_monitoring_review_report.csv"))
write_csv(domain_summary, file.path(output_dir, "environmental_monitoring_domain_summary.csv"))

print(domain_summary)
The purpose is not to produce a definitive environmental assessment. It is to demonstrate how monitoring records, thresholds, quality scores, coverage gaps, and stewardship review flags can be made reproducible and auditable.
Systems Code: Sensor Networks, Field Data, and Monitoring Infrastructure
The companion repository can extend the article into a reproducible systems scaffold. Python and R support analytical review; SQL stores evidence; YAML files define objectives and quality policies; GeoJSON provides spatial placeholders; TypeScript can support dashboard interfaces; Go can support monitoring-status services; Rust can support strict record validation; C can support embedded measurement checks; Fortran can support numerical indicator calculations; MicroPython can support edge observing nodes; PYNQ and HDL can support hardware-assisted stream validation where appropriate.
| Directory | Role | Example Use |
|---|---|---|
python/ |
Indicator review, threshold checks, quality scoring, stewardship watchlists | Compute environmental risk and monitoring quality scores |
r/ |
Domain summaries, monitoring coverage reports, threshold reporting | Summarize monitoring performance by domain or zone |
sql/ |
Evidence tables and auditable queries | Join sites, observations, thresholds, calibration, coverage, and governance records |
c/ and embedded_c/ |
Sensor-quality checks and embedded monitoring logic | Validate field readings, ranges, battery, and calibration status |
rust/ |
Strict validation and CLI scaffolding | Validate environmental observation records and quality-score bounds |
go/ |
Monitoring-status service scaffold | Expose device, site, or environmental indicator status over a lightweight API |
fortran/ |
Numerical environmental calculations | Prototype anomaly, threshold, or risk-index calculations |
micropython/ |
Edge observing-node scaffold | Prototype low-power air, water, soil, or climate telemetry |
pynq/ and hdl/ |
Hardware-assisted stream validation | Prototype FPGA checks for sensor ranges, threshold flags, and missingness |
typescript/ |
Dashboard/interface scaffold | Display monitoring coverage, exceedances, quality flags, and stewardship actions |
The code should be understood as an engineering scaffold for reproducible environmental monitoring workflows, not as a replacement for certified monitoring networks, regulatory methods, or official environmental assessment systems.
GitHub Repository
The companion repository can house the reproducible data, code, schemas, validation tools, and systems-engineering examples that support this article’s environmental monitoring framework.
Testing and Validation
Testing environmental monitoring infrastructure requires more than checking whether sensors transmit data or whether dashboards load. Validation should examine whether observations are representative, calibrated, quality-flagged, comparable, integrated, interpretable, and connected to stewardship. It should also assess whether monitoring coverage captures environmental risk where exposure and vulnerability are greatest.
| Validation Area | Test Question | Failure Signal |
|---|---|---|
| Site and platform inventory | Are sites, instruments, locations, owners, domains, and operational status documented? | Observations appear without clear monitoring context. |
| Sampling design | Does the sampling design match the environmental question, spatial scale, and time scale? | Data are collected but do not represent the risk being assessed. |
| Calibration and QA/QC | Are calibration, range checks, quality flags, laboratory methods, and uncertainty documented? | Measurements cannot support reliable comparison or enforcement. |
| Data integration | Are observations standardized, georeferenced, versioned, and linked to metadata? | Records remain fragmented and difficult to audit. |
| Threshold and indicator validity | Are thresholds, baselines, indicators, and interpretation rules documented? | Dashboards display signals without decision meaning. |
| Coverage and equity | Does monitoring capture exposed, vulnerable, and high-burden areas? | Monitoring appears comprehensive while missing the places most at risk. |
| Governance response | Are findings connected to public reporting, enforcement, remediation, or stewardship? | Monitoring detects concerns but produces no institutional action. |
Validation should be repeated after sensor replacements, laboratory method changes, sampling redesign, new remote-sensing products, archive migrations, threshold updates, and major environmental events.
Operational Signals and Environmental Monitoring Observability
Environmental monitoring observability means being able to see whether the monitoring system itself is functioning as trustworthy infrastructure. This includes sensor uptime, sample completeness, telemetry delay, calibration status, laboratory turnaround time, quality flags, missingness, metadata completeness, archive status, public-reporting updates, and stewardship response tracking.
| Signal | What It Reveals | Operational Use |
|---|---|---|
| Sensor uptime and telemetry latency | Whether monitoring devices are producing timely and continuous records | Maintenance scheduling and network reliability review |
| Sampling completion rate | Whether planned samples or observations are being collected | Field operations review and record completeness assessment |
| Calibration status | Whether instruments remain within accepted measurement standards | Instrument maintenance and quality assurance |
| Quality-flag distribution | Whether records contain unusual levels of suspect, missing, or failed values | QA/QC investigation and method review |
| Coverage gap score | Whether monitoring misses relevant geography, populations, ecosystems, or exposure zones | Network expansion and equity review |
| Threshold exceedance frequency | Whether environmental conditions are crossing management or regulatory thresholds | Public reporting, enforcement, remediation, or warning review |
| Stewardship action closure | Whether monitoring findings lead to response and follow-through | Governance accountability and institutional learning |
Environmental monitoring observability is strongest when the system can monitor not only environmental conditions, but also the health and credibility of its own observing, data, and governance chains.
Engineer and Researcher Checklist
- Define the environmental domains, variables, indicators, thresholds, and decision uses the monitoring system must support.
- Document sites, platforms, instruments, coordinates, operators, methods, and operational status.
- Preserve sampling protocols, laboratory methods, calibration logs, detection limits, and quality-control records.
- Measure missingness, temporal continuity, spatial coverage, metadata completeness, and record quality.
- Use thresholds and indicators that are documented, domain-appropriate, and connected to public or ecological meaning.
- Integrate field, laboratory, remote-sensing, sensor, and administrative data through shared identifiers and metadata.
- Review monitoring coverage against exposure, vulnerability, environmental burden, and community concerns.
- Distinguish raw observations, quality-controlled records, indicators, forecasts, and public claims.
- Connect monitoring outputs to stewardship, enforcement, remediation, adaptation, public-health response, or public reporting.
- Publish evidence packages that explain methods, gaps, uncertainty, thresholds, governance owners, and review cycles.
This checklist is intentionally practical. It keeps environmental monitoring focused on durable stewardship rather than data accumulation alone.
Where This Fits in the Series
Infrastructure for environmental monitoring systems connects several major threads within the Intelligent Infrastructure Systems knowledge series. It relies on digital infrastructure to transmit and store environmental records, data platforms to integrate and interpret measurements, intelligent water systems to monitor hydrology and water quality, urban sensor networks to observe localized exposure, climate monitoring to establish long-term baselines, and risk and resilience frameworks to translate environmental signals into governance action.
This article therefore functions as a bridge between environmental science and infrastructure intelligence. It shows that intelligent infrastructure is not only about automation, optimization, or control. It is also about preserving the observational foundations that allow societies to detect environmental change, recognize unequal burden, and act responsibly under uncertainty.
Related Articles
- Environmental Monitoring Systems
- Urban Sensor Networks and Infrastructure Monitoring
- Infrastructure Data Platforms and Analytics
- Digital Infrastructure Systems
- Smart City Infrastructure Systems
- Intelligent Water Infrastructure Systems
- Infrastructure Systems for Urban Resilience
- Climate Monitoring Infrastructure
- Flood and Disaster Early Warning Infrastructure
- Infrastructure Governance and Policy Systems
These connections are substantive rather than decorative. Environmental monitoring is not an isolated scientific niche, but a systems domain connecting observation, risk, stewardship, and public governance.
Future Directions
The future of environmental monitoring infrastructure will likely involve denser integration of remote sensing and in situ observations, stronger digital platforms for environmental intelligence, improved gap-filling through new technologies, wider use of monitoring systems in climate adaptation, expanded low-cost sensor networks, stronger community monitoring, better open-data systems, more advanced geospatial analysis, and tighter linkage between monitoring and public stewardship.
New digital and remote-sensing pathways may help close chronic monitoring deficits, but only if they are connected to durable standards, local capacity, credible interpretation, and institutional accountability. A larger volume of environmental data will not automatically produce better stewardship. The deeper challenge is building monitoring systems that remain credible, comparable, inclusive, and institutionally useful over time.
Infrastructure for environmental monitoring will matter most where it improves stewardship, early warning, accountability, exposure visibility, and the capacity to act under uncertainty rather than merely expanding the volume of observation. The long-run goal is not observation for its own sake. It is an environmental intelligence system capable of detecting change, interpreting risk, and supporting better collective decisions as pressures intensify.
Further Reading
- World Meteorological Organization (WMO) (n.d.) Global Observing System. Available at: https://wmo.int/site/knowledge-hub/programmes-and-initiatives/global-observing-system-gos.
- World Meteorological Organization (WMO) (n.d.) WMO Integrated Global Observing System. Available at: https://wmo.int/site/knowledge-hub/programmes-and-initiatives/wmo-integrated-global-observing-system-wigos.
- World Meteorological Organization (WMO) (n.d.) Global Climate Observing System. Available at: https://wmo.int/site/knowledge-hub/programmes-and-initiatives/global-climate-observing-system-gcos-0.
- United Nations Environment Programme (UNEP) (n.d.) GEMS/Water. Available at: https://www.unep.org/topics/environment-under-review/gemswater.
- United Nations Environment Programme (UNEP) (n.d.) Monitoring water quality. Available at: https://www.unep.org/topics/fresh-water/water-quality/monitoring-water-quality.
- United Nations Environment Programme (UNEP) (n.d.) SDG 6.3.2 indicator. Available at: https://www.unep.org/topics/fresh-water/water-quality/monitoring-water-quality/sdg-632-indicator.
- European Environment Agency (EEA) (n.d.) Indicators. Available at: https://www.eea.europa.eu/en/analysis/indicators.
- World Bank (2025) Water Data Revolution: Closing the Data Gap through Remote Sensing. Available at: https://openknowledge.worldbank.org/entities/publication/3b2c6f01-9d3f-462f-98be-cdfbf21185af.
References
- European Environment Agency (EEA) (n.d.) Indicators. Available at: https://www.eea.europa.eu/en/analysis/indicators.
- United Nations Environment Programme (UNEP) (n.d.) GEMS/Water. Available at: https://www.unep.org/topics/environment-under-review/gemswater.
- United Nations Environment Programme (UNEP) (n.d.) Monitoring water quality. Available at: https://www.unep.org/topics/fresh-water/water-quality/monitoring-water-quality.
- United Nations Environment Programme (UNEP) (n.d.) SDG 6.3.2 indicator. Available at: https://www.unep.org/topics/fresh-water/water-quality/monitoring-water-quality/sdg-632-indicator.
- World Bank (2025) Water Data Revolution: Closing the Data Gap through Remote Sensing. Washington, DC: World Bank. Available at: https://openknowledge.worldbank.org/entities/publication/3b2c6f01-9d3f-462f-98be-cdfbf21185af.
- World Bank (2022) Remote sensing technology helps close the transboundary water data gap in Africa. Available at: https://blogs.worldbank.org/en/water/remote-sensing-technology-helps-close-transboundary-water-data-gap-africa.
- World Meteorological Organization (WMO) (n.d.) Global Observing System. Available at: https://wmo.int/site/knowledge-hub/programmes-and-initiatives/global-observing-system-gos.
- World Meteorological Organization (WMO) (n.d.) WMO Integrated Global Observing System. Available at: https://wmo.int/site/knowledge-hub/programmes-and-initiatives/wmo-integrated-global-observing-system-wigos.
- World Meteorological Organization (WMO) (n.d.) Global Climate Observing System. Available at: https://wmo.int/site/knowledge-hub/programmes-and-initiatives/global-climate-observing-system-gcos-0.
- Global Climate Observing System (GCOS) (n.d.) About GCOS. Available at: https://gcos.wmo.int/site/global-climate-observing-system-gcos/about-gcos.