
Last Updated May 14, 2026
Infrastructure data platforms and analytics are the systems through which distributed infrastructure data is collected, integrated, stored, governed, interpreted, and transformed into operational, strategic, and resilience-relevant knowledge. They sit between the sensing and communication layers of intelligent infrastructure and the decisions, controls, inspections, investments, emergency responses, and institutional judgments that depend on reliable situational awareness. In practical terms, they turn fragmented telemetry, logs, asset records, geospatial evidence, inspection data, maintenance histories, environmental observations, and contextual signals into structured visibility across infrastructure systems.
As infrastructure becomes more instrumented, the central challenge is no longer merely whether data can be collected. The deeper question is whether distributed measurements can be transformed into coherent, trustworthy, traceable, secure, and decision-relevant system intelligence. Sensors, cameras, meters, supervisory systems, mobile devices, inspection workflows, enterprise tools, and operational technology environments generate large volumes of signals, but raw data alone does not create operational understanding. That requires platforms capable of integrating heterogeneous sources, aligning them across time and assets, preserving context, supporting analytical interpretation, and making outputs usable for operators, planners, engineers, regulators, public agencies, and infrastructure institutions.
This article develops Infrastructure Data Platforms and Analytics: Integration, Visibility and Resilience as an advanced article within the Intelligent Infrastructure Systems knowledge series. It examines infrastructure data platforms not as generic databases or dashboards, but as public-interest analytical infrastructure: the connective layer that allows telemetry, asset registries, geospatial context, operational logs, cyber-physical events, risk indicators, digital twins, decision records, and governance workflows to become usable evidence. Selected Python and R examples appear here, while the companion GitHub repository can support reproducible workflows for infrastructure data inventories, telemetry integration, metadata scoring, data-quality review, SQL-backed evidence archives, analytical observability, lineage tracking, governance registers, and multi-language systems-engineering scaffolds.
Main Library
Publications
Article Map
Intelligent Infrastructure
Related Article Map
Data Systems
Related Article Map
Risk & Resilience
Related Article Map
AI Systems
Infrastructure data platforms are therefore more than databases, dashboards, data lakes, or integration tools. They are coordination layers through which telemetry becomes legible, asset conditions become comparable, events become traceable, and analytics become actionable. In energy systems, water systems, transport networks, buildings, environmental monitoring, public works, and cyber-physical infrastructure, sensing and measurement become operationally valuable only when they are linked to communications, analytical workflows, contextual data, decision processes, governance rules, and response authority. A platform is not mature because it stores more data; it is mature when it helps institutions know what is happening, why it matters, what uncertainty remains, and what action is justified.
For that reason, infrastructure data platforms and analytics are central to intelligent infrastructure more broadly. They determine whether digital and cyber-physical systems remain fragmented collections of devices or become governable infrastructures capable of diagnosis, forecasting, resilience planning, intervention, and institutional learning. Where these platforms are weak, data remains siloed, context is lost, trust erodes, and operational intelligence becomes inconsistent. Where they are strong, infrastructure becomes more interpretable, more comparable across subsystems, more resilient under stress, and more accountable to the public purposes it serves.
Engineering Problem
The engineering problem is how to transform heterogeneous, distributed, time-sensitive, security-sensitive, and institutionally fragmented infrastructure data into reliable operational intelligence. Infrastructure systems generate evidence from many layers at once: sensors, meters, SCADA systems, industrial control platforms, maintenance records, inspections, geospatial systems, asset registries, environmental feeds, customer reports, work orders, outage logs, cybersecurity events, weather data, mobility flows, laboratory results, and public reporting systems. Each source can be useful on its own, but infrastructure decisions require relationships among them.
This is difficult because infrastructure data is rarely clean, complete, standardised, or centrally governed. Readings may arrive late. Units may differ across vendors. Asset names may not match across systems. Timestamps may not align. Historical records may be incomplete. Data may be owned by different departments or institutions. Operational technology may use legacy protocols. Geospatial records may be inaccurate. Cybersecurity restrictions may limit access. Regulatory reporting may require one data format while engineering teams need another. The result is that infrastructure institutions often possess large amounts of data without possessing coherent system knowledge.
A strong infrastructure data platform must therefore solve more than storage. It must solve ingestion, identity, context, lineage, governance, security, interoperability, analytical validity, and operational actionability. The platform must preserve the meaning of measurements: what asset produced the signal, where it is located, what unit was used, what timestamp applies, what quality flag is attached, what threshold matters, which decision uses are valid, what uncertainty remains, and who is responsible for acting. Without that structure, analytics can become visually persuasive but operationally weak.
| Engineering Tension | Why It Matters | Required Evidence |
|---|---|---|
| Data volume versus data meaning | Large-scale telemetry does not create intelligence unless measurements are contextualized by asset, location, time, unit, threshold, and decision use. | Metadata catalog, asset registry, schema dictionary, unit registry, entity-resolution rules |
| Integration versus fragmentation | Infrastructure data often sits in vendor platforms, departmental tools, OT systems, GIS layers, spreadsheets, and regulatory archives. | Ingestion map, system inventory, API register, integration pipeline, standards matrix |
| Analytics versus operational trust | Models and dashboards can mislead if inputs are delayed, incomplete, biased, uncalibrated, or detached from field evidence. | Data-quality score, latency log, calibration status, lineage record, model card |
| Visibility versus security | Infrastructure platforms concentrate sensitive operational knowledge and can create new exposure if poorly secured. | Access-control policy, segmentation review, logging, security architecture, incident-response plan |
| Real-time use versus long-term stewardship | Operational systems need timely data, while planning, resilience, compliance, and accountability require durable historical records. | Retention policy, archival strategy, historian export, SQL evidence archive, governance register |
| Insight versus action | Analytics creates value only when it changes inspection, maintenance, dispatch, emergency response, investment, policy, or public communication. | Action log, work-order link, response closure, decision record, public evidence package |
The practical question is therefore: can the platform convert distributed data into evidence that is traceable enough to trust, integrated enough to interpret, secure enough to govern, and actionable enough to improve infrastructure performance and resilience?
Reference Architecture
A practical reference architecture for infrastructure data platforms links sensing and operational systems to ingestion, normalization, storage, metadata, analytics, governance, security, operational workflows, and public accountability. The architecture should not begin with a dashboard. It should begin with the infrastructure responsibilities the platform is meant to support: reliable service, asset stewardship, safety, quality, resilience, cyber-physical visibility, environmental accountability, maintenance prioritization, emergency response, capital planning, and public reporting.
| Layer | Engineering Role | Primary Risk | Evidence Artifact |
|---|---|---|---|
| Platform objective layer | Defines service goals, decision uses, valid-use limits, governance responsibilities, resilience aims, and public reporting requirements. | The platform accumulates data without a clear operational or institutional purpose. | Platform objective manifest, decision-use register, governance charter |
| Source-system layer | Documents sensors, SCADA systems, meters, historians, GIS tools, asset systems, work orders, inspections, logs, external feeds, and manual inputs. | Hidden source systems create blind spots, duplication, inconsistent records, and weak lineage. | Source-system inventory, data-source catalog, ownership matrix |
| Ingestion and streaming layer | Moves data into the platform through batch jobs, event streams, APIs, file drops, message brokers, and historian exports. | Data is late, missing, duplicated, malformed, or poorly monitored. | Pipeline register, ingestion log, latency report, failure queue |
| Integration and context layer | Aligns timestamps, units, asset identifiers, geospatial references, topology, thresholds, metadata, and dependency relationships. | Measurements cannot be compared, joined, interpreted, or traced across systems. | Schema registry, entity-resolution table, metadata dictionary, topology map |
| Storage and evidence layer | Persists raw, cleaned, curated, and analytical data in forms suited to operations, auditing, analytics, and historical review. | Records are overwritten, unverifiable, poorly retained, or disconnected from decision evidence. | SQL archive, data lake, warehouse, historian export, retention policy |
| Analytics and interpretation layer | Supports descriptive, diagnostic, predictive, prescriptive, geospatial, network, anomaly, risk, resilience, and scenario analysis. | Analytics produces fragile outputs because assumptions, inputs, thresholds, or limitations are unclear. | Model card, analytical notebook, validation report, metric definition file |
| Action and governance layer | Connects platform outputs to dispatch, maintenance, inspection, incident response, capital planning, regulatory reporting, and public accountability. | Insight remains disconnected from institutional action and public responsibility. | Action log, work-order link, after-action review, public evidence package |
This architecture makes clear that infrastructure data platforms are not passive repositories. They are institutional systems that coordinate knowledge across physical assets, digital systems, operational teams, governance processes, and decision horizons.
Implementation Pattern
A rigorous implementation pattern begins with the infrastructure decision problem rather than the technology stack. A utility, city agency, transportation authority, infrastructure owner, regulator, or resilience office should first identify whether the challenge is asset deterioration, outage restoration, water quality, leak detection, energy reliability, congestion, flood exposure, emissions monitoring, predictive maintenance, cybersecurity visibility, emergency response, capital planning, or public reporting. Only then should the platform design define what data must be ingested, how assets are identified, what metadata is required, what quality checks apply, which analytics are valid, and who acts on platform outputs.
| Artifact | Purpose | Suggested Format |
|---|---|---|
| Platform objective manifest | Defines service goals, decision uses, valid-use limits, governance responsibilities, and public reporting requirements. | YAML, Markdown, architecture decision record |
| Source-system inventory | Documents telemetry sources, operational systems, enterprise databases, GIS layers, work-order tools, inspection records, and external feeds. | CSV, SQL table, data catalog export |
| Asset and entity registry | Provides stable identifiers for assets, zones, networks, facilities, sensors, systems, agencies, and operational units. | CSV, SQL table, GIS-linked registry, master data file |
| Telemetry and event records | Stores timestamped measurements, operational events, alerts, failures, quality flags, and pipeline status. | CSV, time-series table, stream export, historian extract |
| Metadata and lineage register | Tracks provenance, unit, timestamp source, transformation steps, quality checks, ownership, and valid decision uses. | CSV, YAML, JSON schema, catalog record |
| Data-quality review | Assesses completeness, timeliness, consistency, validity, accuracy, calibration, duplication, and missingness. | CSV, notebook, SQL view, automated validation report |
| Analytics model card | Documents model purpose, inputs, assumptions, limits, validation status, and prohibited uses. | Markdown, YAML, governance template |
| Governance action log | Connects analytical outputs to inspection, maintenance, incident response, planning, regulatory reporting, or public communication. | CSV, SQL table, work-order export, governance register |
The implementation goal is to make infrastructure data claims reconstructable. A reader should be able to move from a dashboard alert, risk score, outage metric, maintenance priority, anomaly flag, resilience indicator, or public report back to the source systems, raw records, transformations, quality checks, thresholds, model assumptions, and institutional decisions that produced it.
Research-Grade Framing: Data Platforms as Infrastructure Stewardship
A research-grade account of infrastructure data platforms begins by treating them as infrastructure stewardship systems rather than software deployments. Infrastructure data platforms shape what institutions can see, remember, compare, explain, and act upon. They influence which assets receive maintenance, which risks become visible, which failures become diagnosable, which communities receive attention, which environmental harms are documented, which cyber-physical exposures are understood, and which public claims can be verified.
This framing matters because platforms are never neutral containers. Their schemas, thresholds, access rules, dashboards, identifiers, data-retention policies, quality checks, and model assumptions structure institutional perception. A platform that tracks equipment failure but not service inequality produces one form of intelligence. A platform that records sensor status but not calibration history produces another. A platform that aggregates data while stripping location, ownership, or uncertainty may create a false sense of coherence. Infrastructure analytics therefore raises questions of engineering quality, public accountability, organizational capacity, and justice.
Strong infrastructure data platforms also require humility. Data can be missing, delayed, biased, misaligned, duplicated, decontextualized, or overinterpreted. Models can be wrong. Dashboards can conceal uncertainty. Integrations can fail silently. Operational teams may distrust data if it conflicts with field experience. A mature platform makes these limitations visible. It does not merely present outputs; it preserves lineage, exposes data quality, distinguishes observation from inference, documents assumptions, and connects analytics to accountable decision pathways.
| Limited Pattern | Stronger Pattern | Why the Shift Matters |
|---|---|---|
| Store more telemetry | Build governed infrastructure evidence systems linked to assets, context, quality, and action | Data volume alone does not produce situational awareness or better decisions. |
| Create dashboards | Preserve lineage, uncertainty, quality flags, thresholds, and decision-use limits | Visual outputs can mislead if evidence chains are weak. |
| Integrate systems technically | Integrate systems semantically, institutionally, operationally, and securely | Infrastructure intelligence depends on meaning, responsibility, and governance, not only APIs. |
| Optimize individual assets | Support network, service, dependency, resilience, and public-interest reasoning | Infrastructure risk often emerges from relationships among systems. |
| Deploy analytics | Connect analytics to inspection, maintenance, operations, policy, planning, public reporting, and review cycles | Models produce value only when they inform accountable action. |
The central research question is therefore: how can infrastructure data platforms strengthen legibility, trust, resilience, security, and public accountability without creating opaque, brittle, exclusionary, or overconfident analytical systems?
Formal Model: Data Quality, Context, Lineage, Observability, and Actionability
A useful formal model separates data quality, contextual completeness, lineage strength, platform observability, analytical validity, and actionability. Let \(D_q\) represent data quality, \(C_x\) contextual completeness, \(L_g\) lineage strength, \(O_p\) platform observability, \(A_v\) analytical validity, and \(A_c\) actionability.
D_q =
w_1 C_{\mathrm{complete}} +
w_2 C_{\mathrm{consistent}} +
w_3 C_{\mathrm{timely}} +
w_4 C_{\mathrm{valid}} +
w_5 C_{\mathrm{accurate}}
\]
Interpretation: Data quality depends on completeness, consistency, timeliness, validity, and accuracy. The weights should reflect the decision context rather than a universal scoring rule.
C_x =
\frac{N_{\mathrm{contextualized}}}{N_{\mathrm{records}}}
\]
Interpretation: Contextual completeness measures the share of records linked to usable metadata such as asset identity, location, unit, timestamp source, system role, and threshold meaning.
L_g =
\frac{N_{\mathrm{traceable}}}{N_{\mathrm{derived}}}
\]
Interpretation: Lineage strength measures whether derived indicators can be traced back to source records, transformations, assumptions, and quality checks.
O_p =
\alpha D_q +
\beta C_x +
\gamma L_g +
\delta M_{\mathrm{coverage}} –
\eta G_{\mathrm{blindspots}}
\]
Interpretation: Platform observability improves when data quality, context, lineage, and coverage are strong, and weakens when blind spots grow.
A_v =
f(D_q, C_x, L_g, V_{\mathrm{model}}, U_{\mathrm{limits}})
\]
Interpretation: Analytical validity depends on input quality, context, lineage, model validation, and whether use remains within documented limits.
A_c =
\frac{N_{\mathrm{outputs\ linked\ to\ action}}}{N_{\mathrm{analytical\ outputs}}}
\]
Interpretation: Actionability measures whether analytical outputs are connected to inspection, maintenance, dispatch, planning, public communication, or other institutional response pathways.
This formal structure protects against a common mistake: treating infrastructure analytics as model output alone. Analytical value depends on the entire evidence chain: source quality, context, integration, lineage, validation, governance, and decision connection.
What Are Infrastructure Data Platforms and Analytics?
Infrastructure data platforms are the digital environments in which infrastructure-relevant data is ingested, standardized, linked, stored, queried, governed, and made available for operational and analytical use. They may include historians, relational databases, streaming systems, data lakes, data warehouses, event brokers, middleware, APIs, metadata layers, catalog systems, data-quality tools, alerting environments, visualization systems, and analytical workspaces. Their purpose is not simply to accumulate information, but to create a structured foundation through which infrastructure state can be interpreted across assets, locations, networks, organizations, and time.
Analytics, in this context, refers to the methods used to derive operational meaning from structured infrastructure data. These methods may include threshold detection, descriptive analysis, trend analysis, anomaly detection, state estimation, predictive maintenance models, performance benchmarking, scenario comparison, optimization, geospatial analysis, network analysis, risk scoring, resilience evaluation, and decision support. The analytics layer is only as strong as the platform beneath it. If data is poorly integrated, weakly governed, or stripped of context, even sophisticated analytical tools will produce fragile or misleading outputs.
It is useful to distinguish this layer from sensing alone. Sensors and telemetry generate signals from the physical world. Data platforms create the conditions under which those signals become comparable, persistent, interpretable, secure, and traceable. Analytics then translates structured signals into insight. In this way, infrastructure data platforms and analytics form the interpretive middle layer of intelligent infrastructure: the point at which raw measurement becomes operational intelligence.
Why Data Platforms Matter in Infrastructure Systems
Infrastructure systems generate information across many different technical and institutional boundaries. A single system may involve sensor telemetry, SCADA or operational technology logs, maintenance records, inspection reports, geospatial data, environmental data, outage histories, work orders, asset registries, customer reports, regulatory records, and external contextual inputs such as weather, markets, land use, hydrology, or mobility flows. Without a platform capable of bringing these sources into relation, institutions often end up with islands of visibility rather than system-wide awareness.
This matters because infrastructure is not managed through isolated readings. Operators and institutions need to know how measurements relate to assets, how asset conditions evolve over time, how events propagate across networks, and how local anomalies fit within larger system behavior. A pressure drop is more informative when linked to location, maintenance history, neighboring conditions, and previous incidents. A spike in load becomes more meaningful when situated within network topology, weather conditions, asset constraints, and prior patterns. A flood alert becomes more actionable when connected to drainage capacity, sensor health, rainfall forecasts, road exposure, public communication, and emergency-response protocols.
Data platforms also matter because infrastructure decisions are rarely confined to the immediate present. Some involve real-time intervention, but many concern maintenance prioritization, risk assessment, capital planning, resilience analysis, compliance reporting, environmental stewardship, and public accountability. A strong data platform allows the same information environment to support multiple decision horizons rather than forcing organizations to reconstruct understanding from disconnected tools. In that sense, infrastructure analytics is part of stewardship as much as technology.
| Infrastructure Need | Platform Capability | Failure If Missing |
|---|---|---|
| Operational awareness | Integrate real-time and historical records across assets, locations, systems, and events. | Operators see fragments rather than system state. |
| Asset stewardship | Connect condition, maintenance, inspection, criticality, and failure history. | Maintenance remains reactive or poorly prioritized. |
| Risk and resilience | Relate exposure, vulnerability, dependency, service continuity, and recovery performance. | Resilience planning relies on incomplete or anecdotal evidence. |
| Cyber-physical visibility | Track devices, logs, access, telemetry quality, operational events, and security posture. | Digital dependencies become invisible until disruption occurs. |
| Public accountability | Preserve traceable evidence behind claims, reports, interventions, and investment decisions. | Institutions cannot explain how conclusions were reached. |
The value of infrastructure data platforms lies in their ability to turn scattered evidence into durable institutional knowledge.
What Makes a Data Platform a Platform?
A data platform becomes a platform when it supports coordinated use across multiple sources, users, systems, and functions rather than simply serving as a passive storage repository. In infrastructure settings, this means that the platform does more than hold data. It enables ingestion from distributed systems, supports interoperability, preserves metadata, enforces governance rules, provides access pathways, supports analytical reuse, and creates a common evidence foundation for different operational and institutional actors.
Several qualities matter. First is persistence: infrastructure data must remain available over time if institutions are to analyze trends, compare events, reconstruct incidents, or build historical understanding. Second is context: readings must be linked to assets, locations, systems, timestamps, units, thresholds, and operational meaning. Third is interoperability: data from different vendors, subsystems, or agencies must be able to coexist and interact without constant manual reconciliation. Fourth is governed access: different users need trustworthy and appropriately controlled ways to query, visualize, model, and apply the data.
In that sense, infrastructure data platforms are coordination mechanisms as much as technical architectures. They create the common operating environment through which infrastructure can be interpreted collectively rather than piecemeal.
| Capability | Infrastructure Significance | Example Artifact |
|---|---|---|
| Ingestion | Brings telemetry, logs, records, files, APIs, and manual evidence into a common environment. | Pipeline manifest |
| Standardization | Aligns units, timestamps, schemas, identifiers, and coding systems. | Schema registry |
| Context preservation | Links readings to assets, location, topology, dependencies, and service meaning. | Asset-context table |
| Governed access | Allows different users to use data appropriately without exposing sensitive systems unnecessarily. | Access-control matrix |
| Analytical reuse | Supports repeated analysis without rebuilding evidence from scratch. | Curated dataset, notebook, SQL view |
| Lineage and auditability | Allows conclusions to be traced back to sources, transformations, and assumptions. | Lineage register |
A platform is therefore not defined by the product category it belongs to, but by whether it creates durable, governed, interoperable, and actionable infrastructure intelligence.
What Analytics Means in Infrastructure Contexts
Analytics in infrastructure contexts does not refer only to advanced modeling or machine learning. At its core, it refers to the disciplined transformation of data into interpretable and decision-relevant knowledge. Sometimes that means descriptive visibility: dashboards, alerts, and comparisons that make current conditions intelligible. Sometimes it means diagnostic analysis: understanding why a deviation or failure occurred. Sometimes it means predictive analysis: anticipating likely degradation, outage risk, quality decline, capacity stress, or maintenance need. In other cases, it means optimization or scenario evaluation across competing objectives such as reliability, cost, efficiency, safety, environmental performance, equity, and resilience.
What distinguishes infrastructure analytics from generic business analytics is the presence of physical systems, timing constraints, safety consequences, public-service obligations, and long-lived assets. An analytical model in infrastructure must often engage with engineering constraints, uncertainty, delayed effects, network interdependence, degraded operations, cyber-physical exposure, and institutional responsibility. That means infrastructure analytics benefits not only from data science, but also from systems modeling, operational knowledge, field experience, domain engineering, regulatory understanding, and institutional judgment.
Analytical maturity therefore cannot be measured by model complexity alone. In many infrastructure environments, the most valuable analytics are those that remain legible, calibrated to operational reality, validated against evidence, and linked to clear interventions. The purpose of analytics is not to generate impressive outputs, but to improve stewardship, diagnosis, coordination, resilience, and accountable decision-making across complex systems.
| Analytical Mode | Infrastructure Question | Example Use |
|---|---|---|
| Descriptive analytics | What is happening now, and how does it compare with expected conditions? | Service dashboards, system status reports, performance summaries |
| Diagnostic analytics | Why did a failure, anomaly, outage, leak, bottleneck, or deviation occur? | Root-cause analysis, incident reconstruction, asset-event correlation |
| Predictive analytics | What is likely to happen if present patterns continue? | Failure prediction, load forecasting, degradation modeling, flood-risk warning |
| Prescriptive analytics | What action should be considered under constraints and uncertainty? | Maintenance prioritization, dispatch support, inspection scheduling |
| Scenario analytics | How might the system behave under different stressors or interventions? | Resilience planning, climate adaptation, capital investment comparison |
| Governance analytics | Are decisions, claims, and interventions traceable, equitable, and accountable? | Public evidence packages, compliance review, decision audit |
The strongest infrastructure analytics are not the most mathematically elaborate. They are the ones that make the right uncertainty visible and support the right decision at the right level of institutional responsibility.
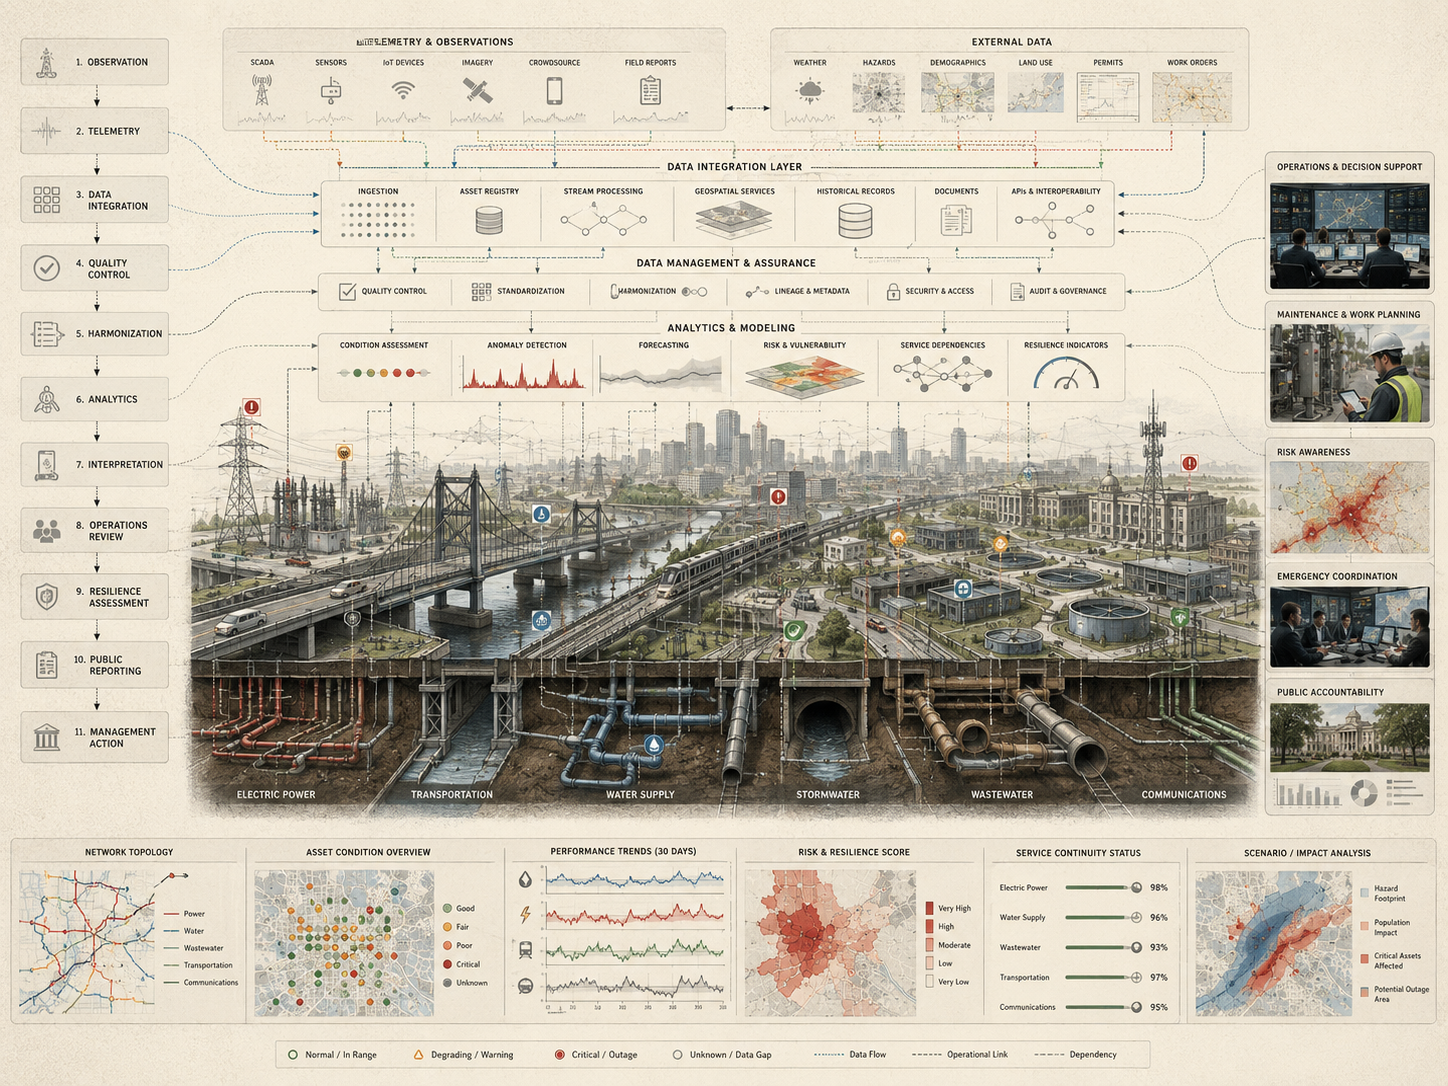
Data Platform Architecture and Flow
Infrastructure data platforms can be understood through a layered architecture that moves from signal acquisition to analytical and institutional use. Each layer performs a distinct role, and weaknesses at any layer can undermine the reliability of the full platform.
Source and Ingestion Layer
The ingestion layer collects data from sensors, operational technology, enterprise systems, inspection workflows, external feeds, and manual inputs. It is responsible for reliable intake from heterogeneous sources that may operate at different frequencies and under different technical standards. Strong ingestion design includes failure handling, schema checks, timestamp validation, unit recognition, duplicate detection, latency monitoring, and source-system ownership.
Integration and Standardization Layer
This layer aligns incoming data so that it can be compared and analyzed coherently. It may include schema mapping, timestamp alignment, unit normalization, entity matching, metadata enrichment, geospatial linking, threshold assignment, and contextual linking to infrastructure assets, locations, networks, and service zones. Without this layer, platforms accumulate records that cannot reliably produce system intelligence.
Storage and Persistence Layer
Infrastructure data may be stored in streaming systems, historians, data lakes, warehouses, relational databases, document stores, graph databases, or hybrid environments depending on use case. What matters is not a single storage model, but the ability to preserve data in forms appropriate to operational use, historical analysis, auditing, governance, and future reuse. Infrastructure platforms should distinguish raw records, cleaned records, curated datasets, derived indicators, model outputs, and decision records.
Metadata, Lineage, and Governance Layer
This layer preserves meaning. It tracks source, owner, unit, timestamp, quality flags, transformation history, access restrictions, decision-use limits, retention requirements, and responsible institutions. It is especially important in infrastructure because analytical outputs may influence safety, maintenance, public communication, regulatory reporting, and capital investment.
Analytical and Interpretation Layer
At this stage, data is queried, visualized, modeled, or assessed through rules, dashboards, forecasting tools, anomaly detection systems, performance metrics, network models, geospatial analysis, or digital twin environments. This is the layer where operational awareness begins to emerge from structured information.
Decision and Action Layer
Finally, analytical outputs must feed into decisions. These may include dispatch, maintenance prioritization, inspection, field response, operating changes, resilience planning, compliance reporting, capital allocation, public communication, or emergency response. Where platforms stop at visualization without supporting institutional action, their value remains partial.
| Stage | Function | Failure Mode |
|---|---|---|
| Signal acquisition | Captures telemetry, logs, records, files, inspections, and external feeds. | Important conditions remain invisible or unmeasured. |
| Ingestion | Moves data into the platform through controlled pipelines. | Data arrives late, malformed, duplicated, or silently missing. |
| Integration | Aligns schemas, timestamps, units, identities, and context. | Records cannot be joined or interpreted reliably. |
| Storage | Persists raw, cleaned, curated, and derived data. | Evidence is overwritten, untraceable, or unusable for review. |
| Analytics | Transforms data into indicators, models, alerts, forecasts, and scenarios. | Outputs appear sophisticated but lack validity or operational meaning. |
| Action | Connects outputs to maintenance, operations, planning, response, and governance. | Insight remains disconnected from institutional responsibility. |
This layered view shows why data platforms are essential to intelligent infrastructure. They do not replace sensing or decision-making. They connect them through a durable informational architecture capable of supporting observation, interpretation, and coordinated response.
Interoperability, Context, and Data Integration
Interoperability is one of the central problems in infrastructure data systems because infrastructure data rarely originates in a single environment. Assets may be procured from different vendors, monitored through different systems, maintained by different teams, and governed by different institutions. Without interoperable platforms, organizations often inherit fragmented visibility in which each subsystem appears legible locally but the system as a whole remains difficult to interpret.
Context is equally important. A measurement without context is often operationally weak. Platform design must therefore preserve the relationships that make data meaningful: asset identity, location, topology, ownership, maintenance history, time, thresholds, dependencies, risk status, and system role. This is why infrastructure data work is not reducible to bulk storage. It requires semantic and institutional structure.
Interoperability, portability, extensibility, and coherent data flow are not optional refinements in infrastructure settings. They are conditions under which analytics can become reliable across tools, teams, vendors, and decision environments. If measurements cannot move coherently across systems and stakeholders, analytics remains fragmented and cross-system resilience becomes harder to assess.
| Requirement | Why It Matters | Implementation Pattern |
|---|---|---|
| Stable asset identity | Records must be linked to the same asset across systems and time. | Master asset registry, crosswalk table, persistent IDs |
| Time alignment | Events, telemetry, maintenance, and external conditions must be comparable. | Timestamp policy, timezone handling, clock-sync checks |
| Unit normalization | Measurements cannot be compared if units are inconsistent or undocumented. | Unit registry, conversion rules, validation tests |
| Geospatial context | Infrastructure risk depends on location, networks, exposure, and service geography. | GIS linkage, geometry validation, service-zone maps |
| Metadata completeness | Users must know source, owner, quality, transformation, and valid use. | Metadata dictionary, lineage registry, data catalog |
| Governed interfaces | Systems need controlled and secure ways to exchange data. | API register, access policy, interface contracts |
Data integration is therefore a form of infrastructure governance. It determines whether institutions can see across systems rather than only within them.
Major Infrastructure Applications
Infrastructure data platforms and analytics now shape a wide range of applications. Their value differs by domain, but the underlying pattern is consistent: distributed signals become more valuable when integrated with asset context, operational workflows, analytical interpretation, and governance response.
Energy Systems
Grid modernization depends on platforms that integrate sensing, communications, asset records, distributed energy resources, outage data, weather inputs, and analytics in order to improve state awareness, reliability, flexibility, and uncertainty reduction. In this setting, data platforms help turn distributed electrical measurements into system-level visibility and coordinated operational intelligence.
Water, Wastewater, and Stormwater Systems
Water systems depend on platforms that integrate pressure, flow, tank level, water quality, treatment process data, laboratory results, sewer levels, rainfall, pump status, maintenance records, and public-health workflows. Data integration is essential because water quality, leakage, service continuity, wastewater overflows, and stormwater risk cannot be understood through isolated readings alone.
Transportation and Mobility Systems
Transportation platforms bring together traffic sensors, signal systems, transit operations, incident reports, pavement condition, weather, mobility data, maintenance records, and public-service information. Analytics can support congestion management, safety analysis, infrastructure maintenance, incident response, and long-term mobility planning.
Buildings, Facilities, and Campuses
Building infrastructure platforms integrate HVAC telemetry, energy use, occupancy patterns, indoor air quality, maintenance systems, access control, alarms, equipment condition, and resilience indicators. These platforms can support energy performance, comfort, safety, maintenance, decarbonization, and emergency operations.
Environmental Monitoring and Climate Resilience
Environmental infrastructure analytics can integrate sensor networks, satellite observations, field surveys, hydrological records, air-quality measurements, biodiversity indicators, land-use data, and climate risk models. These platforms support adaptation planning, disaster risk management, public-health protection, and ecosystem stewardship.
Operational Visibility and Cyber-Physical Security
Operational awareness depends on visibility into assets, users, systems, data, events, and logs. In infrastructure environments, analytical platforms are not only performance tools. They are also central to understanding exposure, dependency, system state, and continuity under cyber or operational stress.
| Domain | Platform Inputs | Analytical Uses |
|---|---|---|
| Energy | Grid telemetry, outages, DER records, weather, asset condition | State awareness, reliability, flexibility, restoration, resilience |
| Water | Pressure, flow, quality, lab tests, pump status, rainfall, sewer levels | Quality assurance, leakage analysis, overflow risk, public-health response |
| Transport | Traffic sensors, signal data, transit operations, incidents, pavement records | Congestion management, safety analysis, maintenance, incident response |
| Buildings | HVAC telemetry, energy use, occupancy, alarms, equipment condition | Energy optimization, maintenance, resilience, indoor environmental quality |
| Environmental monitoring | Remote sensing, field sensors, hydrology, air quality, biodiversity records | Risk detection, adaptation planning, ecological assessment, public reporting |
| Security and operations | Asset inventories, logs, access records, vulnerability data, incident records | Exposure review, anomaly detection, response readiness, continuity planning |
These applications show that infrastructure data platforms are not isolated software systems. They are cross-domain interpretive environments for critical public and operational knowledge.
Governance, Security, and Institutional Capacity
Infrastructure data platforms are governed systems as much as technical systems. Their effectiveness depends on data quality rules, access controls, retention practices, metadata discipline, security design, interoperability standards, procurement choices, workforce capability, institutional trust, and the ability to maintain the platform over time. Without governance, platforms may accumulate data while producing little reliable knowledge.
Security is especially important because infrastructure platforms often concentrate visibility into critical systems. The same visibility that enables good operations can also create risk if systems are poorly secured, exposed, or weakly segmented. Secure handling of data platforms is therefore not a peripheral concern but part of the platform’s basic integrity. Data access, logging, identity management, network segmentation, third-party integrations, and incident response should be treated as core platform responsibilities.
Institutional capacity matters just as much. A technically sophisticated platform can still fail if users do not trust the data, if teams lack common definitions, if workflows are not aligned, if quality problems are unresolved, or if no one is empowered to act on analytical outputs. Mature infrastructure platforms therefore require governance structures capable of sustaining interpretability, trust, and coordinated use across technical and institutional boundaries.
| Capability | Purpose | Evidence Artifact |
|---|---|---|
| Data governance | Defines ownership, stewardship, quality rules, metadata, retention, access, and valid-use limits. | Governance charter, data dictionary, retention policy |
| Security governance | Protects platform access, sensitive operational data, interfaces, logs, credentials, and third-party integrations. | Security architecture, access-control matrix, audit log |
| Interoperability governance | Ensures systems can exchange data coherently across vendors, agencies, and operational environments. | Standards matrix, API register, interface contract |
| Analytical governance | Documents model purpose, assumptions, inputs, validation, limits, review cycles, and prohibited uses. | Model card, validation report, analytical review log |
| Operational governance | Connects platform outputs to field response, maintenance, dispatch, inspections, and incident workflows. | Action log, work-order integration, response protocol |
| Public accountability | Supports transparent explanation of metrics, claims, investments, disruptions, and resilience decisions. | Public evidence package, reporting template, after-action review |
The governance question is whether infrastructure data platforms strengthen operational trust, institutional learning, public accountability, and resilience, or whether they simply add technical complexity to already fragmented systems.
Limits, Risks, and Analytical Failure Modes
Infrastructure data platforms and analytics create substantial capability, but they also introduce risks. One is false coherence: the appearance of system understanding generated by dashboards or models that conceal missing context, poor-quality inputs, weak metadata, or unresolved interoperability problems. Another is analytical overreach: using models beyond the conditions under which they are trustworthy. A third is organizational overload: collecting far more information than institutions can interpret or use effectively.
There are also deeper structural limits. Not every meaningful condition is easily captured in data. Not every operational trade-off can be resolved analytically. Physical systems contain uncertainty, delayed effects, nonlinear behavior, local knowledge, institutional constraints, and context-specific dynamics that may resist clean formalization. For this reason, analytics should strengthen human and institutional judgment rather than pretend to eliminate it.
The strongest infrastructure platforms are therefore not those that maximize complexity, but those that preserve traceability, context, and decision relevance. Their value lies in making infrastructure more interpretable and governable without obscuring uncertainty or creating brittle dependencies on opaque analytical systems.
| Failure Mode | Description | Mitigation |
|---|---|---|
| False coherence | Dashboards make fragmented data appear integrated when context, lineage, or quality are weak. | Show quality flags, lineage, missingness, uncertainty, and source coverage. |
| Model overreach | Analytics are used outside validated domains or beyond available evidence. | Use model cards, validation reports, use limits, and review gates. |
| Context loss | Measurements are separated from asset identity, location, unit, threshold, or operational meaning. | Preserve metadata, entity links, and semantic context. |
| Automation bias | Users defer to analytical outputs despite weak evidence or conflicting field knowledge. | Require human review, confidence indicators, and escalation procedures. |
| Security exposure | Centralized platform visibility exposes sensitive operational information. | Use segmentation, access control, logging, and least-privilege design. |
| Action gap | Analytics identify problems but do not connect to response authority. | Tie outputs to work orders, protocols, owners, and closure logs. |
Infrastructure analytics should be judged not only by accuracy, but by whether it remains interpretable, traceable, secure, and institutionally usable under real operating conditions.
Deployment Readiness Gate
Before infrastructure data platform workflows are used for operations, asset management, predictive maintenance, outage review, water-quality assurance, grid reliability, stormwater warning, public reporting, regulatory claims, capital prioritization, cybersecurity visibility, or resilience planning, they should pass a readiness gate. The purpose is not to slow modernization. It is to confirm that platform outputs are supported by trustworthy data, clear context, validated analytics, security controls, governance authority, and operational response pathways.
| Readiness Check | Pass Condition | Evidence |
|---|---|---|
| Decision purpose | Decision uses, valid-use limits, responsible institutions, and public-service goals are defined. | Platform objective manifest, decision-use register |
| Source-system inventory | Telemetry, logs, GIS layers, asset records, work orders, inspections, external feeds, and manual inputs are documented. | Source-system inventory, data catalog |
| Context and metadata | Records include asset identity, location, timestamp source, unit, owner, quality flag, threshold, and lineage. | Metadata dictionary, entity registry, lineage table |
| Data-quality validation | Completeness, timeliness, consistency, validity, accuracy, duplication, and missingness are measured and monitored. | Data-quality report, validation tests, anomaly logs |
| Security and access | Access controls, logging, segmentation, sensitive-data handling, and incident response are defined. | Access matrix, security architecture, audit log |
| Analytical validation | Models and metrics are documented, tested, reviewed, and limited to valid decision contexts. | Model card, metric definition file, validation report |
| Operational response | Outputs are connected to inspection, maintenance, dispatch, incident response, planning, or public communication. | Action protocol, work-order integration, response log |
| Public accountability | Assumptions, limitations, data gaps, responsible institutions, review cycles, and public claims are documented. | Public evidence package, reporting template, governance review |
A platform that cannot pass this readiness gate may still be useful for exploration, but its outputs should be treated cautiously when used for operational automation, public claims, regulatory reporting, safety decisions, or major infrastructure investment.
Data and Configuration Artifacts
The companion repository can use a data-first structure so infrastructure analytics claims can be examined rather than merely asserted. Each artifact has a specific role in making the platform evidence chain reconstructable across source systems, asset context, metadata, telemetry, quality checks, analytical outputs, and governance action.
| Artifact | File | Purpose |
|---|---|---|
| Platform objective manifest | config/platform_objective.yml |
Defines platform purpose, decision uses, valid-use limits, governance responsibilities, and public-service aims. |
| Source-system inventory | data/source_system_inventory.csv |
Documents telemetry systems, historians, GIS layers, work-order tools, inspection systems, external feeds, and data owners. |
| Infrastructure asset registry | data/infrastructure_asset_registry.csv |
Provides stable asset, zone, system, facility, sensor, and service identifiers. |
| Telemetry and event records | data/infrastructure_telemetry_events.csv |
Stores timestamped measurements, events, alerts, quality flags, and platform-ingestion status. |
| Metadata and lineage register | data/metadata_lineage_register.csv |
Tracks provenance, transformation, units, timestamp source, owner, quality flag, and valid use. |
| Data-quality review | data/data_quality_review.csv |
Assesses completeness, consistency, timeliness, validity, accuracy, duplication, and missingness. |
| Analytical output register | data/analytical_output_register.csv |
Documents indicators, models, dashboards, forecasts, risk scores, and decision links. |
| Governance action log | data/platform_governance_action_log.csv |
Connects analytics to inspection, maintenance, incident response, planning, reporting, or public communication. |
| SQL schema | sql/schema.sql |
Creates a local SQLite database for infrastructure platform evidence records. |
These artifacts are designed to make infrastructure data platforms auditable. They can be replaced with institutional data sources later, but the scaffold makes the logic of ingestion, integration, metadata, lineage, data quality, analytics, governance, and action explicit from the beginning.
Mathematical Lens: Platform Trust, Context, and Resilience
A lightweight mathematical lens helps distinguish infrastructure data platforms from simple data aggregation. The point is not to reduce platform performance to a single score, but to make visible the relationships among data quality, metadata, lineage, coverage, analytical validity, actionability, and resilience.
D_q =
w_1 C_{\mathrm{complete}} +
w_2 C_{\mathrm{consistent}} +
w_3 C_{\mathrm{timely}} +
w_4 C_{\mathrm{valid}} +
w_5 C_{\mathrm{accurate}}
\]
Interpretation: Data quality improves when records are complete, consistent, timely, valid, and accurate. Weighting should be tied to the decision use.
M_c =
\frac{N_{\mathrm{records\ with\ required\ metadata}}}{N_{\mathrm{records}}}
\]
Interpretation: Metadata completeness indicates whether records contain enough context to be interpreted responsibly.
L_g =
\frac{N_{\mathrm{traceable\ derived\ outputs}}}{N_{\mathrm{derived\ outputs}}}
\]
Interpretation: Lineage strength measures whether derived outputs can be traced to source records and transformations.
P_{\mathrm{trust}} =
\alpha D_q +
\beta M_c +
\gamma L_g +
\delta S_{\mathrm{security}} +
\theta V_{\mathrm{validation}}
\]
Interpretation: Platform trust depends on data quality, metadata, lineage, security, and validation together.
A_c =
\frac{N_{\mathrm{outputs\ linked\ to\ responsible\ action}}}{N_{\mathrm{outputs}}}
\]
Interpretation: Actionability measures whether outputs are connected to inspection, maintenance, operations, planning, reporting, or public communication.
R_{\mathrm{platform}} =
\lambda_1 P_{\mathrm{trust}} +
\lambda_2 O_{\mathrm{observability}} +
\lambda_3 B_{\mathrm{backup}} +
\lambda_4 A_c –
\lambda_5 E_{\mathrm{exposure}}
\]
Interpretation: Platform resilience rises with trust, observability, backup capacity, and actionability, while cyber, organizational, and data-quality exposure reduce resilience.
This mathematical framing should be used as a structured diagnostic, not as a substitute for engineering judgment, cybersecurity review, public governance, or domain-specific infrastructure expertise.
Python Workflow: Infrastructure Data Platform Review
The Python workflow in the companion repository can read source-system inventories, asset registries, telemetry-event records, metadata-lineage registers, data-quality reviews, analytical-output records, and governance action logs; compute platform trust, metadata completeness, lineage strength, data-quality scores, observability, actionability, and review flags; and export a governance-ready platform watchlist.
from pathlib import Path
import pandas as pd

ARTICLE_DIR = Path("articles/infrastructure-data-platforms-and-analytics-integration-visibility-and-resilience")
DATA_DIR = ARTICLE_DIR / "data"
OUTPUT_DIR = ARTICLE_DIR / "outputs"
OUTPUT_DIR.mkdir(parents=True, exist_ok=True)

sources = pd.read_csv(DATA_DIR / "source_system_inventory.csv")
assets = pd.read_csv(DATA_DIR / "infrastructure_asset_registry.csv")
events = pd.read_csv(DATA_DIR / "infrastructure_telemetry_events.csv", parse_dates=["timestamp"])
lineage = pd.read_csv(DATA_DIR / "metadata_lineage_register.csv")
quality = pd.read_csv(DATA_DIR / "data_quality_review.csv")
outputs = pd.read_csv(DATA_DIR / "analytical_output_register.csv")
actions = pd.read_csv(DATA_DIR / "platform_governance_action_log.csv")

review = (
    events
    .merge(assets, on="asset_id", how="left")
    .merge(sources, on="source_system_id", how="left")
    .merge(lineage, on="record_id", how="left")
    .merge(quality, on="dataset_id", how="left")
)

review["data_quality_score"] = (
    0.25 * review["completeness_score"] +
    0.20 * review["consistency_score"] +
    0.20 * review["timeliness_score"] +
    0.20 * review["validity_score"] +
    0.15 * review["accuracy_score"]
).clip(lower=0, upper=1)

review["metadata_completeness_score"] = (
    review[
        [
            "has_asset_id",
            "has_location",
            "has_unit",
            "has_timestamp_source",
            "has_owner",
            "has_quality_flag",
            "has_valid_use"
        ]
    ]
    .astype(float)
    .mean(axis=1)
    .clip(lower=0, upper=1)
)

review["lineage_strength_score"] = (
    review[
        [
            "source_traceable",
            "transformation_traceable",
            "quality_check_traceable",
            "output_traceable"
        ]
    ]
    .astype(float)
    .mean(axis=1)
    .clip(lower=0, upper=1)
)

review["latency_score"] = (
    1 - review["latency_seconds"] / review["latency_seconds"].max()
).clip(lower=0, upper=1)

review["platform_observability_score"] = (
    0.25 * review["data_quality_score"] +
    0.25 * review["metadata_completeness_score"] +
    0.20 * review["lineage_strength_score"] +
    0.15 * review["coverage_score"] +
    0.15 * review["latency_score"]
).clip(lower=0, upper=1)

action_links = (
    outputs
    .merge(actions, on="analytical_output_id", how="left")
    .assign(has_action=lambda df: df["governance_action_id"].notna())
    .groupby("dataset_id", as_index=False)
    .agg(actionability_score=("has_action", "mean"))
)

review = review.merge(action_links, on="dataset_id", how="left")
review["actionability_score"] = review["actionability_score"].fillna(0).clip(lower=0, upper=1)

review["platform_trust_score"] = (
    0.30 * review["data_quality_score"] +
    0.25 * review["metadata_completeness_score"] +
    0.20 * review["lineage_strength_score"] +
    0.15 * review["security_control_score"] +
    0.10 * review["validation_score"]
).clip(lower=0, upper=1)

review["platform_review_flag"] = (
    (review["data_quality_score"] < 0.80) |
    (review["metadata_completeness_score"] < 0.80) |
    (review["lineage_strength_score"] < 0.75) |
    (review["platform_observability_score"] < 0.75) |
    (review["platform_trust_score"] < 0.75) |
    (review["actionability_score"] < 0.50) |
    (review["security_control_score"] < 0.70) |
    (review["quality_flag"].eq("review"))
)

watchlist = (
    review[review["platform_review_flag"]]
    .sort_values(
        ["platform_trust_score", "platform_observability_score", "actionability_score"],
        ascending=[True, True, True]
    )
)

review.to_csv(OUTPUT_DIR / "infrastructure_data_platform_review.csv", index=False)
watchlist.to_csv(OUTPUT_DIR / "infrastructure_data_platform_watchlist.csv", index=False)

print(watchlist[[
    "record_id",
    "asset_id",
    "source_system_id",
    "dataset_id",
    "data_quality_score",
    "metadata_completeness_score",
    "lineage_strength_score",
    "platform_trust_score",
    "actionability_score"
]])
This workflow is intentionally transparent. It allows analysts to see whether platform concern arises from source-system gaps, data quality, weak metadata, poor lineage, high latency, low actionability, or security-control weakness.
R Workflow: Data Quality, Integration, and Observability Reporting
The R workflow can summarize platform performance by source system, infrastructure domain, asset class, dataset, owner, or governance concern; identify quality, metadata, lineage, observability, and actionability gaps; and create stewardship-oriented reports for infrastructure owners, utilities, regulators, engineers, analysts, data teams, and governance review groups.
library(readr)
library(dplyr)

article_dir <- "articles/infrastructure-data-platforms-and-analytics-integration-visibility-and-resilience"
data_dir <- file.path(article_dir, "data")
output_dir <- file.path(article_dir, "outputs")
dir.create(output_dir, recursive = TRUE, showWarnings = FALSE)

sources <- read_csv(file.path(data_dir, "source_system_inventory.csv"), show_col_types = FALSE)
assets <- read_csv(file.path(data_dir, "infrastructure_asset_registry.csv"), show_col_types = FALSE)
events <- read_csv(file.path(data_dir, "infrastructure_telemetry_events.csv"), show_col_types = FALSE)
lineage <- read_csv(file.path(data_dir, "metadata_lineage_register.csv"), show_col_types = FALSE)
quality <- read_csv(file.path(data_dir, "data_quality_review.csv"), show_col_types = FALSE)
outputs <- read_csv(file.path(data_dir, "analytical_output_register.csv"), show_col_types = FALSE)
actions <- read_csv(file.path(data_dir, "platform_governance_action_log.csv"), show_col_types = FALSE)

action_links <- outputs %>%
  left_join(actions, by = "analytical_output_id") %>%
  mutate(has_action = !is.na(governance_action_id)) %>%
  group_by(dataset_id) %>%
  summarise(actionability_score = mean(has_action), .groups = "drop")

review <- events %>%
  left_join(assets, by = "asset_id") %>%
  left_join(sources, by = "source_system_id") %>%
  left_join(lineage, by = "record_id") %>%
  left_join(quality, by = "dataset_id") %>%
  left_join(action_links, by = "dataset_id") %>%
  mutate(
    data_quality_score = pmax(
      0,
      pmin(
        1,
        0.25 * completeness_score +
        0.20 * consistency_score +
        0.20 * timeliness_score +
        0.20 * validity_score +
        0.15 * accuracy_score
      )
    ),
    metadata_completeness_score = rowMeans(
      across(
        c(
          has_asset_id,
          has_location,
          has_unit,
          has_timestamp_source,
          has_owner,
          has_quality_flag,
          has_valid_use
        ),
        as.numeric
      ),
      na.rm = TRUE
    ),
    lineage_strength_score = rowMeans(
      across(
        c(
          source_traceable,
          transformation_traceable,
          quality_check_traceable,
          output_traceable
        ),
        as.numeric
      ),
      na.rm = TRUE
    ),
    latency_score = pmax(0, pmin(1, 1 - latency_seconds / max(latency_seconds, na.rm = TRUE))),
    platform_observability_score = pmax(
      0,
      pmin(
        1,
        0.25 * data_quality_score +
        0.25 * metadata_completeness_score +
        0.20 * lineage_strength_score +
        0.15 * coverage_score +
        0.15 * latency_score
      )
    ),
    actionability_score = if_else(is.na(actionability_score), 0, actionability_score),
    platform_trust_score = pmax(
      0,
      pmin(
        1,
        0.30 * data_quality_score +
        0.25 * metadata_completeness_score +
        0.20 * lineage_strength_score +
        0.15 * security_control_score +
        0.10 * validation_score
      )
    ),
    platform_review_flag =
      data_quality_score < 0.80 |
      metadata_completeness_score < 0.80 |
      lineage_strength_score < 0.75 |
      platform_observability_score < 0.75 |
      platform_trust_score < 0.75 |
      actionability_score < 0.50 |
      security_control_score < 0.70 |
      quality_flag == "review"
  )

source_summary <- review %>%
  group_by(source_system_id, source_system_name, infrastructure_domain) %>%
  summarise(
    records = n(),
    assets = n_distinct(asset_id),
    mean_data_quality = mean(data_quality_score, na.rm = TRUE),
    mean_metadata_completeness = mean(metadata_completeness_score, na.rm = TRUE),
    mean_lineage_strength = mean(lineage_strength_score, na.rm = TRUE),
    mean_platform_observability = mean(platform_observability_score, na.rm = TRUE),
    mean_platform_trust = mean(platform_trust_score, na.rm = TRUE),
    mean_actionability = mean(actionability_score, na.rm = TRUE),
    review_flags = sum(platform_review_flag, na.rm = TRUE),
    .groups = "drop"
  ) %>%
  arrange(desc(review_flags), mean_platform_trust)

write_csv(review, file.path(output_dir, "infrastructure_data_platform_review_report.csv"))
write_csv(source_summary, file.path(output_dir, "infrastructure_data_platform_source_summary.csv"))

print(source_summary)
The purpose is not to produce a definitive platform grade. It is to demonstrate how data quality, metadata, lineage, observability, security, analytical validation, and actionability can be made reproducible and auditable.
Systems Code: Data Pipelines, Validation, Edge Streams, and Platform Interfaces
The companion repository can extend the article into a reproducible systems scaffold. Python and R support analytical review; SQL stores evidence; YAML files define objectives and policies; JSON schemas validate data records; TypeScript can support interface models; Go can support platform-status APIs; Rust can support strict record validation; C can support low-level quality and observability calculations; Fortran can support numerical scoring routines; MicroPython can support edge-node telemetry packaging; PYNQ and HDL can support hardware-assisted stream validation where appropriate.
| Directory | Role | Example Use |
|---|---|---|
python/ |
Platform review, data-quality scoring, metadata assessment, lineage review, watchlists | Compute platform trust, observability, actionability, and review flags |
r/ |
Source-system summaries, platform reporting, quality and governance review | Summarize platform performance by domain, dataset, source, and owner |
sql/ |
Evidence tables and auditable queries | Join source systems, assets, telemetry, lineage, quality, analytics, and actions |
schemas/ |
Record validation and interoperability scaffolding | Validate telemetry records, metadata records, source-system records, and output records |
c/ and embedded_c/ |
Low-level scoring and stream-quality checks | Compute data-quality, observability, latency, and review flags at the edge |
rust/ |
Strict validation and CLI scaffolding | Validate platform records, required metadata, units, timestamps, and lineage fields |
go/ |
Platform status API scaffold | Expose source, dataset, quality, lineage, trust, and actionability status |
fortran/ |
Numerical scoring routines | Prototype platform trust, observability, and resilience equations |
micropython/ |
Edge telemetry-node scaffold | Package asset telemetry with required metadata and quality flags before transmission |
pynq/ and hdl/ |
Hardware-assisted stream validation | Prototype FPGA checks for timestamp, quality flag, missing metadata, latency, and valid unit codes |
typescript/ |
Dashboard/interface scaffold | Display data quality, metadata completeness, lineage, trust, and actionability flags |
The code should be understood as an engineering scaffold for reproducible infrastructure data platform workflows, not as a replacement for production data engineering, cybersecurity review, operational technology governance, regulatory compliance, institutional data stewardship, or domain-specific infrastructure expertise.
GitHub Repository
The companion repository can house the reproducible data, code, schemas, validation tools, and systems-engineering examples that support this article’s infrastructure data platform and analytics framework.
The companion repository contains reproducible scaffolding for source-system inventories, infrastructure asset registries, telemetry and event records, metadata and lineage registers, data-quality review, analytical output tracking, SQL-backed evidence archives, platform governance logs, embedded stream validation examples, and multi-language infrastructure data workflows.
Testing and Validation
Testing infrastructure data platforms requires more than confirming that pipelines run or dashboards load. Validation should examine whether source systems are documented, whether records are complete and timely, whether schemas are enforced, whether asset identities resolve correctly, whether metadata is sufficient, whether lineage is traceable, whether quality checks detect real problems, whether analytics are validated, whether access controls protect sensitive systems, and whether outputs lead to responsible action.
| Validation Area | Test Question | Failure Signal |
|---|---|---|
| Source-system coverage | Are all relevant telemetry, OT, GIS, asset, inspection, work-order, log, and external systems documented? | Platform blind spots persist despite apparent integration. |
| Schema validation | Do records conform to expected fields, data types, units, and valid ranges? | Malformed records enter analytics undetected. |
| Metadata completeness | Do records include asset ID, location, timestamp source, unit, owner, quality flag, and valid-use context? | Data cannot be responsibly interpreted or reused. |
| Lineage validation | Can derived indicators be traced back to source records, transformations, assumptions, and quality checks? | Outputs cannot be audited or explained. |
| Data-quality monitoring | Are completeness, timeliness, consistency, validity, accuracy, duplication, and missingness monitored? | Analytics continue operating on degraded inputs. |
| Security validation | Are access control, logging, segmentation, sensitive-data handling, and incident procedures tested? | Platform visibility creates new operational exposure. |
| Analytical validation | Are models, dashboards, risk scores, and metrics tested against known cases and documented assumptions? | Outputs look authoritative but are weakly grounded. |
| Action validation | Are analytical outputs connected to maintenance, inspection, dispatch, planning, reporting, or communication? | Platform insight does not change institutional behavior. |
Validation should be repeated after schema changes, vendor migrations, new sensors, platform upgrades, cybersecurity findings, major incidents, regulatory changes, new analytical models, and changes in decision use.
Operational Signals and Platform Observability
Platform observability means being able to see whether the data platform itself is functioning as trustworthy infrastructure. This includes ingestion status, pipeline latency, failed jobs, missing records, schema drift, duplicated records, metadata gaps, lineage breaks, source-system availability, access anomalies, quality-check failures, model status, dashboard freshness, storage health, backup status, and action-closure rates. In intelligent infrastructure, the platform that observes infrastructure must also be observable itself.
| Signal | What It Reveals | Operational Use |
|---|---|---|
| Pipeline latency | Whether data arrives quickly enough for the intended decision use | Operational trust, alert reliability, real-time readiness |
| Ingestion failure rate | Whether source data is arriving successfully | Pipeline maintenance, incident response, data-quality review |
| Schema drift | Whether source structures changed without platform adaptation | Integration monitoring, vendor change review |
| Metadata completeness | Whether records preserve enough context for responsible interpretation | Catalog improvement, governance review, quality gates |
| Lineage coverage | Whether outputs can be traced to sources and transformations | Audit readiness, model trust, public evidence |
| Access anomalies | Whether platform access patterns suggest misuse or security concern | Security monitoring, incident response, access review |
| Analytical freshness | Whether dashboards, models, and indicators reflect current data | Decision confidence, stale-output prevention |
| Action closure | Whether insights lead to responsible institutional response | Governance accountability and institutional learning |
Infrastructure data platform observability is strongest when the institution can monitor not only physical infrastructure conditions, but also the reliability, security, quality, and actionability of the informational systems used to interpret those conditions.
Engineer and Researcher Checklist
- Define platform purpose, decision uses, valid-use limits, responsible institutions, and public-service goals before selecting tools.
- Document all source systems, including telemetry, SCADA, historians, GIS layers, asset systems, inspections, work orders, logs, external feeds, and manual inputs.
- Create stable identifiers for assets, zones, systems, sensors, facilities, datasets, source systems, and analytical outputs.
- Track metadata: asset ID, location, timestamp source, unit, owner, quality flag, transformation, access level, and valid-use context.
- Measure data quality: completeness, timeliness, consistency, validity, accuracy, duplication, calibration, and missingness.
- Preserve lineage from raw records through cleaned data, curated datasets, derived indicators, models, dashboards, and decisions.
- Secure platform access through identity controls, segmentation, logging, least privilege, sensitive-data handling, and incident response.
- Validate analytical models and metrics against field evidence, known cases, expert review, and documented assumptions.
- Connect platform outputs to inspection, maintenance, dispatch, incident response, planning, reporting, or public communication.
- Document uncertainties, blind spots, limitations, governance owners, review cycles, and public evidence behind claims.
This checklist is intentionally practical. It keeps infrastructure data platforms focused on trust, context, traceability, security, actionability, and public accountability rather than technical sophistication alone.
Where This Fits in the Series
Infrastructure data platforms and analytics connect several major threads within the Intelligent Infrastructure Systems knowledge series. They rely on digital infrastructure to move data, infrastructure monitoring to capture signals, cyber-physical systems to link computation with physical operations, digital twins to simulate system behavior, asset management to organize maintenance knowledge, security systems to protect visibility and access, and governance systems to translate evidence into responsible institutional action.
This article therefore functions as a bridge between sensing, computation, analytics, governance, and infrastructure resilience. It shows that intelligent infrastructure is not only about sensors, automation, optimization, or digital dashboards. It is also about whether institutions can preserve trustworthy evidence, interpret uncertainty, coordinate across systems, act responsibly, and learn from changing conditions over time.
Future Directions
The future of infrastructure data platforms will likely involve tighter integration of streaming telemetry, edge processing, cloud and hybrid data environments, geospatial intelligence, digital twins, operational technology logs, asset management systems, AI-assisted diagnostics, and adaptive analytical workflows across infrastructure sectors. Platforms will become less static and more operationally consequential as infrastructure systems become more instrumented, more interconnected, and more exposed to climate, cyber, financial, and institutional stress.
The deeper challenge, however, is not simply building larger platforms or using more advanced models. It is building data environments that remain interoperable, trustworthy, governable, secure, and decision-relevant as complexity grows. Infrastructure analytics will matter most where it improves legibility, traceability, and institutional capability rather than merely increasing technical sophistication.
The long-run goal is not data abundance for its own sake, but analytical stewardship: platforms that help institutions know their systems better, reason about uncertainty more clearly, act with greater resilience under changing conditions, and explain their decisions more transparently to the people who depend on essential infrastructure.
Related Articles
- Digital Infrastructure Systems
- Cyber-Physical Infrastructure Systems
- Infrastructure Monitoring and Sensor Integration
- Digital Twins and Infrastructure Simulation
- Asset Management and Predictive Maintenance Systems
- Infrastructure Security and Cyber Resilience
- Infrastructure Governance and Policy Systems
- Smart Energy Grids and Digital Power Systems
- Intelligent Water Infrastructure Systems
- Intelligent Transportation Networks
These connections are substantive rather than decorative. Infrastructure data platforms are bridging systems that connect measurement, memory, interpretation, security, governance, and response across complex infrastructure environments.
Further Reading
- National Institute of Standards and Technology (NIST) (2019) Big Data Interoperability Framework: Volume 7, Standards Roadmap, Revision 2. Available at: https://nvlpubs.nist.gov/nistpubs/SpecialPublications/NIST.SP.1500-7r2.pdf.
- National Institute of Standards and Technology (NIST) (2019) Big Data Interoperability Framework: Volume 4, Security and Privacy, Revision 2. Available at: https://nvlpubs.nist.gov/nistpubs/SpecialPublications/NIST.SP.1500-4r2.pdf.
- U.S. Department of Energy (DOE) (n.d.) Grid Modernization Initiative. Available at: https://www.energy.gov/gmi/grid-modernization-initiative.
- U.S. Department of Energy (DOE) (n.d.) Grid Modernization and the Smart Grid. Available at: https://www.energy.gov/oe/grid-modernization-and-smart-grid.
- Cybersecurity and Infrastructure Security Agency (CISA) (2022) BOD 23-01: Improving Asset Visibility and Vulnerability Detection on Federal Networks. Available at: https://www.cisa.gov/news-events/directives/bod-23-01-improving-asset-visibility-and-vulnerability-detection-federal-networks.
- Cybersecurity and Infrastructure Security Agency (CISA) (n.d.) Technical Reference Architecture. Available at: https://www.cisa.gov/resources-tools/services/technical-reference-architecture-tra.
- Cybersecurity and Infrastructure Security Agency (CISA) (2025) Priority Considerations for Operational Technology Owners and Operators. Available at: https://www.cisa.gov/sites/default/files/2025-01/joint-guide-secure-by-demand-priority-considerations-for-ot-owners-and-operators-508c_0.pdf.
- National Academies of Sciences, Engineering, and Medicine (n.d.) Cyber-Physical Systems and Internet of Things. Available at: https://www.nationalacademies.org/topics/cyber-physical-systems-and-internet-of-things.
References
- Cybersecurity and Infrastructure Security Agency (CISA) (2022) BOD 23-01: Improving Asset Visibility and Vulnerability Detection on Federal Networks. Available at: https://www.cisa.gov/news-events/directives/bod-23-01-improving-asset-visibility-and-vulnerability-detection-federal-networks.
- Cybersecurity and Infrastructure Security Agency (CISA) (n.d.) Technical Reference Architecture. Available at: https://www.cisa.gov/resources-tools/services/technical-reference-architecture-tra.
- Cybersecurity and Infrastructure Security Agency (CISA) (2025) Priority Considerations for Operational Technology Owners and Operators. Available at: https://www.cisa.gov/sites/default/files/2025-01/joint-guide-secure-by-demand-priority-considerations-for-ot-owners-and-operators-508c_0.pdf.
- National Academies of Sciences, Engineering, and Medicine (n.d.) Cyber-Physical Systems and Internet of Things. Available at: https://www.nationalacademies.org/topics/cyber-physical-systems-and-internet-of-things.
- National Academies of Sciences, Engineering, and Medicine (2023) The Rise of Cyber-Physical Systems. Available at: https://www.nationalacademies.org/news/the-rise-of-cyber-physical-systems.
- National Institute of Standards and Technology (NIST) (2019) Big Data Interoperability Framework: Volume 4, Security and Privacy, Revision 2. Gaithersburg, MD: NIST. Available at: https://nvlpubs.nist.gov/nistpubs/SpecialPublications/NIST.SP.1500-4r2.pdf.
- National Institute of Standards and Technology (NIST) (2019) Big Data Interoperability Framework: Volume 7, Standards Roadmap, Revision 2. Gaithersburg, MD: NIST. Available at: https://nvlpubs.nist.gov/nistpubs/SpecialPublications/NIST.SP.1500-7r2.pdf.
- U.S. Department of Energy (DOE) (n.d.) Grid Modernization Initiative. Available at: https://www.energy.gov/gmi/grid-modernization-initiative.
- U.S. Department of Energy (DOE) (n.d.) Grid Modernization and the Smart Grid. Available at: https://www.energy.gov/oe/grid-modernization-and-smart-grid.