
Last Updated May 14, 2026
Environmental data platforms and decision support systems are infrastructures of environmental intelligence through which heterogeneous observations, models, metadata, analytical workflows, and user interfaces are organized into evidence that can support planning, operations, regulation, resilience, public accountability, and collective choice. They sit above sensors, field devices, remote-sensing systems, monitoring networks, administrative records, and scientific models, giving those observations persistence, comparability, context, lineage, and operational meaning. In this sense, an environmental data platform is not merely a repository, and a decision support system is not merely a dashboard. Together, they form the interpretive architecture through which environmental information becomes usable judgment.
Environmental monitoring creates a distinctive information problem because environmental data are heterogeneous in source, scale, quality, latency, uncertainty, and meaning. Air, water, climate, ecological, hydrological, geospatial, infrastructure-linked, and regulatory observations may arrive from different agencies, devices, models, field programs, and archives under different standards, temporal resolutions, spatial references, and governance arrangements. Some are high-frequency operational streams. Others are slow observational records, derived products, scenario outputs, or policy-relevant indicators. Some support immediate warning. Others support retrospective learning, long-horizon planning, compliance review, environmental justice analysis, or public communication. A platform becomes necessary because environmental knowledge is rarely decision-ready at the moment of measurement. It becomes practically meaningful only when it can be discovered, aligned, interpreted, compared, and situated within a concrete question.
The deeper significance of environmental data platforms lies in the fact that they shape what kinds of environmental judgment become institutionally possible. A strong platform can connect evidence across agencies and scales, preserve provenance, surface uncertainty, support scenario comparison, manage geospatial evidence, expose analytical assumptions, and link data to operational or policy choices. A weak platform can create data abundance without interpretability, dashboards without consequence, models without lineage, and fragmented information that remains difficult to trust or act upon. Decision support, then, is not simply a presentation problem. It is an architectural and epistemic problem: how environmental evidence is structured, governed, made comparable, and translated into choices under uncertainty.
Main Library
Publications
Article Map
Environmental Monitoring
Related Topic
Data Systems
Related Topic
Artificial Intelligence
Related Topic
Risk & Resilience
Environmental data platforms are where observation becomes evidence infrastructure. They organize the movement from measurement to meaning: from sensor readings to quality-controlled records, from records to metadata-rich datasets, from datasets to indicators and models, from indicators and models to scenarios, and from scenarios to decisions that can be reviewed. A platform that stores data but cannot preserve meaning is incomplete. A decision-support system that visualizes outputs but cannot expose lineage is fragile. The strongest systems join data management, semantic coherence, analytical workflows, human-centered interfaces, governance, and feedback into one inspectable evidence chain.
Engineering Problem
The engineering problem is how to design environmental data platforms and decision support systems that can ingest heterogeneous environmental data, preserve their meaning, expose them through reusable services, support transparent analytics, and connect them to decision contexts without losing provenance, uncertainty, semantic coherence, or accountability. Environmental evidence is not simply collected; it is assembled. That assembly process must be technically reliable and intellectually inspectable.
This is difficult because environmental data platforms often serve multiple users with different temporal and evidentiary needs. A responder may need near-real-time streamflow, hazard, or air-quality data. A regulator may need facility-level records, inspection history, geospatial overlays, and trend summaries. A planner may need historical baselines, climate projections, land-use scenarios, infrastructure exposure, and uncertainty bounds. A scientist may need source data, metadata, calibration history, versioned models, and reproducible workflows. A community user may need understandable local evidence, exposure context, and public accountability. One platform may be expected to support all of these needs while integrating sources with different ownership, standards, update cycles, spatial references, and quality levels.
Weak platforms treat integration as a storage problem. They collect files, tables, APIs, and map layers without preserving enough metadata, semantic context, quality information, or decision logic to make the data reusable. Strong platforms treat integration as an evidentiary problem. They ask whether data can be discovered, interpreted, compared, trusted, transformed, modeled, governed, and used in decisions under real uncertainty. The goal is not merely availability. The goal is usable environmental intelligence.
| Engineering Tension | Why It Matters | Required Evidence |
|---|---|---|
| Storage versus intelligence | Repositories preserve records, but platforms must support discovery, integration, interpretation, and reuse. | Catalog, metadata schema, API design, workflow registry, decision-use map |
| Technical interoperability versus semantic coherence | Systems may exchange data successfully while disagreeing on meaning, units, scale, definitions, or lineage. | Controlled vocabularies, semantic mappings, unit registry, variable definitions |
| Access versus usability | Open or accessible data can remain practically unusable if documentation and workflow integration are weak. | Data dictionary, examples, API documentation, usage patterns, user testing |
| Model power versus model transparency | Models can extend evidence but also introduce assumptions, parameter uncertainty, and scenario dependence. | Model card, input lineage, calibration record, scenario assumptions, uncertainty statement |
| Dashboard visibility versus decision support | Visualization can improve awareness but does not automatically support comparison, choice, or accountability. | Decision context, action logic, provenance links, scenario comparison, review record |
| Data abundance versus decision quality | More data can increase confusion if relevance, context, and uncertainty are not structured. | Question-driven views, relevance scoring, information architecture, evidence filters |
| Centralization versus stewardship | Central platforms can improve integration but may weaken local stewardship, domain ownership, or community control. | Stewardship model, access rules, governance roles, data sovereignty review |
The practical question is therefore: can the platform preserve enough meaning, context, provenance, and analytical structure that environmental data become trustworthy evidence for decisions rather than disconnected information assets?
Reference Architecture
A practical environmental data platform and decision support architecture can be understood as a layered evidence system. The exact implementation may involve data lakes, warehouses, catalogs, geospatial services, streaming pipelines, scientific data stores, model registries, APIs, dashboard systems, scenario engines, workflow orchestration, identity controls, and public reporting layers. The underlying responsibilities remain consistent: ingest, validate, catalog, harmonize, expose, analyze, interpret, decide, and learn.
| Layer | Engineering Role | Primary Risk | Evidence Artifact |
|---|---|---|---|
| Source layer | Generates environmental inputs from sensors, satellites, field surveys, models, forecasts, administrative records, and public datasets. | Source gaps, inconsistent methods, undocumented revisions, weak ownership | Source inventory, data owner registry, collection method, update cadence |
| Ingestion layer | Receives batch, streaming, API, geospatial, model, and manually submitted data into controlled platform workflows. | Silent ingestion failure, schema drift, duplicate records, invalid timestamps | Ingestion log, schema validation, idempotency keys, freshness report |
| Quality and validation layer | Checks units, ranges, missingness, calibration flags, geospatial validity, timestamp coherence, and source reliability. | Invalid data becoming decision evidence | QA/QC report, validation rules, anomaly log, quality flags |
| Metadata and catalog layer | Preserves dataset identity, provenance, methods, temporal scope, spatial reference, access rights, lineage, and reuse conditions. | Data become accessible but scientifically ambiguous | Metadata catalog, data dictionary, lineage graph, provenance record |
| Semantic integration layer | Aligns variables, units, vocabularies, classifications, spatial frames, and temporal scales across sources. | Technically joined data that remain semantically incompatible | Ontology or vocabulary map, unit registry, crosswalk table, harmonization manifest |
| Storage and access layer | Provides durable storage, query services, APIs, geospatial services, search, versioning, and access controls. | Fragmented access, weak versioning, security gaps, ungoverned duplication | API documentation, access policy, version registry, storage architecture |
| Analytical and model layer | Computes indicators, forecasts, scenarios, classifications, uncertainty estimates, and decision-relevant outputs. | Opaque models, weak assumptions, unreviewed workflows, overconfident outputs | Workflow manifest, model card, scenario registry, uncertainty report |
| Decision-support layer | Connects evidence to user questions through dashboards, maps, reports, scenario tools, alerts, and explanatory interfaces. | Interface clarity without evidentiary depth | User-role matrix, dashboard specification, action logic, decision log |
| Governance and accountability layer | Defines stewardship, review, access, public transparency, auditability, and corrective feedback. | Data abundance without accountability or decision consequence | Governance policy, audit trail, review cadence, public evidence package |
This architecture makes clear that platforms are not passive stores. They are active infrastructures that transform environmental records into interoperable, reusable, and decision-relevant evidence. Every layer can strengthen or weaken the final judgment users are able to make.
Implementation Pattern
A rigorous implementation begins by defining the environmental decision context, user groups, data domains, source systems, metadata requirements, interoperability standards, analytical workflows, model governance, uncertainty policies, access controls, and feedback mechanisms. The platform should be designed around environmental questions, not simply around available datasets. The central implementation task is to preserve the evidence chain from source to decision.
| Artifact | Purpose | Typical Format |
|---|---|---|
| Platform objective manifest | Defines the platform purpose, environmental domains, decision uses, users, and governance context. | YAML, Markdown, architecture record |
| Source inventory | Lists datasets, feeds, APIs, models, geospatial layers, field programs, and administrative records. | CSV, SQL table, metadata catalog |
| Metadata schema | Defines required fields for source, method, unit, temporal scope, spatial reference, provenance, uncertainty, and access. | JSON Schema, YAML, data catalog profile |
| Semantic crosswalk | Maps variables, units, vocabularies, classifications, and domain terms across sources. | CSV, ontology, RDF/OWL, lookup table |
| Lineage and provenance policy | Defines how source-to-output transformations are tracked and exposed. | YAML, lineage graph, workflow metadata, audit log |
| Workflow registry | Documents transformations, indicators, models, scenario workflows, and update cadences. | YAML, DAG, notebook index, workflow orchestration metadata |
| Model and scenario registry | Documents model versions, assumptions, inputs, calibration, outputs, limitations, and scenario definitions. | Model cards, scenario table, reproducibility record |
| Decision-support specification | Maps users, questions, evidence depth, interface needs, scenario tools, and action pathways. | Design document, user-role matrix, dashboard specification |
| Access and stewardship policy | Defines who can publish, modify, access, review, and approve platform evidence. | Governance policy, permissions model, stewardship register |
| Public evidence package | Makes platform outputs, methods, caveats, and decisions reviewable where public accountability matters. | HTML report, open dataset, documentation site, audit bundle |
The implementation goal is to make environmental evidence reusable without making it contextless. Users should be able to discover data, understand its meaning, inspect how it was transformed, compare it with compatible sources, use it in models or decision tools, and review the assumptions that connect it to action.
Research-Grade Framing: Platforms as Infrastructures of Environmental Intelligence
A research-grade understanding of environmental data platforms begins by treating them as infrastructures of environmental intelligence rather than as passive back ends. Platforms determine which datasets can be discovered, which can be joined, which metadata survive ingestion, which temporal and spatial comparisons become possible, and which outputs become visible to users. In that sense, a platform shapes not only access, but the conditions under which environmental evidence becomes thinkable enough to support institutional judgment.
This is why platforms are epistemically consequential. They do not simply pass measurements from sensors, satellites, models, field teams, or administrative systems into storage. They impose structure. They align time and space, preserve or lose provenance, translate variables into common formats, and determine whether different pieces of environmental evidence can appear in the same analytic frame. A platform organized for cross-domain comparison produces a different kind of intelligence from one organized solely for program-specific reporting. A platform designed for open reuse produces different evidentiary possibilities from one optimized only for internal process control.
Decision support systems intensify this role because they add explicit interpretive frames. They influence how uncertainty is visualized, which scenarios are compared, what thresholds trigger attention, which indicators are foregrounded, and how complex environmental systems are rendered into manageable decision spaces. A platform without decision support may preserve evidence without helping users reason. A decision-support layer without a strong platform may simplify aggressively while severing itself from evidentiary discipline. The strongest systems join durable evidence with structured judgment.
| Limited Pattern | Stronger Pattern | Why the Shift Matters |
|---|---|---|
| Store environmental datasets | Preserve datasets with metadata, lineage, quality, and reuse conditions | Makes evidence interpretable beyond its original collection context |
| Expose APIs and downloads | Expose services with semantic documentation and workflow examples | Turns access into practical reuse |
| Aggregate data by program | Integrate data by environmental question, geography, system, and decision context | Supports cross-domain reasoning rather than siloed reporting |
| Display outputs in dashboards | Connect dashboards to provenance, uncertainty, models, scenarios, and action logic | Moves from awareness to decision support |
| Run models as black boxes | Maintain model cards, assumptions, calibration, input lineage, and scenario definitions | Prevents model outputs from appearing more certain than they are |
| Publish platform outputs | Make platform evidence reviewable, auditable, and accountable | Strengthens trust and public legitimacy |
Environmental intelligence is not a property of data volume. It is a property of evidence structure. Platforms become intelligent when they preserve meaning, context, uncertainty, and decision relevance across the full evidence chain.
Formal Model: Integration, Provenance, Uncertainty, and Decision Quality
A useful formal model separates data availability, metadata completeness, semantic compatibility, provenance, uncertainty visibility, analytical readiness, and decision fit. Let \(D_i\) represent dataset \(i\), \(M_i\) metadata completeness, \(S_i\) semantic compatibility, \(P_i\) provenance completeness, \(U_i\) uncertainty visibility, \(A_i\) analytical readiness, and \(F_i\) decision fit. Platform value depends on more than whether a dataset exists.
R_{\mathrm{reuse}} = f(M, S, P, U, A)
\]
Interpretation: Reuse readiness depends on metadata completeness, semantic compatibility, provenance, uncertainty visibility, and analytical readiness. Accessible data are not automatically reusable evidence.
C_{\mathrm{integration}} = \frac{N_{\mathrm{compatible\ joins}}}{N_{\mathrm{attempted\ joins}}}
\]
Interpretation: Integration coherence measures how often datasets can be joined or compared without unit, temporal, spatial, or semantic conflicts.
P_{\mathrm{lineage}} = \frac{N_{\mathrm{traceable\ outputs}}}{N_{\mathrm{platform\ outputs}}}
\]
Interpretation: Lineage completeness measures whether platform outputs can be traced back to source data and transformations.
U_{\mathrm{visibility}} = \frac{N_{\mathrm{uncertainty\ labeled}}}{N_{\mathrm{modeled\ or\ estimated\ outputs}}}
\]
Interpretation: Uncertainty visibility measures whether modeled, estimated, interpolated, or scenario-dependent outputs are clearly distinguished from direct observations.
Q_{\mathrm{decision}} = w_1R_{\mathrm{reuse}} + w_2C_{\mathrm{integration}} + w_3P_{\mathrm{lineage}} + w_4U_{\mathrm{visibility}} + w_5F_{\mathrm{decision}}
\]
Interpretation: Decision-support quality depends on reuse readiness, integration coherence, lineage completeness, uncertainty visibility, and fit to the decision context.
G_{\mathrm{governance}} = g(S_t, V, R, A, C)
\]
Interpretation: Platform governance depends on stewardship \(S_t\), versioning \(V\), review \(R\), access control \(A\), and corrective accountability \(C\). Technical architecture and governance architecture are inseparable.
This formal structure helps distinguish data availability from evidentiary readiness. A platform may have many datasets and still be weak if metadata are incomplete, semantic joins are unreliable, lineage is opaque, uncertainty is hidden, or decision tools are poorly aligned with user needs.
What Are Environmental Data Platforms and Decision Support Systems?
Environmental data platforms are structured systems for ingesting, storing, cataloging, harmonizing, exposing, and managing environmental information from multiple sources. Decision support systems are the analytical, comparative, and interface layers that help users explore those data, test assumptions, compare options, assess scenarios, interpret trends, evaluate uncertainty, and support action. The two are deeply related: the platform provides the evidentiary substrate, while the decision-support layer organizes that substrate around questions of judgment.
Such systems may include data stores and metadata catalogs for observations, models, forecasts, geospatial layers, administrative records, and derived environmental products; APIs, search services, and interoperability layers for discovery and reuse; geospatial environments for mapping, overlay, comparison, and spatial reasoning; analytical workflows linking observations to models, indicators, forecasts, and scenarios; dashboards, alerts, reports, and scenario tools for user-facing interpretation; and governance structures for provenance, quality, versioning, access, review, and stewardship.
The defining feature of these systems is not that they hold information, but that they organize environmental evidence into a form that can support comparison, explanation, and choice. A repository can preserve records. A platform can connect them. A decision-support system can frame those connected records within a concrete question: where risk is emerging, how conditions are changing, what alternatives are available, which tradeoffs are acceptable, which assumptions remain uncertain, and what action or review is justified.
| Capability | Platform Function | Decision-Support Function |
|---|---|---|
| Discovery | Makes data findable through catalog, metadata, API, and search. | Helps users identify relevant evidence for a specific question. |
| Integration | Aligns sources across format, units, time, space, and semantics. | Allows users to compare conditions, risks, scenarios, and alternatives. |
| Provenance | Tracks where data came from and how they were transformed. | Lets users judge evidentiary strength and limitations. |
| Analytics | Runs indicators, models, workflows, forecasts, and transformations. | Frames results around planning, operations, regulation, or public choice. |
| Interface | Provides services, datasets, and outputs to applications. | Presents maps, dashboards, reports, scenarios, alerts, and explanations. |
| Governance | Defines stewardship, access, versioning, quality, and review. | Connects evidence to accountable decision pathways. |
A mature environmental data platform does not replace judgment. It makes judgment better structured, better documented, and more accountable.
Why Environmental Data Platforms Matter
Environmental data platforms matter because environmental evidence rarely begins in a coherent form. Observations arrive unevenly across institutions, formats, standards, and time scales. Without platforms that preserve meaning while enabling integration, users encounter a landscape of disconnected datasets rather than a usable environmental evidence system. Environmental management then becomes a matter of hunting for fragments rather than reasoning with structured knowledge.
They also matter because environmental decisions are almost always multi-source and multi-scalar. A flood-management decision may depend on stream observations, forecast rainfall, land cover, infrastructure exposure, and scenario analysis. An ecosystem-restoration decision may require habitat layers, water-quality trends, land-use history, ecological indicators, and modeled futures. A climate-risk assessment may combine observations, projections, socioeconomic exposure, and uncertainty bounds. A compliance decision may require facility records, geospatial context, inspection history, emissions or discharge data, and legal thresholds. No single source can carry these questions on its own. Platforms provide the architecture within which heterogeneous evidence can be made commensurable enough to support judgment.
Most importantly, platforms matter because they shape the relationship between information and action. Data do not decide. Decision support systems help structure environmental choice by clarifying relevant variables, preserving provenance, surfacing tradeoffs, comparing scenarios, and linking evidence to operational or policy context. The difference between information availability and decision quality is one of the most important distinctions in environmental governance, and platforms sit precisely at that boundary.
| Need | Platform Contribution | Risk Without a Strong Platform |
|---|---|---|
| Environmental evidence integration | Connects observations, models, geospatial layers, indicators, and administrative records. | Evidence remains fragmented across programs, agencies, and formats. |
| Decision readiness | Transforms source data into indicators, scenarios, alerts, and interpretable outputs. | Users have access to data but not to decision support. |
| Trust and accountability | Preserves provenance, quality, versioning, and uncertainty. | Users cannot reconstruct how conclusions were produced. |
| Cross-scale reasoning | Supports comparisons across sites, watersheds, regions, ecosystems, and time horizons. | Local and system-level evidence cannot be meaningfully connected. |
| Scenario analysis | Links data to models, alternatives, tradeoffs, and future conditions. | Planning is based on static reporting rather than structured choice. |
| Reuse and learning | Makes evidence discoverable, reusable, and reviewable across decisions. | Each decision requires rebuilding evidence from scratch. |
Platforms matter because environmental decision-making depends on structured evidence, not merely on data existence.
Core Components of Environmental Data Platforms
Environmental data platforms typically integrate several interdependent components. These parts are not independent conveniences. Their value arises from coordination. A large archive without metadata is difficult to trust or reuse. A dashboard without provenance can appear authoritative while obscuring uncertainty. A model without clear lineage may be analytically sophisticated yet institutionally weak. Environmental platforms become meaningful when they preserve a legible evidentiary chain from source to decision context.
| Component | Function | Design Risk |
|---|---|---|
| Data ingestion | Brings in observational, geospatial, modeled, administrative, forecast, and derived environmental data. | Schema drift, duplicate records, stale feeds, invalid timestamps |
| Metadata and cataloging | Preserves dataset identity, provenance, temporal scope, spatial reference, units, methods, quality, and discoverability. | Data remain accessible but ambiguous. |
| Storage and access | Provides repositories, APIs, services, indexes, access control, versioning, and retrieval mechanisms. | Data silos, ungoverned copies, weak version control, security gaps |
| Integration and harmonization | Aligns data across formats, units, variables, spatial frames, temporal scales, and institutional boundaries. | Technical joins that produce semantic confusion. |
| Analytics and modeling | Generates summaries, indicators, forecasts, simulations, scenarios, stress tests, and classifications. | Opaque workflows, unsupported inference, unmarked model dependence |
| Geospatial services | Supports mapping, overlay, spatial query, tiling, layer services, and geographic reasoning. | Scale mismatch, CRS inconsistency, outdated layers, hidden spatial uncertainty |
| User-facing decision support | Provides dashboards, maps, alerts, reports, scenario tools, and explanatory interfaces. | Visual clarity without evidence depth or action relevance. |
| Governance and stewardship | Defines roles, ownership, quality expectations, review cycles, access, and accountability. | Platform drift, unreviewed outputs, weak public trust |
A platform is only as strong as the evidence chain it preserves across these components. If any layer loses meaning, the decision-support layer inherits that weakness.
Key Analytical Distinctions
A data platform is not the same as a database. A database stores records; a platform structures discovery, metadata, integration, governance, access, and reuse across a broader environmental evidence system.
A dashboard is not the same as a decision support system. Visualization can improve awareness, but decision support also requires scenario logic, uncertainty handling, provenance, comparison design, and connection to action.
Technical interoperability is not the same as semantic coherence. Systems may exchange files or API responses successfully while still disagreeing about units, variable definitions, temporal alignment, lineage, or scale.
Model output is not the same as observation. Models extend evidence, but their outputs depend on assumptions, parameterization, boundary conditions, training data, calibration context, and scenario design.
Access is not the same as usability. Open data can remain practically unusable if metadata, documentation, API design, examples, query patterns, or workflow integration are weak.
More data is not the same as better judgment. Decision quality depends on relevance, structure, interpretability, uncertainty awareness, and institutional fit, not volume alone.
Information availability is not the same as decision capacity. Institutions may possess data while still lacking the governance, tools, staff capacity, and workflows required to convert it into action.
| Distinction | Why It Matters | Design Implication |
|---|---|---|
| Database versus platform | Storage alone does not create reusable evidence. | Design catalog, metadata, APIs, lineage, and governance as first-class capabilities. |
| Dashboard versus decision support | Visual awareness is not the same as structured choice. | Connect dashboards to scenarios, uncertainty, action rules, and review pathways. |
| Interoperability versus meaning | Data exchange can succeed while interpretation fails. | Maintain semantic crosswalks, unit registries, and variable definitions. |
| Observation versus inference | Measured, modeled, estimated, and projected outputs carry different evidentiary status. | Label evidence type and uncertainty in user-facing systems. |
| Access versus reuse | Data can be downloadable yet practically unusable. | Provide metadata, examples, query patterns, and workflow documentation. |
| Information versus capacity | Data do not create action without institutional processes. | Design decision workflows, roles, review cycles, and feedback loops. |
These distinctions keep platforms from becoming impressive data estates that remain weak evidence systems.
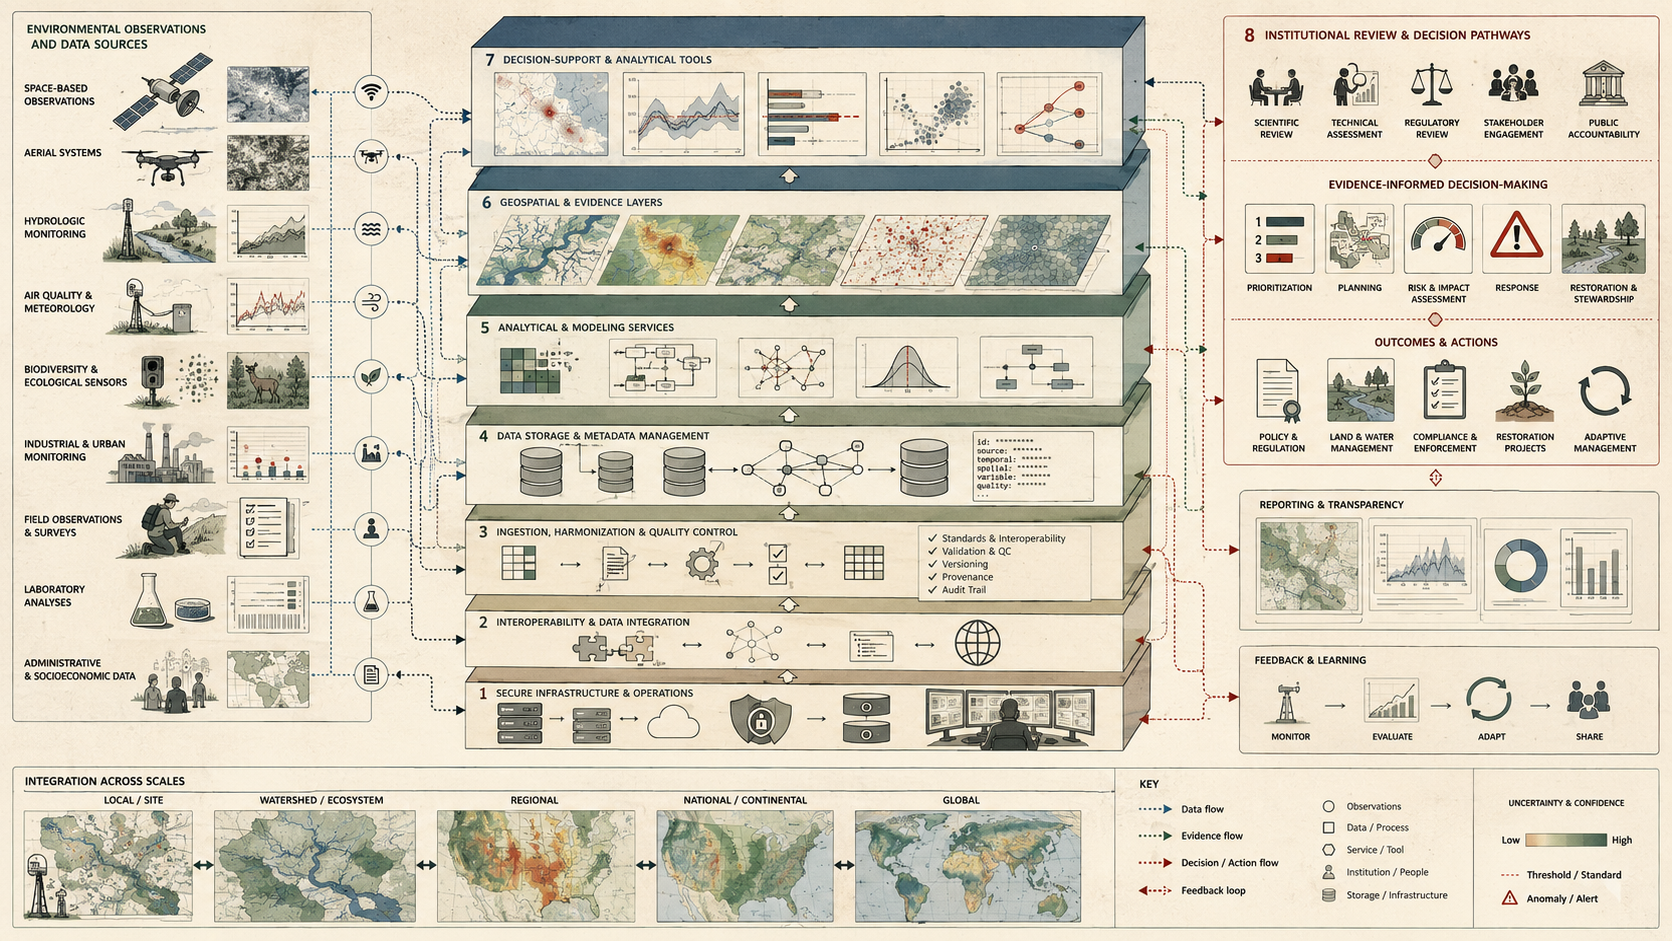
System Architecture: From Data Source to Decision Context
Environmental data platforms and decision support systems operate as layered evidentiary architectures. Each layer transforms evidence: source systems produce records, ingestion pipelines validate them, metadata layers preserve meaning, integration services align them, analytical layers generate indicators and scenarios, interface layers present them, and users interpret them within decision contexts. The system fails when these transformations become invisible or unreviewable.
| Layer | Transformation | Failure Risk |
|---|---|---|
| Source layer | Sensors, field systems, remote-sensing products, models, forecasts, and administrative datasets generate inputs. | Inputs lack ownership, method clarity, or quality information. |
| Ingestion layer | Pipelines collect, transform, standardize, and register incoming information. | Schema drift, duplicate records, unit errors, missing timestamps. |
| Metadata layer | Records are described by source, method, time, space, lineage, and reuse conditions. | Data become findable but not interpretable. |
| Integration layer | Data are aligned across variables, places, scales, and times. | Semantically incompatible records are compared as though equivalent. |
| Analytical layer | Summaries, indicators, scenarios, forecasts, and comparative outputs are generated. | Users see outputs without knowing assumptions or uncertainty. |
| Decision interface layer | Maps, dashboards, reports, and tools present evidence in user-relevant form. | Interface design creates false clarity or hides important context. |
| Action layer | Planners, regulators, scientists, operators, and communities use outputs for choice, coordination, and accountability. | Evidence fails to connect to actual decision rights and responsibilities. |
| Learning layer | Outcomes, feedback, audits, and event reviews update the platform and its workflows. | The platform repeats errors and accumulates stale assumptions. |
This architecture matters because environmental intelligence is assembled rather than merely received. A raw sensor stream, a geospatial layer, a projection model, and a decision interface are not isolated achievements. They are links in one evidentiary chain. The strength of the system depends on whether that chain remains interpretable and trustworthy from source to user.
Data Integration, Metadata, and Semantic Coherence
One of the hardest problems in environmental platforms is integration. Environmental information comes from sources that differ in temporal resolution, spatial reference, variable naming, units, collection methods, uncertainty structures, quality controls, and institutional purpose. Integration is therefore not only a technical challenge of parsing and loading. It is a semantic challenge of deciding when two records refer to comparable environmental phenomena, when they can be aligned, and what contextual detail is necessary for their meaning to survive integration.
Metadata are central because they preserve the conditions of interpretation. Without provenance, calibration history, temporal reference, spatial frame, method, data quality, lineage, and uncertainty context, environmental data may remain accessible while becoming scientifically ambiguous. Metadata are not a bureaucratic supplement to “real data.” They are part of what makes environmental evidence interpretable at all.
Semantic coherence matters as much as metadata completeness. Two datasets may exchange successfully and still fail to align meaningfully if they use inconsistent definitions, incompatible scales, different sampling methods, or different derivation logic. Platforms are strongest when they preserve not only transport and storage, but stable meaning across heterogeneous evidence sources. This is one reason environmental data governance emphasizes FAIR principles: not because findability and access are sufficient, but because they are preconditions for disciplined reuse and integration.
| Requirement | Question | Evidence Needed |
|---|---|---|
| Unit coherence | Are values comparable after unit conversion? | Unit registry, conversion rules, validation tests |
| Temporal alignment | Do records refer to compatible time windows, timestamps, or sampling periods? | Time-zone policy, event-time and ingestion-time fields, aggregation rules |
| Spatial coherence | Do geospatial layers use compatible resolution, extent, CRS, and positional accuracy? | Layer metadata, CRS record, resolution, spatial uncertainty |
| Variable definition | Do two sources mean the same thing by the same variable name? | Data dictionary, controlled vocabulary, semantic crosswalk |
| Method compatibility | Are differences in sampling, modeling, classification, or reporting documented? | Method metadata, source notes, derivation logic |
| Lineage preservation | Can integrated outputs be traced back to source records and transformations? | Lineage graph, workflow manifest, transformation logs |
Integration is successful only when environmental meaning survives the journey from source to platform to decision tool.
Models, Scenarios, and the Architecture of Environmental Choice
Decision support systems become especially valuable when they connect environmental data to models and scenario logic. Models can estimate unmeasured conditions, extend observation, simulate likely consequences, compare management alternatives, and reveal non-obvious tradeoffs under different assumptions. Scenario tools let users ask not only what is happening, but what could happen if conditions shift, interventions are applied, risks escalate, or governance choices differ.
This is a core reason decision support differs from static reporting. Static reporting summarizes past or present conditions. Decision support structures choices under uncertainty. It asks which alternatives deserve comparison, which consequences matter, which assumptions are driving results, and how plausible futures differ in cost, exposure, resilience, ecological condition, public health, or environmental effect.
But models also introduce interpretive risk. They are not neutral carriers of truth. They simplify, parameterize, interpolate, extrapolate, and sometimes embed normative assumptions about what counts as success or failure. Strong decision support systems therefore make a sharp distinction among measured data, modeled estimates, scenario outputs, and hypothetical futures. They are most trustworthy when users can see where observation ends, where inference begins, and where scenario logic introduces conditional rather than descriptive knowledge.
| Model/Scenario Element | Question | Evidence Needed |
|---|---|---|
| Input lineage | Which data sources feed the model or scenario? | Input registry, source timestamps, data-quality flags |
| Model assumptions | What simplifications and parameter choices shape the output? | Model card, assumption log, parameter table |
| Calibration and validation | How was the model tested against observed evidence? | Validation report, benchmark results, residual diagnostics |
| Scenario definition | What condition, intervention, or future pathway does the scenario represent? | Scenario registry, scenario narrative, boundary conditions |
| Uncertainty | How uncertain are model outputs and scenario comparisons? | Confidence intervals, sensitivity analysis, uncertainty bands |
| Decision relevance | What choice does the model or scenario support? | Decision-use statement, user-role map, action pathway |
Models and scenarios should expand environmental reasoning without severing evidence from provenance. Their value depends on whether users can understand what is observed, what is inferred, what is assumed, and what remains uncertain.
Dashboards, Maps, and Human-Centered Decision Support
User-facing interfaces are where environmental platforms become cognitively and institutionally real. Maps, dashboards, reports, scenario tools, and query interfaces can reveal patterns, thresholds, tradeoffs, and options in forms that support rapid orientation. But interface design is not a cosmetic final layer. It is part of the decision architecture because it determines what users notice, compare, question, and treat as actionable.
A strong interface helps users move from awareness to judgment by making assumptions, scales, uncertainty, and provenance visible enough to guide reasoning. A weak interface can create apparent clarity while hiding data gaps, model dependence, semantic instability, or uncertainty. Human-centered decision support therefore requires more than attractive visualization. It requires careful alignment between the structure of the interface and the structure of the decision question.
The best systems do not simply visualize everything available. They organize evidence around user tasks, temporal horizons, operational needs, and the possibility of drilling back from summary to source. This movement between overview and lineage is one of the clearest differences between a superficial dashboard and a mature decision-support system.
| User Role | Primary Question | Decision-Support Requirement |
|---|---|---|
| Emergency responder | Where is risk emerging and what action is needed now? | Low-latency data, map overlays, alerts, response status, source freshness |
| Planner | How do future scenarios compare across risk, cost, resilience, and environmental impact? | Scenario tools, model assumptions, uncertainty, long-term trends |
| Regulator | Which facilities, regions, or patterns require review? | Compliance records, inspection history, geospatial context, audit trail |
| Scientist or analyst | What evidence supports the output and how was it produced? | Source data, metadata, lineage, reproducible workflows, export tools |
| Infrastructure operator | Which assets or systems are approaching operational thresholds? | Asset layers, monitoring feeds, alerts, failure modes, escalation rules |
| Community user | What is happening locally and who is affected? | Plain language, exposure maps, local relevance, public evidence, accessibility |
| Public communicator | How can environmental conditions be explained accurately and responsibly? | Verified summaries, caveats, visuals, source links, uncertainty language |
A decision-support system should be designed around the user’s environmental judgment task. Without that alignment, even high-quality data can be presented in ways that do not improve decisions.
Uncertainty, Provenance, and Trust
Environmental data platforms and decision support systems are trustworthy only when they preserve enough provenance and uncertainty to keep users oriented to the limits of the evidence. Environmental information frequently combines direct measurements, interpolated surfaces, modeled estimates, classifications, forecasts, administrative records, and scenario outputs. If these are presented as though they carry identical evidentiary status, the system may become persuasive while weakening judgment.
Provenance matters because users need to know where a value came from, how it was processed, what model or workflow touched it, what version generated it, and under what assumptions it can be interpreted. Uncertainty matters because environmental choice almost always takes place under incomplete knowledge, contested thresholds, changing conditions, and uneven data coverage. Decision support does not eliminate uncertainty; it organizes action under uncertainty.
Trust is therefore not produced by interface polish, cloud infrastructure, or technological sophistication alone. It is produced when a platform keeps the evidence chain inspectable enough that users can understand both what is known and what remains conditional, estimated, modeled, projected, or uncertain. In this sense, provenance and uncertainty are not obstacles to decision support. They are part of what makes decision support intellectually honest.
| Evidence Status | Meaning | Required Platform Context |
|---|---|---|
| Measured | Direct observation from a sensor, field record, monitoring station, or verified measurement process. | Timestamp, unit, instrument/source, calibration or quality flag, location |
| Modeled | Output produced by a model using inputs, assumptions, parameters, and calibration. | Model version, inputs, assumptions, validation, uncertainty |
| Estimated | Derived value based on incomplete data, proxy variables, or statistical estimation. | Estimation method, confidence, source coverage, limitations |
| Interpolated | Spatial or temporal value inferred between observations. | Interpolation method, source density, resolution, uncertainty |
| Forecast | Prediction of future conditions based on models and current or historical data. | Forecast horizon, model version, confidence, update time |
| Scenario | Conditional future pathway based on assumptions or interventions. | Scenario definition, assumptions, boundary conditions, comparison logic |
| Administrative | Record produced through reporting, permitting, inspection, or institutional process. | Reporting period, authority, scope, data caveats, revision status |
Trustworthy platforms do not hide uncertainty to appear more decisive. They preserve uncertainty so that decisions can be made with appropriate humility and accountability.
Governance, FAIR Data, and Evidentiary Accountability
Environmental data platforms have a governance dimension because they shape what environmental evidence can be found, shared, compared, reused, modeled, challenged, and acted upon across institutions. Governance determines access rules, metadata expectations, versioning discipline, stewardship obligations, platform roles, data quality requirements, public transparency, and the conditions under which evidence remains durable enough for science, operations, and policy.
This is why FAIR-style principles matter, but also why they are only a starting point. Findability, accessibility, interoperability, and reusability are necessary conditions for strong environmental platforms, yet they do not by themselves guarantee semantic coherence, model transparency, justice-sensitive interpretation, or good decision support. Governance must reach further: into lineage, stewardship, validation, update practices, data rights, public review, and the preservation of methodological context as data move across systems.
Evidentiary accountability ultimately depends on whether the platform preserves a legible chain from source to decision. If that chain is strong, environmental intelligence can scale without collapsing into opacity. If it is weak, even abundant and openly shared information may fail to support trustworthy judgment. Platform governance is therefore not peripheral administration. It is part of the epistemic foundation of environmental action.
| Governance Responsibility | Question | Evidence |
|---|---|---|
| Stewardship | Who is responsible for source data, metadata, quality, and updates? | Owner registry, stewardship policy, update cadence |
| Metadata governance | What metadata are required before data become reusable? | Metadata schema, completeness checks, catalog policy |
| Versioning | Can users reconstruct which dataset, model, or workflow produced an output? | Version registry, release notes, reproducibility record |
| Access and rights | Who can access, publish, modify, or reuse platform evidence? | Access policy, permissions model, data-use terms |
| Model governance | Are assumptions, limitations, and validation records visible? | Model card, validation report, scenario registry |
| Public accountability | Can affected publics or external reviewers understand and challenge platform outputs? | Public evidence package, source links, plain-language notes, audit trail |
| Feedback and correction | Does the platform improve when errors, gaps, or harms are identified? | Issue log, corrective-action record, governance review |
A platform’s governance model is part of its knowledge model. Without stewardship, lineage, review, and accountability, environmental intelligence becomes fragile even when the technical stack is sophisticated.
Failure Modes, Fragmentation, and Platform Risk
Environmental platforms can fail in ways subtler than instrument failure but no less consequential. Data may ingest successfully while losing key metadata. Schemas may drift while APIs remain live. Dashboards may continue updating while uncertainty handling erodes. Cross-agency integration may appear complete while semantic mismatches distort comparison. Models may be reused outside their valid domain. A platform can therefore create the appearance of environmental intelligence while quietly weakening interpretability.
Fragmentation is one of the most persistent platform risks. Different programs may maintain separate standards, data stores, access rules, and decision tools, making integrated reasoning difficult even when total data volume is large. In these situations, institutions often have more information than intelligence. They possess many pieces of evidence without an architecture that can place those pieces into a coherent analytic frame.
Another risk is dashboardism: the substitution of visual reporting for genuine decision support. A system can expose many indicators, maps, and charts while remaining weak at scenario comparison, provenance, semantic stability, uncertainty communication, or actionability. Platforms become strongest when they are designed not merely to display environmental information, but to support environmental reasoning under real institutional constraints.
| Failure Mode | Consequence | Prevention |
|---|---|---|
| Metadata loss | Data remain accessible but lose interpretive context. | Require metadata validation before ingestion or publication. |
| Schema drift | APIs remain live while field meanings, units, or structures change. | Use schema versioning, compatibility tests, and release notes. |
| Semantic mismatch | Technically joined datasets produce invalid comparisons. | Maintain semantic crosswalks, unit registries, and domain review. |
| Opaque transformation | Users cannot reconstruct how outputs were produced. | Track lineage, workflow versions, and transformation manifests. |
| Model overreach | Models are used outside valid assumptions or domains. | Maintain model cards, domain limits, and validation reports. |
| Dashboardism | Visual reporting substitutes for decision support. | Design around decisions, scenarios, uncertainty, and action logic. |
| Fragmented governance | Data ownership and stewardship remain unclear across agencies or programs. | Define stewardship roles, access policies, and review processes. |
| Accountability gap | Platform outputs influence decisions but cannot be reviewed or challenged. | Publish evidence packages, audit trails, and public documentation. |
The deepest platform risk is mistaking availability for intelligence. A platform succeeds only when data can be understood, reused, questioned, and connected to responsible action.
Future Directions
The future of environmental data platforms and decision support systems lies in stronger interoperability, richer metadata, more explicit semantic frameworks, scenario-aware analytics, better geospatial integration, and more disciplined treatment of uncertainty and provenance. The most important progress is likely to come not simply from larger cloud infrastructures or faster dashboards, but from platforms that make cross-domain environmental reasoning more durable, more transparent, and more reusable across institutions and timescales.
Artificial intelligence will likely intensify the need for strong data platforms rather than reduce it. AI systems may help classify Earth-observation imagery, detect anomalies, summarize evidence, recommend scenarios, search metadata, generate analytical narratives, or assist decision workflows. But these tools require well-governed data, labeled uncertainty, documented lineage, model transparency, and reviewable outputs. AI-ready environmental intelligence depends on platform discipline. Without that discipline, automated summaries and recommendations can amplify weak metadata, hidden bias, or unsupported inference.
The deeper challenge is not simply to make more environmental data available. It is to build systems that remain semantically coherent, operationally useful, and evidentially trustworthy as data volume, model complexity, and institutional dependence all increase. Future platforms will need better support for lineage, model transparency, interoperable vocabularies, uncertainty-aware interfaces, environmental justice overlays, public evidence packages, and decision workflows that do not erase complexity but render it manageable without falsifying it.
Environmental platforms are often described as information infrastructure, but their real role is larger. They determine how environmental evidence is assembled, how alternative futures are compared, how uncertainty is surfaced, and how knowledge travels into action. Where they are well designed, environmental data platforms and decision support systems turn fragmented observations into coherent judgment. Where they are weakly designed, they risk turning data abundance into interpretive confusion and procedural delay. In that sense, they are not merely repositories or applications. They are infrastructures for deciding what environmental evidence can mean in practice and how responsibly that meaning can guide action.
Deployment Readiness Gate
Before an environmental data platform or decision support system is used for operational response, public communication, regulatory review, planning, modeling, funding, or accountability, it should pass a deployment readiness gate. This gate should test whether the system is technically reliable, semantically coherent, evidence-preserving, user-appropriate, and governance-ready.
| Readiness Area | Required Question | Pass Evidence |
|---|---|---|
| Purpose readiness | Is the platform purpose and decision context clearly defined? | Platform objective manifest, user-role matrix, decision-use map |
| Source readiness | Are data sources documented, owned, fresh, and quality-flagged? | Source inventory, owner registry, update schedule, QA/QC report |
| Metadata readiness | Do datasets include required source, method, spatial, temporal, unit, and provenance metadata? | Metadata completeness report, catalog validation |
| Semantic readiness | Can datasets be integrated without unit, scale, definition, or temporal mismatch? | Semantic crosswalk, unit registry, compatibility tests |
| Lineage readiness | Can outputs be traced back to source data and transformations? | Lineage graph, workflow manifest, transformation log |
| Model readiness | Are model assumptions, validation, inputs, limitations, and uncertainty documented? | Model cards, validation report, scenario registry |
| Decision-support readiness | Are user interfaces aligned with real decision tasks and evidence depth needs? | User testing, dashboard specification, scenario workflow, action logic |
| Governance readiness | Are stewardship, access, versioning, review, and public accountability defined? | Governance policy, access controls, audit trail, public evidence process |
This readiness gate prevents platforms from being deployed merely because they can store and display data. The stronger standard is whether they preserve meaning and support responsible environmental judgment.
Data and Configuration Artifacts
A reproducible environmental data platform workflow should include explicit artifacts for sources, metadata, semantic mappings, quality rules, workflows, models, scenarios, decision-support views, access policies, and governance review. These artifacts make the platform auditable and reusable across projects, agencies, and decisions.
| Artifact | Purpose | Suggested Path |
|---|---|---|
| Platform objective manifest | Defines platform purpose, environmental domains, users, decision uses, and governance context. | config/platform_objective.yml |
| Source inventory | Lists feeds, datasets, APIs, models, geospatial layers, and owners. | data/source_inventory.csv |
| Metadata schema | Defines required metadata fields for platform evidence. | schemas/environmental_dataset.schema.json |
| Semantic crosswalk | Maps variables, units, domains, and definitions across sources. | data/semantic_crosswalk.csv |
| Data-quality rules | Defines validation checks for units, ranges, timestamps, missingness, and geospatial validity. | config/data_quality_rules.yml |
| Workflow registry | Documents transformations, indicators, models, and decision-support outputs. | data/workflow_registry.csv |
| Model and scenario registry | Documents model versions, assumptions, validation, scenario definitions, and output use. | data/model_scenario_registry.csv |
| Decision-support matrix | Maps users, questions, evidence depth, outputs, and action pathways. | data/decision_support_matrix.csv |
| Governance log | Tracks stewardship, review decisions, access changes, and corrective actions. | data/platform_governance_log.csv |
These artifacts make the platform more than a technical environment. They make it an inspectable evidence system.
Mathematical Lens: Integration Quality, Reuse Readiness, Uncertainty, and Decision Support
Several simple metrics can help evaluate platform quality. These metrics are not substitutes for domain expertise, governance review, or user testing, but they make platform assumptions visible.
M_{\mathrm{complete}} = \frac{N_{\mathrm{required\ metadata\ fields\ complete}}}{N_{\mathrm{required\ metadata\ fields}}}
\]
Interpretation: Metadata completeness measures whether datasets carry the source, method, unit, time, space, provenance, and uncertainty information needed for reuse.
C_{\mathrm{semantic}} = \frac{N_{\mathrm{semantically\ compatible\ fields}}}{N_{\mathrm{mapped\ fields}}}
\]
Interpretation: Semantic compatibility measures how many mapped variables can be compared without definition, unit, temporal, or spatial conflict.
P_{\mathrm{lineage}} = \frac{N_{\mathrm{traceable\ outputs}}}{N_{\mathrm{platform\ outputs}}}
\]
Interpretation: Lineage completeness measures whether indicators, models, dashboards, and reports can be traced back to source data and transformations.
U_{\mathrm{visibility}} = \frac{N_{\mathrm{uncertainty\ labeled}}}{N_{\mathrm{modeled\ estimated\ or\ scenario\ outputs}}}
\]
Interpretation: Uncertainty visibility measures whether modeled, estimated, interpolated, forecast, or scenario-based outputs are clearly labeled for users.
F_{\mathrm{decision}} = \frac{N_{\mathrm{decision\ questions\ supported}}}{N_{\mathrm{priority\ decision\ questions}}}
\]
Interpretation: Decision fit measures whether the platform actually supports the priority questions users need to answer.
Q_{\mathrm{platform}} = w_1M_{\mathrm{complete}} + w_2C_{\mathrm{semantic}} + w_3P_{\mathrm{lineage}} + w_4U_{\mathrm{visibility}} + w_5F_{\mathrm{decision}}
\]
Interpretation: Overall platform evidence quality can be approximated as a weighted combination of metadata completeness, semantic compatibility, lineage, uncertainty visibility, and decision fit.
These measures evaluate the platform as an evidence system rather than as a storage system. They ask whether data can be interpreted, integrated, traced, qualified, and used for actual environmental decisions.
Python Workflow: Platform Evidence Quality and Decision-Support Readiness
A Python workflow can demonstrate how datasets and outputs might be evaluated for metadata completeness, semantic compatibility, lineage, uncertainty visibility, and decision fit. The purpose is not to create a universal platform score, but to keep the evidence-readiness dimensions visible.
from dataclasses import dataclass
from typing import List
import pandas as pd

@dataclass
class PlatformEvidenceAsset:
    asset_id: str
    domain: str
    asset_type: str
    metadata_complete: float
    semantic_compatibility: float
    lineage_complete: float
    uncertainty_visible: float
    decision_fit: float
    is_high_stakes: bool

def platform_evidence_quality(asset: PlatformEvidenceAsset) -> float:
    return (
        0.22 * asset.metadata_complete +
        0.20 * asset.semantic_compatibility +
        0.22 * asset.lineage_complete +
        0.18 * asset.uncertainty_visible +
        0.18 * asset.decision_fit
    )

def classify_review_priority(asset: PlatformEvidenceAsset, score: float) -> str:
    if asset.is_high_stakes and asset.lineage_complete < 0.85:
        return "high_stakes_lineage_review"
    if asset.metadata_complete < 0.75:
        return "metadata_completeness_review"
    if asset.semantic_compatibility < 0.70:
        return "semantic_integration_review"
    if asset.uncertainty_visible < 0.70:
        return "uncertainty_visibility_review"
    if asset.decision_fit < 0.70:
        return "decision_support_fit_review"
    if score < 0.75:
        return "platform_quality_review"
    return "routine_monitoring"

assets: List[PlatformEvidenceAsset] = [
    PlatformEvidenceAsset("streamflow-api-001", "water", "api_stream", 0.92, 0.88, 0.90, 0.86, 0.84, True),
    PlatformEvidenceAsset("flood-scenario-model-002", "flood", "model_output", 0.84, 0.78, 0.76, 0.62, 0.81, True),
    PlatformEvidenceAsset("habitat-layer-003", "biodiversity", "geospatial_layer", 0.68, 0.64, 0.55, 0.58, 0.70, False),
    PlatformEvidenceAsset("air-exposure-dashboard-004", "air_quality", "decision_view", 0.88, 0.82, 0.86, 0.90, 0.92, True),
    PlatformEvidenceAsset("compliance-records-005", "regulatory", "administrative_record", 0.80, 0.74, 0.82, 0.72, 0.76, True),
]

records = []
for asset in assets:
    score = platform_evidence_quality(asset)
    records.append({
        "asset_id": asset.asset_id,
        "domain": asset.domain,
        "asset_type": asset.asset_type,
        "platform_evidence_quality": round(score, 3),
        "metadata_complete": asset.metadata_complete,
        "semantic_compatibility": asset.semantic_compatibility,
        "lineage_complete": asset.lineage_complete,
        "uncertainty_visible": asset.uncertainty_visible,
        "decision_fit": asset.decision_fit,
        "review_priority": classify_review_priority(asset, score)
    })

df = pd.DataFrame(records)
print(df.sort_values(["review_priority", "platform_evidence_quality"]))
This workflow treats platform assets as governed evidence objects. A dataset or model output is not ready for decision support merely because it exists. It must be documented, semantically compatible, traceable, uncertainty-aware, and aligned with a decision use.
R Workflow: Metadata, Reuse, and Decision-Support Reporting
An R workflow can support platform governance by producing reusable reporting tables for metadata completeness, semantic integration, lineage status, uncertainty visibility, and decision-support readiness. This is especially useful for platform audits and evidence-readiness reviews.
library(dplyr)
library(readr)

platform_assets <- tribble(
  ~asset_id, ~domain, ~asset_type, ~metadata_complete, ~semantic_compatibility, ~lineage_complete, ~uncertainty_visible, ~decision_fit, ~high_stakes,
  "streamflow-api-001", "water", "api_stream", 0.92, 0.88, 0.90, 0.86, 0.84, TRUE,
  "flood-scenario-model-002", "flood", "model_output", 0.84, 0.78, 0.76, 0.62, 0.81, TRUE,
  "habitat-layer-003", "biodiversity", "geospatial_layer", 0.68, 0.64, 0.55, 0.58, 0.70, FALSE,
  "air-exposure-dashboard-004", "air_quality", "decision_view", 0.88, 0.82, 0.86, 0.90, 0.92, TRUE,
  "compliance-records-005", "regulatory", "administrative_record", 0.80, 0.74, 0.82, 0.72, 0.76, TRUE
)

platform_summary <- platform_assets %>%
  mutate(
    platform_evidence_quality = round(
      0.22 * metadata_complete +
      0.20 * semantic_compatibility +
      0.22 * lineage_complete +
      0.18 * uncertainty_visible +
      0.18 * decision_fit,
      3
    ),
    review_priority = case_when(
      high_stakes & lineage_complete < 0.85 ~ "high_stakes_lineage_review",
      metadata_complete < 0.75 ~ "metadata_completeness_review",
      semantic_compatibility < 0.70 ~ "semantic_integration_review",
      uncertainty_visible < 0.70 ~ "uncertainty_visibility_review",
      decision_fit < 0.70 ~ "decision_support_fit_review",
      platform_evidence_quality < 0.75 ~ "platform_quality_review", TRUE ~ "routine_monitoring" ) ) %>%
  arrange(review_priority, platform_evidence_quality)

print(platform_summary)

write_csv(
  platform_summary,
  "outputs/platform_evidence_quality_summary.csv"
)
The R workflow emphasizes that environmental platform governance can be made reportable. Metadata, semantics, lineage, uncertainty, and decision fit should be tracked as platform quality dimensions, not left as informal assumptions.
Systems Code: APIs, Metadata Registries, Decision Services, and Evidence Logs
Environmental data platforms and decision support systems are full-stack infrastructures. They include ingestion services, data stores, metadata catalogs, APIs, geospatial services, model registries, scenario engines, dashboards, identity systems, audit logs, and public evidence layers. A serious companion repository should therefore include both analytical workflows and systems-code scaffolding.
| Language / Tool | Role in Companion Repository | Example Use |
|---|---|---|
| Python | Evidence-quality scoring, metadata validation, API checks, workflow orchestration | Platform evidence-readiness workflow |
| R | Metadata and governance reporting, platform-quality summaries | Platform evidence-quality review tables |
| SQL | Source inventory, metadata catalog, workflow registry, scenario registry, governance log | Auditable platform database schema |
| Go | Lightweight platform API health and metadata service | Serve source status, metadata readiness, and platform health |
| Rust | Safe validation CLI for metadata schemas and semantic crosswalks | Validate source inventory and dataset metadata completeness |
| TypeScript | Decision-support interface type definitions and front-end scaffolding | Dataset cards, provenance panels, scenario selectors, decision views |
| C / C++ | Embedded or edge data-producer stubs for platform ingestion | Sensor sampling, local event buffering, source evidence records |
| MicroPython | Low-power field-device example feeding platform services | Environmental node producing structured platform-ready records |
| TinyML | On-device inference records with confidence and provenance | Local anomaly detection with evidence metadata |
| Bash | Repository setup, validation, reproducible runs, and push workflow | Run platform validation and generate outputs |
This breadth is appropriate because environmental decision support depends on the full evidence stack. The platform’s trustworthiness is shaped by ingestion, metadata, semantics, analytics, APIs, interfaces, governance, and operations together.
GitHub Repository
A companion repository for this article should translate the platform framework into reproducible technical scaffolding. The repository should include platform objective manifests, source inventories, metadata schemas, semantic crosswalks, data-quality rules, workflow registries, model and scenario registries, decision-support matrices, governance logs, Python and R workflows, SQL schemas, API service examples, and front-end type scaffolding.
Complete Code RepositoryThe companion repository provides reproducible examples for environmental data platforms and decision support systems, including platform evidence-quality scoring, metadata completeness checks, semantic integration review, lineage and uncertainty audits, decision-support fit assessment, source inventories, model/scenario registries, and multi-language systems scaffolding for environmental evidence infrastructure.
Testing and Validation
Testing environmental data platforms requires more than confirming that APIs return data or dashboards load. It requires validating metadata completeness, semantic compatibility, lineage, data quality, workflow reproducibility, model assumptions, access controls, uncertainty visibility, and decision-usefulness. A platform can be technically available and still be weak as an evidence system.
| Test Type | Purpose | Example Test |
|---|---|---|
| Ingestion validation | Ensure incoming data meet schema, timestamp, unit, and completeness requirements. | Reject records with invalid units, missing source ID, or malformed event time. |
| Metadata completeness test | Ensure datasets have required source, method, spatial, temporal, and provenance fields. | Validate catalog records against environmental metadata schema. |
| Semantic compatibility test | Ensure variables can be meaningfully compared or joined. | Check units, definitions, spatial resolution, temporal aggregation, and method compatibility. |
| Lineage reconstruction test | Ensure platform outputs can be traced back to inputs and transformations. | Reconstruct a dashboard indicator or scenario output from source records. |
| Model governance test | Ensure models include assumptions, validation, versioning, and uncertainty records. | Validate model cards and scenario registry before deployment. |
| Access-control test | Ensure platform permissions match stewardship and public-access rules. | Test role-based access for source, derived, sensitive, and public datasets. |
| Decision-support test | Ensure outputs support real user questions and do not overclaim certainty. | Scenario-based user testing by responder, planner, regulator, analyst, and community user. |
| Public accountability test | Ensure material platform outputs can be explained and reviewed. | Generate public evidence package with source links, methods, caveats, and review path. |
Validation should test the platform as a knowledge system. The decisive question is not only whether the platform works technically, but whether it preserves enough evidence discipline to support responsible decisions.
Operational Signals and Platform Observability
Environmental data platforms must observe themselves. A platform that monitors the environment but cannot monitor its own source feeds, metadata gaps, ingestion failures, semantic conflicts, model versions, API health, lineage gaps, or decision-support usage is operationally fragile. Platform observability should track both technical health and evidence health.
| Signal | Why It Matters | Failure Indicator |
|---|---|---|
| Source-feed freshness | Determines whether platform data are current enough for decision use. | Latest source update exceeds freshness threshold. |
| Ingestion success | Determines whether data pipelines are receiving and validating records. | Failed ingestion job, partial load, duplicate records, schema errors |
| Metadata completeness | Determines whether datasets remain interpretable and reusable. | Missing source, method, unit, spatial reference, or quality field |
| Semantic conflict rate | Determines whether integration is producing incompatible comparisons. | Unit mismatch, variable definition conflict, temporal aggregation mismatch |
| Lineage completeness | Determines whether outputs can be reconstructed from source and workflow history. | Dashboard, model, or report output lacks traceable source chain |
| Model version status | Determines whether model outputs are current, validated, and documented. | Outdated model, missing validation, unapproved scenario definition |
| API and service health | Determines whether users and systems can access platform evidence. | Service outage, latency spike, failed query, authentication error |
| Decision-support usage | Determines whether platform outputs are actually supporting user tasks. | Low drill-down, repeated failed searches, unused decision view |
Without platform observability, environmental intelligence degrades silently. A system may continue to serve data while losing freshness, meaning, lineage, or user trust.
Engineer and Researcher Checklist
- Define the platform’s decision context before designing storage, APIs, dashboards, or models.
- Maintain a source inventory for datasets, feeds, APIs, geospatial layers, models, and administrative records.
- Require metadata for source, method, unit, time, space, quality, provenance, uncertainty, and access conditions.
- Validate semantic compatibility before integrating or comparing environmental variables.
- Track lineage from source data through transformations, models, indicators, dashboards, and reports.
- Distinguish measured, modeled, estimated, interpolated, forecast, scenario, and administrative evidence.
- Use model cards and scenario registries for decision-support models.
- Design decision-support interfaces around user roles and decision tasks.
- Test APIs and dashboards for usability, not only availability.
- Monitor platform evidence health, including metadata completeness and lineage gaps.
- Maintain governance records for stewardship, access, versioning, review, and public accountability.
- Publish evidence packages where platform outputs affect public decisions or environmental accountability.
Where This Fits in the Series
This article connects Environmental Monitoring Systems to data systems, analytics, dashboards, artificial intelligence, remote sensing, sensor networks, edge computing, risk and resilience, sustainability strategy, and governance. It sits between the technical layers that generate environmental data and the interpretive layers that turn those data into action. Its role is to show that monitoring only becomes decision-relevant when evidence can be integrated, contextualized, trusted, and used within a real decision process.
Within the broader series, this article is foundational for environmental analytics and monitoring dashboards, IoT architectures, edge computing, remote sensing systems, satellite observation, monitoring environmental risk and resilience, environmental sustainability strategy, and future environmental intelligence. It explains the platform layer that makes all of those systems interoperable enough to matter. Without strong platforms, environmental monitoring remains fragmented. With strong platforms, observation can become shared, reviewable, and actionable intelligence.
Related articles
- Environmental Analytics and Monitoring Dashboards
- IoT Architectures for Environmental Monitoring
- Environmental Sensor Networks
- Edge Computing in Environmental Monitoring
- Remote Sensing Systems in Environmental Monitoring
- Satellite Observation and Earth System Monitoring
- Monitoring Environmental Risk and Resilience
- Environmental Monitoring for Sustainability Strategy
- Environmental Monitoring Systems
Further reading
- National Oceanic and Atmospheric Administration (2013) NOAA Environmental Data Management Framework. Available at: https://www.nesdis.noaa.gov/s3/2025-01/NOAA-Environmental-Data-Management-Framework-v1.pdf
- National Oceanic and Atmospheric Administration (2022) NOAA Data Strategic Action Plan. Available at: https://www.noaa.gov/sites/default/files/2022-11/NOAA-Data-Strategic-Action-Plan.pdf
- National Oceanic and Atmospheric Administration (2026) NAO 212-15B: Management of NOAA Data and Information. Available at: https://www.noaa.gov/organization/administration/nao-212-15-Management-of-NOAA-Data-and-Information
- U.S. Environmental Protection Agency (2026) EPA Geospatial Strategic Plan. Available at: https://www.epa.gov/geospatial/epa-geospatial-strategic-plan
- U.S. Environmental Protection Agency (2025) Geospatial Strategic Plan FY 2023–2027. Available at: https://www.epa.gov/system/files/documents/2025-03/geospatial-strategic-plan-fy-2023-2027-v02.13.25.pdf
- U.S. Environmental Protection Agency (2025) Geospatial Policies and Standards. Available at: https://www.epa.gov/geospatial/geospatial-policies-and-standards
- U.S. Environmental Protection Agency (2026) Ecosystem Services Scenario Assessment Using EPA H2O. Available at: https://www.epa.gov/water-research/ecosystem-services-scenario-assessment-using-epa-h2o
- World Meteorological Organization (2026) WMO Integrated Processing and Prediction System (WIPPS). Available at: https://wmo.int/activities/wmo-integrated-processing-and-prediction-system-wipps
- Wilkinson, M.D. et al. (2016) ‘The FAIR Guiding Principles for scientific data management and stewardship’, Scientific Data, 3, 160018. Available at: https://www.nature.com/articles/sdata201618
References
- National Oceanic and Atmospheric Administration (2013) NOAA Environmental Data Management Framework. Available at: https://www.nesdis.noaa.gov/s3/2025-01/NOAA-Environmental-Data-Management-Framework-v1.pdf (Accessed: 14 May 2026).
- National Oceanic and Atmospheric Administration (2022) NOAA Data Strategic Action Plan. Available at: https://www.noaa.gov/sites/default/files/2022-11/NOAA-Data-Strategic-Action-Plan.pdf (Accessed: 14 May 2026).
- National Oceanic and Atmospheric Administration (2026) NAO 212-15B: Management of NOAA Data and Information. Available at: https://www.noaa.gov/organization/administration/nao-212-15-Management-of-NOAA-Data-and-Information (Accessed: 14 May 2026).
- U.S. Environmental Protection Agency (2025) Geospatial Strategic Plan FY 2023–2027. Available at: https://www.epa.gov/system/files/documents/2025-03/geospatial-strategic-plan-fy-2023-2027-v02.13.25.pdf (Accessed: 14 May 2026).
- U.S. Environmental Protection Agency (2025) Geospatial Policies and Standards. Available at: https://www.epa.gov/geospatial/geospatial-policies-and-standards (Accessed: 14 May 2026).
- U.S. Environmental Protection Agency (2026) EPA Geospatial Strategic Plan. Available at: https://www.epa.gov/geospatial/epa-geospatial-strategic-plan (Accessed: 14 May 2026).
- U.S. Environmental Protection Agency (2026) Ecosystem Services Scenario Assessment Using EPA H2O. Available at: https://www.epa.gov/water-research/ecosystem-services-scenario-assessment-using-epa-h2o (Accessed: 14 May 2026).
- Wilkinson, M.D., Dumontier, M., Aalbersberg, I.J. et al. (2016) ‘The FAIR Guiding Principles for scientific data management and stewardship’, Scientific Data, 3, 160018. Available at: https://www.nature.com/articles/sdata201618 (Accessed: 14 May 2026).
- World Meteorological Organization (2026) WMO Integrated Processing and Prediction System (WIPPS). Available at: https://wmo.int/activities/wmo-integrated-processing-and-prediction-system-wipps (Accessed: 14 May 2026).