
Last Updated May 10, 2026
Reproducible analytics and versioned data workflows are essential because analytical work increasingly shapes decisions in organizations, public institutions, scientific research, sustainability planning, infrastructure management, finance, health, education, and governance. Yet many analytical environments still operate as fragile chains of files, notebooks, spreadsheets, scripts, dashboards, extracts, undocumented transformations, and manually refreshed reports. Results may be correct at the time they are produced, but difficult to rerun, audit, explain, or compare later. When data changes, code changes, dependencies change, or assumptions disappear, analytical evidence can become detached from the conditions that produced it.
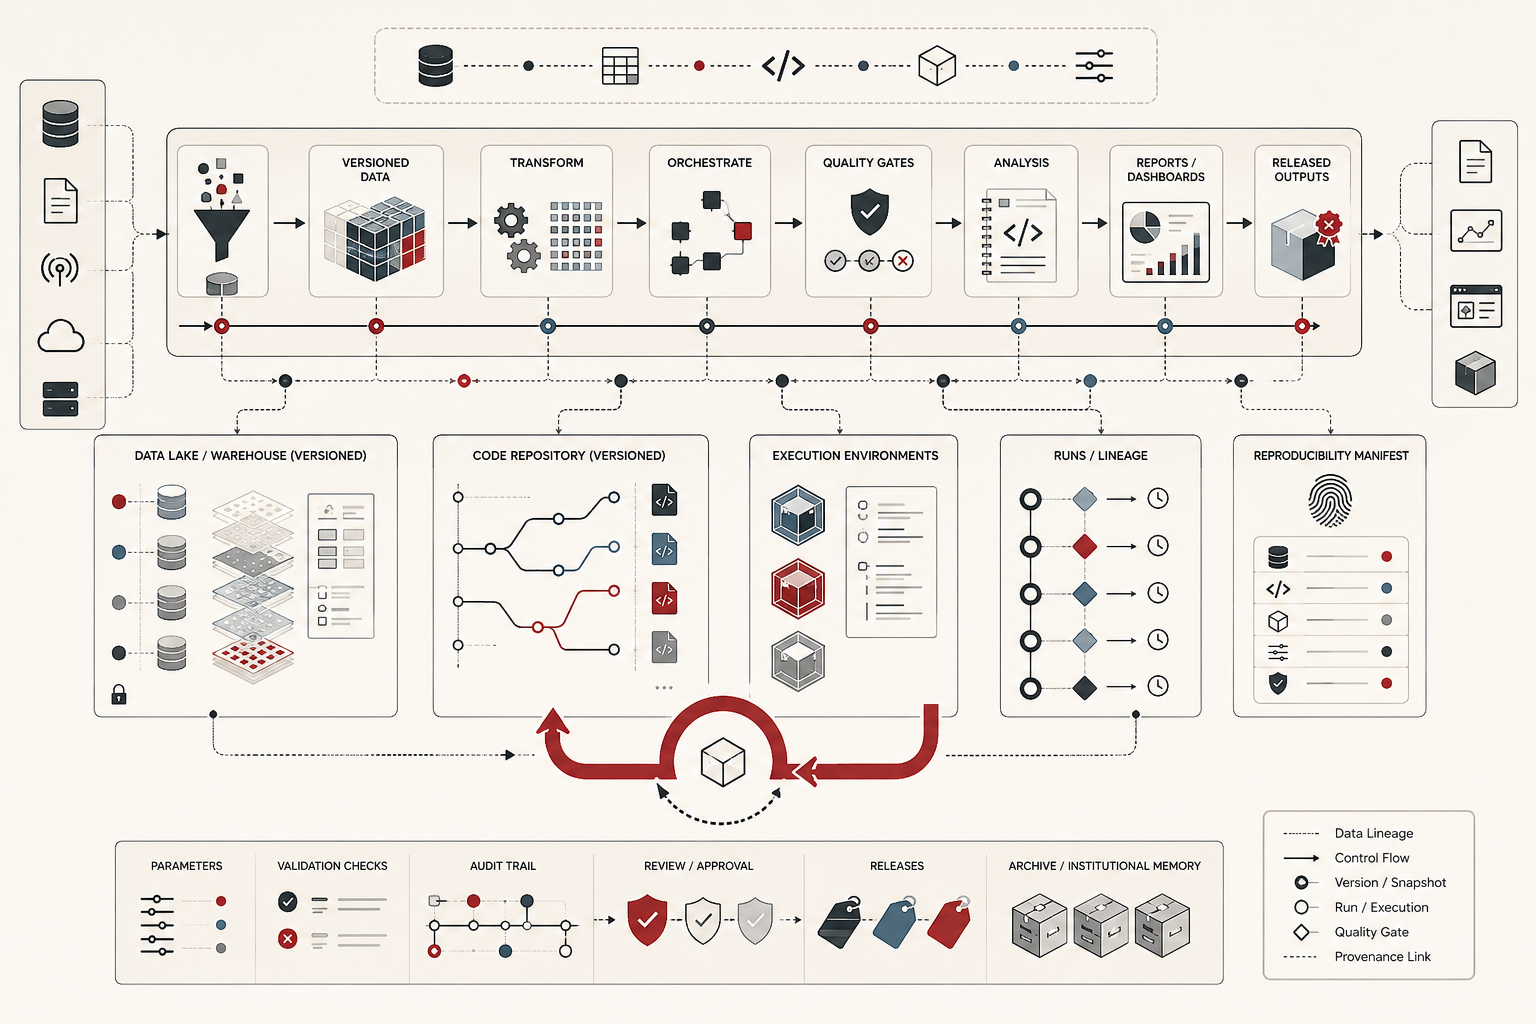
Reproducibility is the discipline of keeping data, code, environments, workflow runs, validation checks, lineage, and outputs connected over time. Versioned data workflows extend that discipline by treating datasets, transformations, models, reports, dashboards, and released outputs as traceable artifacts rather than disposable work products. The goal is not merely to save files. The goal is to preserve the relationship among input data, transformation logic, execution environment, analytical assumptions, quality checks, and published conclusions.
Main Library
Publications
Article Map
Data Systems & Analytics
Related Article
Cloud Data Platforms
Related Article
Analytics Engineering
Related Article
Data Products
This matters because analytical trust is not created only by expertise, good intentions, or sophisticated tools. Trust depends on whether a result can be traced back to the exact data, code, environment, assumptions, and validation process that produced it. A dashboard number, model result, policy estimate, forecast, risk score, or published report should not be a detached claim. It should be the visible output of a reproducible evidence system.
What reproducible analytics means
Reproducible analytics means that an analytical result can be regenerated, inspected, and explained from its underlying inputs. A reproducible analysis identifies the source data used, the version of that data, the code that transformed it, the parameters or assumptions applied, the computational environment in which the code ran, the validation checks that passed or failed, and the output artifacts that were produced. It turns analysis from an isolated event into a traceable process.
This does not mean every result must be perfectly deterministic in every possible context. Some workflows involve stochastic models, streaming inputs, external services, privacy-preserving transformations, or changing operational systems. But even when exact numerical repetition is difficult, reproducible analytics still requires disciplined evidence. The workflow should preserve enough information to explain what was run, when it was run, why it was run, what changed, which inputs were used, and how the result should be interpreted.
Reproducibility is therefore broader than notebook hygiene or code organization. It includes data management, software engineering, environment control, metadata, validation, governance, documentation, and institutional accountability. A reproducible workflow is not only one that an analyst can rerun on their own machine. It is one that another qualified person can inspect, understand, and evaluate without relying on informal memory.
Why versioned data workflows matter
Data changes. Source systems are corrected. Historical records are revised. Schemas evolve. Business rules shift. API responses change. Missing values are backfilled. Classification systems are updated. Analysts improve code. Dependencies release new versions. Dashboards are redesigned. Models are retrained. Reports are republished. Without versioning, these changes can make it impossible to determine why a number changed or which result should be trusted.
Versioned data workflows address this problem by preserving analytical state. They make it possible to distinguish a change in the world from a change in the data, a change in the data from a change in the code, a change in the code from a change in assumptions, and a change in assumptions from a change in presentation. That distinction is central to trustworthy analytics.
For example, a sustainability indicator may change because emissions actually declined, because a facility corrected a reporting error, because an upstream data pipeline changed units, because a threshold was redefined, or because a dashboard filter was modified. Without versioned workflows, those explanations blur together. With versioning and provenance, the organization can trace the result back through the evidence chain.
From files to evidence systems
Many analytical environments begin with files: spreadsheets, CSV extracts, notebook exports, SQL snippets, copied charts, and manually assembled slide decks. Files are useful, but file-based workflows often fail as evidence systems. They do not reliably preserve lineage, dependencies, assumptions, run history, validation results, or environment state. A folder full of files may show that work happened, but not necessarily how the conclusion was produced.
A reproducible evidence system organizes analytical work around connected artifacts. Raw inputs are stored separately from transformed data. Scripts are version controlled. Workflow runs produce logs and metadata. Environments are declared. Quality checks are recorded. Outputs are tagged with the data and code versions that produced them. Reports and dashboards are treated as downstream products of a pipeline rather than isolated presentation surfaces.
This shift is both technical and cultural. It changes analytics from a craft practice dependent on individual memory into an institutional capability. Analysts still need judgment, interpretation, and domain expertise. But their work becomes more durable because the process behind the result is preserved.
Data versioning, code versioning, and environment versioning
Reproducibility depends on three kinds of version control working together: data versioning, code versioning, and environment versioning.
Data versioning records which datasets were used. This may involve immutable snapshots, partitioned storage, object-store versioning, lakehouse table versions, data package releases, checksums, manifests, or specialized data-versioning tools. The goal is to prevent analytical results from depending on an unnamed and mutable file called something like latest_export.csv.
Code versioning records the transformation logic, analysis scripts, notebooks, SQL models, and report-generation code used to produce the result. Git-based workflows are common because they make it possible to track changes, branch experiments, review modifications, tag releases, and connect outputs to specific commits. Code versioning matters because analytical meaning often changes when a filter, join, grouping rule, imputation method, or metric formula changes.
Environment versioning records the computational context. This may include language versions, package dependencies, containers, lockfiles, system libraries, database engine versions, model versions, and runtime configuration. Without environment control, a workflow may fail or produce different results even when the data and code appear unchanged.
The strongest reproducible workflows connect all three. A released output should be traceable to a data snapshot, a code revision, and an environment specification. When those links are missing, the output may still be useful, but it is harder to audit and harder to defend.
Workflow orchestration and run history
Versioned workflows need orchestration because analytical pipelines are rarely single-step processes. A realistic workflow may extract data, validate schemas, create intermediate tables, run transformations, calculate metrics, train models, generate reports, refresh dashboards, archive outputs, and notify stakeholders. Each step may depend on prior steps. Each step may have its own failure modes.
Workflow orchestration makes these dependencies explicit. It defines the order of operations, schedules, triggers, retries, parameters, logs, alerts, and run history. A workflow run becomes an event with evidence attached to it: which task ran, when it ran, what inputs it used, what outputs it produced, whether validation passed, and where failures occurred.
This is especially important when analytics supports recurring decisions. Monthly reports, compliance submissions, environmental indicators, risk dashboards, budget forecasts, performance metrics, and operational scorecards should not depend on undocumented manual refreshes. They should be governed as recurring analytical processes with visible run history and clear accountability.
Validation, quality checks, and analytical controls
Reproducibility without validation can preserve error just as easily as truth. A workflow may be perfectly rerunnable while repeatedly producing incorrect results. For this reason, reproducible analytics must include quality checks and analytical controls.
Validation can occur at multiple levels. Source-level checks confirm whether expected files, tables, fields, and partitions arrived. Schema checks verify column names, data types, constraints, and required fields. Field-level checks examine missingness, ranges, uniqueness, invalid categories, duplicate records, and suspicious outliers. Relationship checks test whether joins preserve expected row counts and referential integrity. Metric checks compare outputs against expected ranges, prior periods, business rules, or independent benchmarks.
Analytical controls are especially important when outputs influence high-stakes decisions. A model, dashboard, or report should not be trusted only because code ran successfully. It should be trusted because the workflow produced evidence that the inputs were appropriate, transformations behaved as expected, assumptions were documented, and results passed review thresholds.
Lineage, provenance, and auditability
Lineage describes how data moves and changes across systems. Provenance describes the origin and history of an artifact. Auditability describes whether those relationships can be inspected by someone who needs to verify or challenge the result. Together, these concepts turn analytics into accountable evidence.
Lineage can be technical, showing how tables, files, models, and reports depend on one another. It can also be semantic, showing how definitions, assumptions, classifications, and metrics changed over time. Provenance can include source records, ingestion timestamps, transformation steps, code commits, environment manifests, validation reports, workflow run identifiers, review status, and output versions.
Auditability matters because analytics is rarely neutral infrastructure. It can allocate resources, shape policy, define risk, measure performance, justify intervention, and influence public understanding. When results cannot be traced, it becomes harder to correct error, contest interpretation, identify bias, or understand consequences. Reproducible workflows therefore support not only technical quality, but institutional responsibility.
Reproducible notebooks, reports, and dashboards
Notebooks, reports, and dashboards are often the most visible outputs of analytical work, but they are also common sources of reproducibility problems. A notebook may contain cells run out of order, hidden state, manual edits, exploratory fragments, or results that no longer match the underlying data. A report may include copied charts without clear provenance. A dashboard may display metrics whose transformation logic is buried across extracts, custom SQL, semantic models, and visualization-layer calculations.
Reproducible notebooks should be treated as executable documents, not informal scratchpads. Their dependencies should be declared, their inputs should be versioned, their execution order should be clean, and their outputs should be regenerable. Reports should be generated from controlled code or documented analytical pipelines where possible. Dashboards should rely on governed models, certified metrics, and traceable refresh processes rather than unmanaged extracts.
The goal is not to eliminate exploration. Exploratory work is essential to learning. But exploration and publication should be separated. Exploratory notebooks can remain flexible, while production notebooks, reports, dashboards, and data products should follow stricter reproducibility expectations.
Common failures in reproducible analytics
Several failures recur in analytical environments. One is mutable input failure, where a workflow reads from a changing file or table without preserving the exact input state. Another is notebook state failure, where results depend on cells run manually or out of order. A third is dependency drift, where package or environment changes alter behavior over time. A fourth is undocumented transformation logic, where important filtering, joining, or recoding decisions are hidden inside ad hoc scripts or dashboard calculations.
Another common failure is output detachment. This happens when charts, spreadsheets, reports, slides, or dashboard screenshots circulate without links to the workflow that produced them. The output becomes persuasive but not auditable. Users may quote the result without knowing which data version, code version, environment, assumptions, or validation checks support it.
There is also the failure of reproducibility theater. A repository may exist, but lack runnable instructions. A workflow may claim version control, but exclude data manifests. A notebook may be shared, but not executable. A dashboard may be governed in name, but rely on unmanaged extracts. Reproducibility is not a label. It is a property of the workflow.
What good looks like
A strong reproducible analytics workflow has several recognizable features. Inputs are versioned or snapshotted. Code is tracked in version control. Environments are declared through lockfiles, containers, package manifests, or comparable specifications. Workflows are orchestrated with clear dependencies. Validation checks are run before outputs are trusted. Logs and run metadata are preserved. Outputs are tagged with the data, code, environment, and workflow run that produced them. Reports and dashboards can be regenerated from controlled sources rather than manually reconstructed.
Good workflows also have social structure. Owners are named. Review responsibilities are clear. Published outputs are distinguished from exploratory artifacts. Documentation explains how to rerun the workflow, how to interpret the result, and what assumptions matter. Governance policies define retention, access, privacy, sensitivity, and release status. Reproducibility is not treated as a heroic individual habit, but as part of the organization’s analytical operating model.
Most importantly, good reproducible analytics protects institutional memory. It allows future users to understand not only what a result was, but how it came to be. That is what allows analytics to become cumulative, contestable, trustworthy, and reusable.
Python and R Workflows
Reproducible analytics becomes more concrete when the workflow is represented as a set of versioned artifacts. The following examples show how Python and R can be used to preserve analytical evidence. The Python workflow creates a small reproducibility manifest that connects input data, transformation code, environment information, validation checks, and output files. The R workflow audits multiple analytical runs to determine whether outputs changed because of data changes, code changes, validation failures, or ordinary versioned updates.
These examples are intentionally compact. They do not replace enterprise workflow tools, data catalogs, orchestration systems, container registries, or lakehouse versioning. Their purpose is to show the basic logic that every mature reproducible analytics system must preserve: what went in, what ran, what changed, what passed validation, and what came out.
Python workflow: Creating a reproducibility manifest for data, code, validation, and outputs
This Python workflow creates a small analytical run manifest. It records file hashes for input data and code, captures environment information, runs basic validation checks, writes an output dataset, and saves a JSON manifest that connects the result to its evidence trail. In a production setting, the same pattern could be connected to Git commits, object storage, workflow orchestrators, data catalogs, model registries, and release pipelines.
from pathlib import Path
from datetime import datetime, timezone
import hashlib
import json
import platform
import sys

import pandas as pd

# -----------------------------
# 1. Create a small project layout
# -----------------------------

project_root = Path("reproducible_analytics_demo")
data_dir = project_root / "data"
code_dir = project_root / "code"
output_dir = project_root / "outputs"
manifest_dir = project_root / "manifests"

for directory in [data_dir, code_dir, output_dir, manifest_dir]:
    directory.mkdir(parents=True, exist_ok=True)

raw_data_path = data_dir / "raw_sustainability_indicators_v1.csv"
transform_code_path = code_dir / "transform_indicators.py"
output_path = output_dir / "indicator_summary_v1.csv"
manifest_path = manifest_dir / "run_manifest_v1.json"

# -----------------------------
# 2. Create sample input data
# -----------------------------

raw_data = pd.DataFrame([
    {"region": "North", "year": 2024, "emissions_tonnes": 1200, "energy_mwh": 3400, "population": 50000},
    {"region": "North", "year": 2025, "emissions_tonnes": 1100, "energy_mwh": 3600, "population": 51000},
    {"region": "South", "year": 2024, "emissions_tonnes": 1800, "energy_mwh": 4200, "population": 68000},
    {"region": "South", "year": 2025, "emissions_tonnes": 1750, "energy_mwh": 4300, "population": 69000},
    {"region": "West", "year": 2024, "emissions_tonnes": 900, "energy_mwh": 2500, "population": 42000},
    {"region": "West", "year": 2025, "emissions_tonnes": 870, "energy_mwh": 2600, "population": 42500}
])

raw_data.to_csv(raw_data_path, index=False)

# A simple code artifact whose hash will be tracked.
transform_code_path.write_text(
    """
import pandas as pd

def build_indicator_summary(df):
    df = df.copy()
    df["emissions_per_capita"] = df["emissions_tonnes"] / df["population"]
    df["energy_per_capita"] = df["energy_mwh"] / df["population"]
    return df
""".strip()
)

# -----------------------------
# 3. Helper functions
# -----------------------------

def sha256_file(path: Path) -> str:
    digest = hashlib.sha256()
    with path.open("rb") as file:
        for block in iter(lambda: file.read(8192), b""):
            digest.update(block)
    return digest.hexdigest()


def validate_input_data(df: pd.DataFrame) -> dict:
    required_columns = {
        "region",
        "year",
        "emissions_tonnes",
        "energy_mwh",
        "population"
    }

    validation = {
        "required_columns_present": required_columns.issubset(df.columns),
        "row_count": int(len(df)),
        "missing_values": int(df.isna().sum().sum()),
        "negative_emissions": int((df["emissions_tonnes"] < 0).sum()),
        "negative_energy": int((df["energy_mwh"] < 0).sum()),
        "non_positive_population": int((df["population"] <= 0).sum()),
        "duplicate_region_year_rows": int(
            df.duplicated(subset=["region", "year"]).sum()
        )
    }

    validation["passed"] = (
        validation["required_columns_present"]
        and validation["row_count"] > 0
        and validation["missing_values"] == 0
        and validation["negative_emissions"] == 0
        and validation["negative_energy"] == 0
        and validation["non_positive_population"] == 0
        and validation["duplicate_region_year_rows"] == 0
    )

    return validation

# -----------------------------
# 4. Run the analytical workflow
# -----------------------------

input_df = pd.read_csv(raw_data_path)
validation_results = validate_input_data(input_df)

if not validation_results["passed"]:
    raise ValueError(f"Validation failed: {validation_results}")

indicator_summary = input_df.copy()
indicator_summary["emissions_per_capita"] = (
    indicator_summary["emissions_tonnes"] / indicator_summary["population"]
)
indicator_summary["energy_per_capita"] = (
    indicator_summary["energy_mwh"] / indicator_summary["population"]
)

indicator_summary.to_csv(output_path, index=False)

# -----------------------------
# 5. Save a reproducibility manifest
# -----------------------------

run_manifest = {
    "run_id": "indicator-summary-2026-03-001",
    "created_at_utc": datetime.now(timezone.utc).isoformat(),
    "workflow_name": "sustainability_indicator_summary",
    "workflow_version": "1.0.0",
    "inputs": [
        {
            "path": str(raw_data_path),
            "role": "raw_input_data",
            "sha256": sha256_file(raw_data_path)
        }
    ],
    "code": [
        {
            "path": str(transform_code_path),
            "role": "transformation_logic",
            "sha256": sha256_file(transform_code_path)
        }
    ],
    "environment": {
        "python_version": sys.version,
        "platform": platform.platform(),
        "pandas_version": pd.__version__
    },
    "validation": validation_results,
    "outputs": [
        {
            "path": str(output_path),
            "role": "released_indicator_summary",
            "sha256": sha256_file(output_path),
            "row_count": int(len(indicator_summary))
        }
    ]
}

manifest_path.write_text(json.dumps(run_manifest, indent=2))

print(json.dumps(run_manifest, indent=2))
This workflow illustrates the basic structure of reproducible analytical evidence. The output is not merely a CSV file. It is connected to an input snapshot, code artifact, environment record, validation result, workflow name, workflow version, timestamp, and output hash. If the result changes later, the manifest gives the analyst a way to investigate whether the change came from data, code, environment, validation, or release logic.
R workflow: Auditing versioned analytical runs and output changes
This R workflow compares multiple analytical runs. It creates a run registry, records data versions, code versions, environment versions, validation status, output hashes, row counts, and published status, then flags changes that require review. This is useful for recurring reports, dashboards, public indicators, model outputs, and decision-support datasets where users need to know not only that a number changed, but why the evidence chain changed.
library(tidyverse)

# -----------------------------
# 1. Create a versioned run registry
# -----------------------------

runs <- tribble(
  ~run_id, ~run_date, ~data_version, ~code_version, ~environment_version, ~validation_passed, ~output_hash, ~row_count, ~published,
  "run_001", as.Date("2026-03-01"), "data_v1", "code_v1", "renv_v1", TRUE,  "hash_a1", 6, TRUE,
  "run_002", as.Date("2026-03-08"), "data_v1", "code_v1", "renv_v1", TRUE,  "hash_a1", 6, TRUE,
  "run_003", as.Date("2026-03-15"), "data_v2", "code_v1", "renv_v1", TRUE,  "hash_b2", 6, TRUE,
  "run_004", as.Date("2026-03-22"), "data_v2", "code_v2", "renv_v1", TRUE,  "hash_c3", 6, TRUE,
  "run_005", as.Date("2026-03-29"), "data_v3", "code_v2", "renv_v2", FALSE, "hash_d4", 7, FALSE
)

# -----------------------------
# 2. Compare each run to the prior run
# -----------------------------

run_audit <- runs %>%
  arrange(run_date) %>%
  mutate(
    previous_run_id = lag(run_id),
    data_changed = data_version != lag(data_version),
    code_changed = code_version != lag(code_version),
    environment_changed = environment_version != lag(environment_version),
    output_changed = output_hash != lag(output_hash),
    row_count_changed = row_count != lag(row_count),
    first_run = is.na(previous_run_id)
  ) %>%
  mutate(
    change_explanation = case_when(
      first_run ~ "Initial published baseline",
      output_changed & data_changed & !code_changed & !environment_changed ~ "Output changed after data version update",
      output_changed & code_changed ~ "Output changed after code version update",
      output_changed & environment_changed ~ "Output changed after environment update",
      !output_changed & data_changed ~ "Data changed but output remained stable",
      !output_changed & !data_changed & !code_changed & !environment_changed ~ "No material workflow change",
      TRUE ~ "Mixed workflow change requiring review"
    ),
    review_status = case_when(
      !validation_passed ~ "block_release",
      output_changed & !data_changed & !code_changed & !environment_changed ~ "investigate_unexplained_output_change",
      row_count_changed & published ~ "review_row_count_change",
      output_changed ~ "review_and_document",
      TRUE ~ "accepted"
    )
  )

run_audit

# -----------------------------
# 3. Summarize reproducibility risk
# -----------------------------

risk_summary <- run_audit %>%
  count(review_status, name = "run_count") %>%
  arrange(desc(run_count))

risk_summary

# -----------------------------
# 4. Create a release log for published outputs
# -----------------------------

release_log <- run_audit %>%
  filter(published) %>%
  transmute(
    run_id,
    run_date,
    data_version,
    code_version,
    environment_version,
    output_hash,
    row_count,
    change_explanation,
    review_status
  )

release_log

# -----------------------------
# 5. Identify runs that should not be treated as trusted outputs
# -----------------------------

blocked_or_review_runs <- run_audit %>%
  filter(review_status != "accepted") %>%
  select(
    run_id,
    run_date,
    validation_passed,
    data_version,
    code_version,
    environment_version,
    output_hash,
    row_count,
    change_explanation,
    review_status
  )

blocked_or_review_runs
This workflow makes versioned analytics inspectable. A user can see which runs were published, which data version was used, whether code or environments changed, whether validation passed, whether the output changed, and whether a review is required. The logic can be extended to compare real output files, run statistical regression tests, generate release notes, block publication when validation fails, or create an audit table for governance review.
How these workflows strengthen reproducible analytics
The Python workflow emphasizes provenance at the level of an individual run. It shows how raw data, code, environment, validation, and output files can be tied together through a manifest. The R workflow emphasizes reproducibility across time. It shows how multiple runs can be compared so that changes in outputs can be explained by changes in data, code, environment, validation status, or publication decisions.
Together, the workflows reinforce the central claim of this article: reproducible analytics is not just a coding style. It is an evidence architecture. Once each analytical output is connected to versioned inputs, executable logic, environment information, validation checks, and run history, the organization can audit results, explain changes, rerun analyses, and preserve institutional memory.
GitHub Repository
The companion repository for this article provides reproducible Python and R workflows for preserving analytical evidence across data versions, code versions, environment specifications, validation checks, workflow run manifests, output hashes, and release histories.
Conclusion
Reproducible analytics and versioned data workflows are necessary because analytical outputs increasingly carry institutional authority. They shape forecasts, resource allocation, policy decisions, operational priorities, compliance reporting, public communication, and strategic planning. When those outputs cannot be traced, rerun, or explained, organizations lose the ability to distinguish trustworthy evidence from accidental artifact.
The solution is not simply to use better tools. It is to treat analytical work as a connected evidence system. Data should be versioned. Code should be tracked. Environments should be declared. Workflows should preserve run history. Validation should be explicit. Outputs should be linked to the exact conditions that produced them. Reports and dashboards should be downstream expressions of governed workflows rather than disconnected presentation layers.
Under those conditions, analytics becomes more durable, more accountable, and more useful. Reproducibility allows organizations to learn from prior work instead of repeatedly reconstructing it. Versioning allows changes to be explained instead of merely observed. Provenance allows results to be audited instead of passively accepted. That is the deeper purpose of reproducible analytics: not just rerunning code, but preserving the chain of evidence that makes data-driven judgment responsible.
Related articles
- Cloud Data Platforms and Modern Data Stack Architecture
- Database Systems and Data Architecture
- Data Integration and Interoperability
- Analytics Engineering and Semantic Layers
- Data Products and Self-Service Analytics
- Business Intelligence Systems and Decision Support
Further reading
- Baumer, B.S., Cetinkaya-Rundel, M., Bray, A., Loi, L. and Horton, N.J. (2014) R Markdown: Integrating a reproducible analysis tool into introductory statistics. Technology Innovations in Statistics Education.
- Boettiger, C. (2015) An introduction to Docker for reproducible research. ACM SIGOPS Operating Systems Review.
- Bryan, J. (2018) Excuse me, do you have a moment to talk about version control? The American Statistician.
- Gentleman, R. and Lang, D.T. (2007) Statistical analyses and reproducible research. Journal of Computational and Graphical Statistics.
- Kitzes, J., Turek, D. and Deniz, F. (eds.) (2018) The Practice of Reproducible Research: Case Studies and Lessons from the Data-Intensive Sciences. Oakland: University of California Press.
- Sandve, G.K., Nekrutenko, A., Taylor, J. and Hovig, E. (2013) Ten Simple Rules for Reproducible Computational Research. PLOS Computational Biology.
References
- Data Version Control (DVC) (2026) DVC Documentation. Available at: https://dvc.org/doc
- Docker (2026) Docker Docs. Available at: https://docs.docker.com/
- Git (2026) Git Documentation. Available at: https://git-scm.com/doc
- Jupyter (2026) Project Jupyter Documentation. Available at: https://docs.jupyter.org/en/latest/
- Python Packaging Authority (2026) Python Packaging User Guide. Available at: https://packaging.python.org/en/latest/
- RStudio / Posit (2026) renv: Project Environments for R. Available at: https://rstudio.github.io/renv/
- The Turing Way Community (2026) The Turing Way: A Handbook for Reproducible, Ethical and Collaborative Data Science. Available at: https://the-turing-way.netlify.app/
- W3C (2013) PROV-O: The PROV Ontology. Available at: https://www.w3.org/TR/prov-o/
- W3C (2013) PROV-DM: The PROV Data Model. Available at: https://www.w3.org/TR/prov-dm/