
Last Updated May 30, 2026
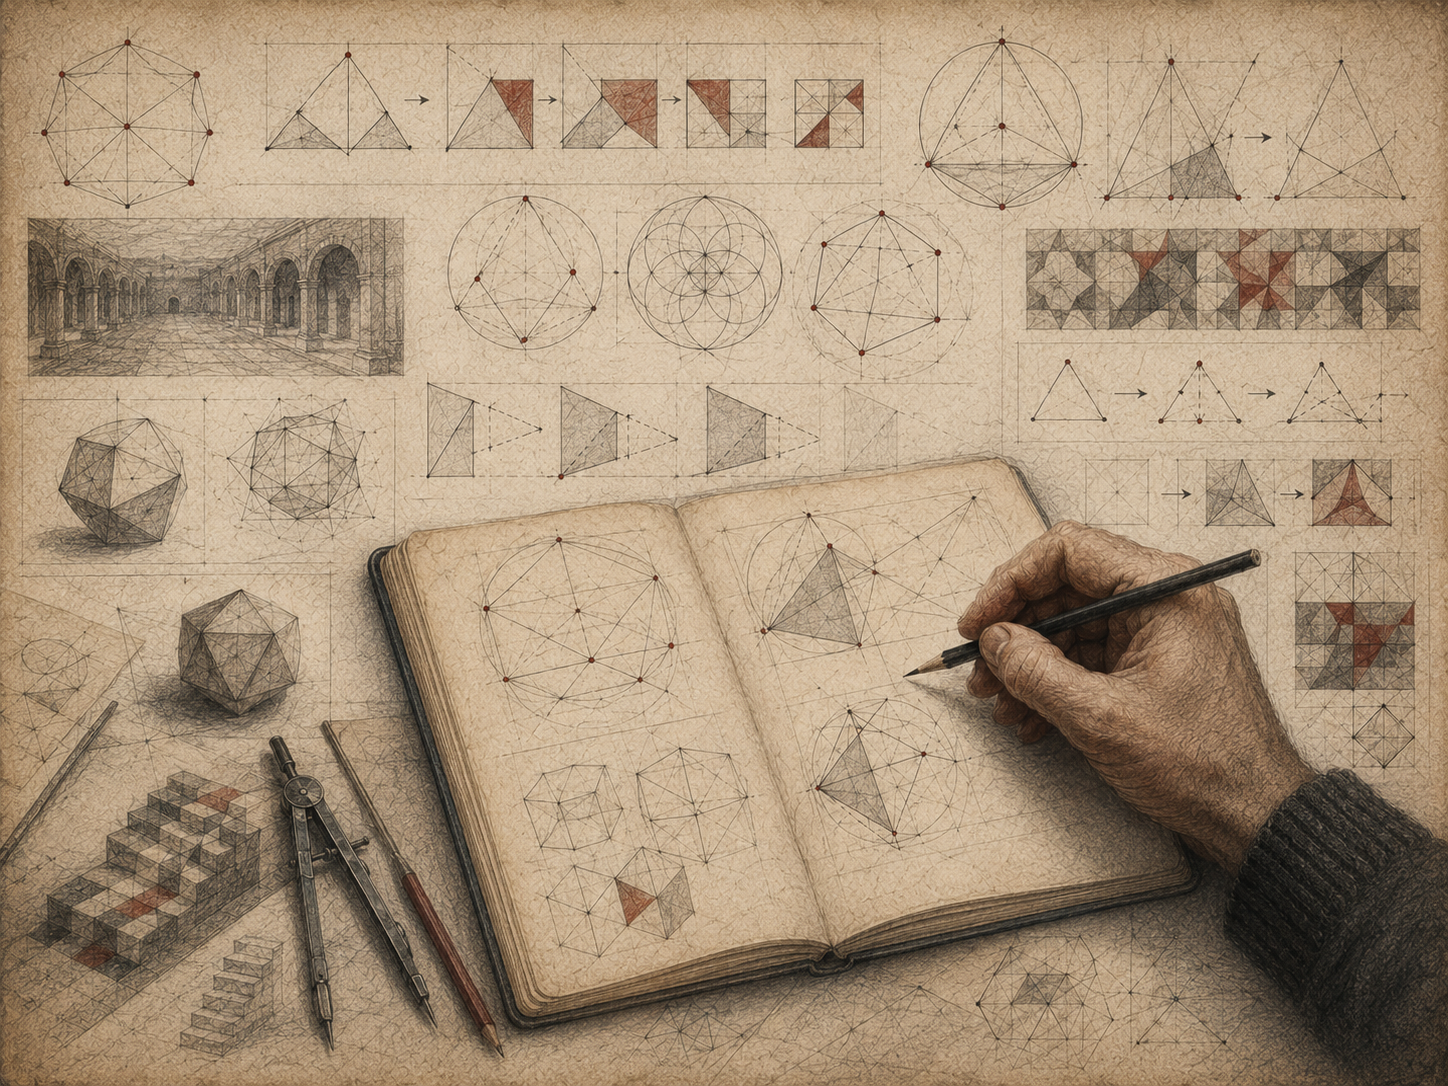
Mathematics is often associated with symbols, formulas, definitions, and formal proofs. Yet visual reasoning has always been central to mathematical thought. Diagrams, figures, graphs, geometric constructions, spatial arrangements, tilings, number patterns, commutative diagrams, visual invariants, and “proofs without words” help mathematicians see structure before they express it symbolically. Visual proof does not replace deductive rigor, but it often makes mathematical truth visible in a way that symbolic argument alone may not.
Visual proof occupies a fascinating position in mathematics. It can reveal why something is true, suggest a formal proof, expose hidden symmetry, make an invariant apparent, and support memory and teaching. But it can also mislead. A diagram may show a special case rather than a general one. A figure may depend on scale, perspective, accidental alignment, or unspoken assumptions. A visual pattern may be persuasive without being proof. Mathematical thinking must therefore learn how to use visual evidence without confusing intuition with justification.
This article examines visual proof as a serious form of mathematical thinking. It explores geometric diagrams, visual algebra, combinatorial arrangements, graphical reasoning, dynamic geometry, “proofs without words,” diagrammatic logic, visual intuition, formal limits, educational use, and responsible interpretation. The central claim is simple: visual proof is not a lesser form of mathematics. It is a powerful mode of reasoning when paired with abstraction, generalization, and proof discipline.
The Visual Proof Question
The central question of visual proof is not whether pictures can be helpful. They obviously can. The deeper question is whether visual reasoning can contribute to mathematical justification. Can a diagram prove? Can seeing a pattern establish a theorem? Can a geometric arrangement carry general meaning? Can a visual argument do more than illustrate a proof written elsewhere?
The answer depends on what is meant by proof. If proof means a fully formal derivation from axioms using explicit inference rules, then most visual arguments are not proofs by themselves. But if proof means a disciplined mathematical argument that reveals why a statement follows, then many diagrams play a genuine justificatory role. They may not always provide every formal detail, but they can organize the reasoning that makes proof possible.
\text{visual proof}=\text{diagram}+\text{invariant}+\text{generalization}+\text{justification}
\]
Interpretation: A visual proof becomes mathematically serious when the diagram reveals a stable relation or invariant that can be generalized and justified beyond the particular picture.
The visual proof question therefore requires a distinction between three related but different roles: illustration, evidence, and proof. A picture may illustrate a theorem already proved. It may provide evidence that a claim is plausible. Or it may encode a general argument that can be translated into symbolic, verbal, or formal proof.
| Visual Role | What It Does | Mathematical Status |
|---|---|---|
| Illustration | Shows an example of a theorem or idea | Helpful but not sufficient |
| Evidence | Suggests that a pattern may hold | Requires testing and proof |
| Heuristic | Guides discovery or proof strategy | Valuable for exploration |
| Diagrammatic argument | Encodes relations that justify a claim | Can support proof when generality is clear |
| Formal diagrammatic proof | Uses a diagram within explicit rules | Can be formally checkable |
Visual proof is therefore not one thing. It ranges from intuitive illustration to formal diagrammatic reasoning. Mathematical maturity lies in knowing where a particular visual argument sits on that spectrum.
Seeing and Proving Are Related, but Not Identical
Mathematical seeing is powerful because it compresses structure. A diagram can show symmetry at once. A graph can reveal a trend. A tiling can display equivalence. A geometric construction can expose a hidden relation. A commutative diagram can show how maps compose. A visual pattern can suggest an algebraic identity before the identity is written in symbols.
But seeing is not the same as proving. A picture may appear to show a general truth while actually showing one special case. A visual impression may depend on an accidental feature of the drawing. A figure may hide a degenerate case. A graph may use misleading scale. A dynamic animation may suggest continuity or convergence without establishing it. Visual insight must be converted into mathematical justification.
\text{seeing why}\neq \text{proving that}
\]
Interpretation: Visual reasoning can reveal why a statement may be true, but mathematical proof must establish that the statement holds under the stated assumptions.
This distinction should not be used to dismiss visual thinking. It should be used to discipline it. The task is to ask what the visual argument preserves. Does the diagram show an invariant? Does it represent an arbitrary case or a special case? Can the visual transformation be repeated for all relevant objects? Can the argument survive changes of scale, orientation, labeling, or parameter?
| Visual Insight | Proof Question | Risk |
|---|---|---|
| Pattern appears in examples | Does it hold for all cases? | Overgeneralization |
| Diagram shows symmetry | Is the symmetry structurally necessary? | Accidental symmetry |
| Area decomposition works visually | Does the decomposition preserve area generally? | Hidden geometric assumption |
| Graph suggests convergence | Can convergence be proved? | Misleading numerical range |
| Dynamic construction remains stable | What invariant explains the stability? | Experimental certainty mistaken for proof |
Visual proof works best when seeing becomes the beginning of justification, not the end of inquiry.
A Brief History of Visual Mathematical Reasoning
Visual reasoning is ancient. Geometry itself emerged through figures, constructions, measurement, and spatial comparison. Euclidean proof is inseparable from diagrams, even when its logical structure is expressed in verbal form. Mathematical cultures across the world have used visual and spatial reasoning through counting boards, geometric dissection, astronomical diagrams, architectural proportion, tiling, land measurement, knot diagrams, and mechanical constructions.
The history of mathematics is not a simple march from pictures to symbols. Symbols and diagrams have always worked together. A diagram can make relations visible; notation can make those relations portable and general. A visual proof may reveal structure; an algebraic proof may preserve it in symbolic form. A formal proof may then make the assumptions explicit.
\text{diagram}\leftrightarrow \text{symbol}\leftrightarrow \text{proof}
\]
Interpretation: Mathematical history shows continual movement between diagrams, symbols, and proofs rather than a simple replacement of visual thought by symbolic thought.
Modern mathematics has sometimes treated visual reasoning with suspicion, especially after the rise of formal rigor in analysis, set theory, logic, and foundations. That suspicion had good reasons: diagrams can mislead. Yet the twentieth and twenty-first centuries also saw renewed interest in visualization, topology, category diagrams, graph theory, computer visualization, dynamic geometry, and diagrammatic reasoning in formal systems.
| Historical Context | Visual Medium | Mathematical Function |
|---|---|---|
| Ancient geometry | Figures and constructions | Spatial relation and deductive argument |
| Counting and calculation traditions | Boards, rods, tables, arrangements | Discrete quantity and procedure |
| Algebraic geometry and analytic geometry | Curves, coordinates, graphs | Linking spatial form and symbolic equation |
| Topology and graph theory | Networks, surfaces, knots, maps | Structure preserved under transformation |
| Computer-era mathematics | Dynamic diagrams, simulations, visualizations | Exploration, conjecture, and model interpretation |
Visual mathematical reasoning is not primitive mathematics. It is one of mathematics’ enduring media of thought.
Geometry, Diagrams, and Constructive Insight
Geometry is the natural home of visual proof because geometric objects are spatial. Points, lines, angles, circles, triangles, polygons, solids, transformations, and constructions invite diagrams. Yet geometric diagrams are not merely pictures of objects. They can encode relationships: congruence, similarity, parallelism, incidence, containment, symmetry, orientation, and proportion.
A geometric diagram becomes mathematically powerful when it shows more than appearance. It shows dependencies. A constructed line may create similar triangles. A circle may reveal equal angles. A reflection may expose symmetry. A dissection may prove area equivalence. A rotation may transform a difficult relation into a simple one.
\text{geometric diagram}=\text{objects}+\text{relations}+\text{construction}
\]
Interpretation: A serious geometric diagram is not just a drawing. It is a structured representation of objects, relations, and constructive dependencies.
Geometric visual proof must also handle generality. A triangle in a diagram is one drawing, but a theorem may concern all triangles of a certain kind. The diagram must be read as a representative case, not as a particular measurement. This requires abstraction: the proof depends on relations that remain true under allowed variation, not on the accidental shape of the figure.
| Geometric Feature | Visual Meaning | Proof Discipline |
|---|---|---|
| Parallel lines | Shared direction and angle relations | Use parallel postulates or established criteria |
| Congruent triangles | Matching sides and angles | State the congruence criterion |
| Similar triangles | Preserved shape and proportional sides | Identify angle or ratio conditions |
| Circle construction | Equal radius and cyclic angle relations | Use circle theorems explicitly |
| Dissection | Area-preserving rearrangement | Show pieces cover without overlap or gap |
Geometry demonstrates the central strength of visual proof: seeing relations can guide deduction. The diagram does not replace the proof, but it can reveal the route.
Proofs Without Words
“Proofs without words” are visual arguments that use diagrams, arrangements, or geometric constructions to make a mathematical statement appear evident. They are especially common for identities, sums, inequalities, area relations, and combinatorial formulas. A classic example is representing a sum of odd numbers as successive square layers, revealing why \(1+3+5+\cdots+(2n-1)=n^2\).
The phrase “without words” is slightly misleading. These proofs often depend on the reader’s ability to supply the words. The diagram provides the structure; the viewer must recognize what is being counted, rearranged, preserved, or generalized. A good proof without words is therefore not wordless in the mind. It invites the reader to reconstruct the argument.
1+3+5+\cdots+(2n-1)=n^2
\]
Interpretation: A visual proof can show this identity by building an \(n\times n\) square from successive L-shaped layers of odd size.
Proofs without words are powerful educationally because they create an “aha” experience. They also reveal that proof can be spatial, constructive, and pattern-based. But they require care. The reader must identify what is arbitrary, what is fixed, what is preserved, and how the visual pattern generalizes.
| Proof Without Words Type | Common Visual Device | Mathematical Idea |
|---|---|---|
| Sum identity | Dots, blocks, or square layers | Counting by arrangement |
| Algebraic identity | Area decomposition | Equivalent expressions as equal areas |
| Inequality | Containment or comparison | One quantity bounded by another |
| Geometric theorem | Dissection, rotation, reflection | Preservation under transformation |
| Combinatorial formula | Counting the same objects two ways | Bijection or double counting |
A proof without words is most successful when the viewer can translate the visual insight into a clear general argument.
Visual Algebra and Area Reasoning
Algebra is often taught as symbolic manipulation, but many algebraic identities have visual meaning. Area models can show why products expand, why squares of sums include cross terms, why factoring reverses expansion, and why completing the square works. Visual algebra helps students see that expressions are not arbitrary strings of symbols. They are structured forms.
For example, the identity \((a+b)^2=a^2+2ab+b^2\) can be represented as a square with side length \(a+b\). The square decomposes into one \(a^2\) square, two \(ab\) rectangles, and one \(b^2\) square. The visual model does not merely illustrate the identity; it reveals why the cross term appears.
(a+b)^2=a^2+2ab+b^2
\]
Interpretation: The area model shows that the square of a sum contains two rectangular cross terms, not just the squares of the parts.
Visual algebra also helps explain factoring. To factor an expression is to see it as an area assembled from pieces with a common side length. Completing the square is a visual operation: rearranging a quadratic expression into a square plus or minus an adjustment. These visual meanings can make symbolic operations less mechanical and more structural.
| Algebraic Idea | Visual Representation | Conceptual Benefit |
|---|---|---|
| Expansion | Area decomposition | Shows where terms come from |
| Factoring | Reassembling area pieces | Shows common structure |
| Completing the square | Building a square from partial area | Connects quadratic form to geometry |
| Distributive property | Rectangle split into parts | Shows multiplication over addition |
| Difference of squares | Cut-and-rearrange area | Reveals product structure |
Visual algebra is not a substitute for symbolic fluency. It is a way to give symbols meaning before they become formal techniques.
Combinatorics, Counting, and Arrangement
Combinatorics is deeply visual because counting often depends on arrangement. Dots, grids, paths, trees, partitions, lattice diagrams, Ferrers diagrams, Pascal’s triangle, graph drawings, and tilings can all reveal counting structure. A good combinatorial picture often proves a formula by showing that two expressions count the same objects in different ways.
Visual combinatorics is powerful because it turns algebraic expressions into objects. A binomial coefficient may become a path count. A recurrence may become a branching tree. A partition may become a diagram of rows and columns. A generating function may be motivated by arranging choices. Visual proof helps the mind move between quantity and structure.
\binom{n}{k}=\binom{n}{n-k}
\]
Interpretation: Visually, choosing \(k\) objects from \(n\) is equivalent to choosing the \(n-k\) objects left out.
Many combinatorial proofs are visual even when written symbolically. A double-counting proof often has an imagined set of objects being counted two ways. A bijective proof often depends on seeing how one arrangement transforms into another. A recurrence proof may depend on decomposing cases visually.
| Combinatorial Tool | Visual Form | Proof Idea |
|---|---|---|
| Pascal’s triangle | Triangular array | Recursive addition of adjacent entries |
| Lattice paths | Grid movements | Counting sequences of choices |
| Ferrers diagrams | Rows of dots or boxes | Partition structure and conjugation |
| Decision trees | Branching choices | Recursive enumeration |
| Graph drawings | Vertices and edges | Adjacency, paths, cycles, and connectivity |
Combinatorics shows that visual proof is not limited to geometry. Discrete structure can also be seen.
Graphs, Networks, and Relational Seeing
Graph theory turns relations into pictures. Vertices and edges make connection visible. A graph drawing can reveal paths, cycles, components, bridges, cut vertices, planarity, symmetry, centrality, clustering, and bottlenecks. Visual graph reasoning helps mathematicians and scientists think about systems whose structure is relational rather than spatial in the ordinary geometric sense.
Yet graph drawings can mislead. The same graph can be drawn in many ways. Edge crossings may be artifacts of the drawing rather than properties of the graph. Distance on the page may not represent graph distance. A visually central vertex may not have high centrality by a formal measure. Visual graph proof requires distinguishing the abstract graph from its drawing.
G=(V,E)
\]
Interpretation: A graph is defined by vertices and edges; a drawing is one representation of that abstract relational structure.
Visual proof in graph theory often depends on invariants: parity, degree, connectivity, planar regions, coloring constraints, or forbidden configurations. A diagram can make these invariants easier to see, but the proof must establish that they belong to the graph, not merely the drawing.
| Visual Graph Feature | Mathematical Concept | Proof Caution |
|---|---|---|
| Connected cluster | Component or community | Visual closeness may not equal graph-theoretic closeness |
| Crossing edges | Drawing artifact or nonplanarity question | A crossing in one drawing does not prove nonplanarity |
| Repeated pattern | Symmetry or automorphism | Must define the structure-preserving map |
| Bridge-like edge | Cut edge | Must show removal disconnects the graph |
| Color arrangement | Graph coloring | Must check adjacency constraints generally |
Graph visualization demonstrates a broader principle: visual proof often requires separating representation from structure.
Calculus, Motion, and Visual Limits
Calculus is often introduced visually through slopes, areas, curves, accumulation, motion, tangent lines, secant lines, and limiting processes. These images are not incidental. They help explain why derivatives measure instantaneous rate of change and why integrals measure accumulation. The fundamental theorem of calculus is easier to understand when differentiation and integration are seen as inverse relationships between change and accumulated quantity.
Visual calculus is powerful because it connects static formulas to dynamic behavior. A derivative is not only a symbolic operation; it is the limiting slope of secants. An integral is not only an antiderivative; it is the limit of accumulated area or total change. A differential equation is not only an equation; it is a field of possible motions.
f'(a)=\lim_{h\to 0}\frac{f(a+h)-f(a)}{h}
\]
Interpretation: Visually, the derivative is the limiting slope of secant lines as the second point approaches the first.
But calculus also shows why visual intuition needs rigor. A curve may look smooth while hiding nondifferentiability. A sequence may appear to approach a limit on a graph but behave differently outside the plotted range. An infinite process may seem visually obvious while requiring careful quantifiers. Visual calculus should lead into formal definitions, not replace them.
| Calculus Concept | Visual Meaning | Formal Need |
|---|---|---|
| Derivative | Instantaneous slope | Limit definition |
| Integral | Accumulated area or total change | Limit of sums or measure-theoretic framework |
| Continuity | No visible break | Epsilon-delta or topological definition |
| Convergence | Approach toward a value | Quantified control after some index or near a point |
| Differential equation | Field of possible motion | Existence, uniqueness, stability, and solution concept |
Visual calculus is indispensable for intuition, but rigor tells us when intuition is safe.
Dynamic Geometry and Experimental Visualization
Dynamic geometry software allows figures to be dragged, transformed, measured, and explored while preserving constructed relations. This changes the role of diagrams. A static diagram may show one case. A dynamic diagram can let learners vary the configuration and observe what remains invariant. If an angle remains equal, a midpoint remains fixed, or a locus traces a curve under movement, the learner begins to see structure beyond a single drawing.
Dynamic visualization is especially valuable for conjecture formation. Students can ask: what changes? What stays the same? Which relation is accidental? Which relation is forced by construction? This makes visual proof more experimental. The diagram becomes a laboratory for mathematical thought.
\text{dynamic diagram}=\text{construction}+\text{variation}+\text{invariant}
\]
Interpretation: Dynamic geometry helps reveal which properties remain stable under allowed transformations and which are artifacts of a single drawing.
Yet dynamic geometry still does not replace proof. Observing an invariant under many movements provides strong evidence, but not a theorem. The next step is to identify the reason: congruence, similarity, symmetry, angle chasing, coordinate relation, algebraic constraint, or transformation property.
| Dynamic Geometry Action | Mathematical Benefit | Proof Question |
|---|---|---|
| Drag a point | Tests whether a relation persists | What invariant explains persistence? |
| Measure an angle or length | Suggests equality or proportionality | Can the relation be derived? |
| Trace a locus | Reveals possible curve or path | What equation or constraint defines it? |
| Animate a parameter | Shows dependence on variation | Which cases are exceptional? |
| Construct auxiliary objects | Suggests proof strategy | Why is this construction valid? |
Dynamic geometry strengthens visual proof when it leads from observation to invariant to argument.
Diagrams, Formal Systems, and Machine Reasoning
Diagrams can also be studied formally. A diagrammatic proof need not be informal or vague. If the syntax of diagrams and the rules for manipulating them are made explicit, diagrams can function within formal systems. This matters for Euclidean geometry, category theory, knot theory, logic, circuit reasoning, string diagrams, commutative diagrams, and automated geometry.
Formal diagrammatic reasoning asks what a diagram is allowed to represent and which transformations preserve meaning. In Euclidean geometry, a diagram may encode incidence, betweenness, congruence, and construction. In category theory, arrows and commutative diagrams encode maps and compositions. In knot theory, diagram moves preserve knot equivalence. In logic, diagrammatic systems can encode relations and inference.
\text{formal diagram}=\text{syntax}+\text{semantics}+\text{valid transformations}
\]
Interpretation: A diagram becomes formal when its representational elements and permissible transformations are governed by explicit rules.
Machine reasoning with diagrams is an active frontier. Geometry solvers, diagram formalization tools, proof assistants, and multimodal AI systems all face the challenge of turning visual information into structured mathematical relations. This is difficult because a mathematical diagram is not just an image. It is a representation of constraints.
| Diagrammatic Domain | Visual Objects | Formal Question |
|---|---|---|
| Euclidean geometry | Points, lines, circles, angles | Which relations follow from construction? |
| Category theory | Objects and arrows | Which compositions are equal? |
| Knot theory | Crossing diagrams | Which moves preserve equivalence? |
| Logic diagrams | Regions, relations, containment | Which inference rules are sound? |
| Automated geometry | Structured diagram encodings | Can visual constraints be formalized reliably? |
Formal diagrammatic reasoning shows that visual proof can be more than intuition. Under explicit rules, diagrams can become part of rigorous mathematical systems.
When Visual Proof Misleads
Visual proof can mislead when the viewer mistakes appearance for structure. A diagram may be drawn in a special configuration. A graph may hide behavior outside the displayed interval. A geometric figure may not represent all possible cases. A visual argument may rely on continuity, convexity, symmetry, or nondegeneracy without stating it. A pattern of dots may suggest a formula that fails later.
Some of the most important mathematical lessons come from visual failure. A curve that looks tangent may not be. A sequence that appears to converge may oscillate. A finite pattern may break. A diagram may hide an exceptional case. A visual proof may assume what it needs to prove.
\text{visual plausibility}\neq \text{mathematical validity}
\]
Interpretation: A visual argument must be checked for generality, assumptions, exceptional cases, and structural validity.
Responsible visual proof requires a habit of skepticism. What is the diagram showing? What is it not showing? Which features are essential? Which are accidental? Can the diagram be varied? Can the argument be expressed verbally, symbolically, or formally? What would a counterexample look like?
| Visual Risk | Problem | Responsible Check |
|---|---|---|
| Special case | Diagram represents only one configuration | Vary the case and identify invariant relations |
| Scale illusion | Graph or figure visually distorts relation | Check axes, units, and numerical values |
| Hidden assumption | Argument depends on unstated condition | List hypotheses and exceptional cases |
| Accidental alignment | Points or lines appear related by drawing | Derive relation from construction |
| Finite pattern | Early cases suggest false generalization | Search counterexamples and prove induction or structure |
The danger of visual proof is not that it is visual. The danger is unexamined visual authority.
Visual Proof in Mathematical Education
Visual proof is one of the strongest bridges between intuition and rigor. Students often encounter mathematics as symbol manipulation before they understand what the symbols mean. Visual arguments can slow the process down and make structure visible. They can show why a formula has a certain form, why a proof strategy works, or why a theorem is plausible.
Visual proof also supports diverse forms of mathematical understanding. Some learners grasp spatial relations before symbolic rules. Some need diagrams to see how quantities relate. Some use visual memory to organize proof. Visual methods can make mathematics more accessible when they are paired with language, symbolic notation, and formal argument.
\text{visual learning}=\text{intuition}+\text{structure}+\text{formalization}
\]
Interpretation: Visual proof supports learning when it moves from intuition to visible structure and then toward formal justification.
The educational challenge is to prevent diagrams from becoming decorative. A diagram should not merely accompany a proof; it should be interrogated. What does it show? What relation is preserved? What can be changed? What is arbitrary? What would make the argument fail?
| Educational Use | Benefit | Teacher Question |
|---|---|---|
| Area models | Make algebraic identities meaningful | What area is counted two ways? |
| Geometric construction | Connect proof to spatial relation | Which relation follows from construction? |
| Graphing | Show behavior and variation | What does the graph hide? |
| Dynamic geometry | Reveal invariants under movement | What remains true when the figure changes? |
| Proofs without words | Invite reconstruction of argument | Can the student supply the missing words? |
Visual proof helps students understand that proof is not only a ritual of symbols. It is a way of seeing why structure forces truth.
Visual Proof, Diagrams, and AI-Assisted Mathematics
Visual proof is increasingly important for AI-assisted mathematics because many mathematical problems require diagrams, spatial relations, or multimodal reasoning. Geometry problems, graph problems, topology, knot diagrams, circuit diagrams, and category-theoretic diagrams all require more than text. An AI system that reads only prose may miss essential visual constraints.
Recent work on automated geometry and diagram formalization reflects this challenge. A mathematical diagram must be converted into structured relations: points, lines, incidences, angles, lengths, intersections, constraints, and dependencies. The hard problem is not merely recognizing an image. It is understanding the mathematical relations represented by the image.
\text{diagram image}\rightarrow \text{formal relations}\rightarrow \text{mathematical reasoning}
\]
Interpretation: AI-assisted visual proof requires translating visual information into structured mathematical relations that can be checked or reasoned over.
This creates a natural partnership among visual representation, symbolic reasoning, and formal checking. AI may identify or generate diagrams. A geometry engine may derive relations. A proof assistant may verify formal statements. Humans still need to interpret the result and decide whether the visual reasoning captures the intended theorem.
| AI-Visual Task | Mathematical Challenge | Responsible Check |
|---|---|---|
| Diagram recognition | Identify mathematical objects and relations | Check that visual features match formal constraints |
| Diagram generation | Create a figure satisfying problem conditions | Verify construction and avoid accidental relations |
| Auxiliary construction | Suggest helpful new objects | Prove why the construction is valid and useful |
| Visual proof explanation | Turn diagrammatic insight into readable argument | Check every inference against formal relations |
| Formal diagram reasoning | Encode diagrams as structured data | Review semantics and proof rules |
AI may make visual proof more powerful, but it also makes verification more important. A generated diagram is not a proof. A recognized relation is not a theorem. The visual output must be checked.
Visual Proof, Accessibility, and Responsibility
Visual proof raises questions of accessibility and responsibility. Visual reasoning can make mathematics more intuitive for many learners, but it can also exclude people when diagrams are not described, when color is used without redundancy, when spatial interpretation is assumed, or when visual information is not available in alternative forms.
Responsible visual mathematics should make diagrams legible. It should describe what the diagram is meant to show. It should avoid relying only on color. It should label structures clearly when labels are appropriate. It should provide verbal or symbolic equivalents. It should distinguish illustrative diagrams from proof-bearing diagrams. It should make assumptions explicit.
\text{visual clarity}=\text{structure}+\text{description}+\text{accessibility}
\]
Interpretation: Visual mathematical communication should make structure visible while also making the argument accessible beyond the image itself.
Visual proof also has ethical significance in public communication. Charts, graphs, maps, and mathematical diagrams can persuade. They can clarify, but they can also manipulate. Scale, color, cropping, aggregation, and design choices shape interpretation. Mathematical visualizations used in policy, science, economics, health, and technology must be designed responsibly.
| Responsibility Issue | Risk | Responsible Practice |
|---|---|---|
| Accessibility | Diagram excludes users who cannot rely on visual cues | Provide textual explanation and structural description |
| Color dependence | Meaning lost for color-blind or nonvisual users | Use labels, patterns, contrast, and redundant encoding |
| Misleading scale | Visual exaggeration distorts interpretation | Label axes and preserve honest proportions |
| Decorative diagrams | Image appears mathematical but carries no argument | Explain what relation the diagram establishes |
| Authority effect | Diagram persuades without proof | Distinguish visual intuition from formal justification |
Visual proof should deepen mathematical understanding, not hide assumptions behind persuasive images.
A Mathematical Lens: See, Abstract, Prove, Interpret
A useful lens for visual proof is: see, abstract, prove, interpret. Seeing identifies a pattern or relation. Abstraction separates the essential structure from accidental features. Proof establishes the claim under stated assumptions. Interpretation explains why the result matters and how the visual argument should be understood.
\text{See}\rightarrow \text{Abstract}\rightarrow \text{Prove}\rightarrow \text{Interpret}
\]
Interpretation: Visual proof becomes rigorous when visual insight is abstracted into general structure, proved, and interpreted responsibly.
This lens applies across mathematics. In algebra, an area model must be abstracted into an identity. In combinatorics, an arrangement must become a counting argument. In geometry, a diagram must become a relation-based proof. In calculus, a graph must become a limit argument. In data visualization, a pattern must be tied to statistical and modeling assumptions.
| Stage | Question | Failure Mode |
|---|---|---|
| See | What pattern, relation, or structure is visible? | Noticing only a special case |
| Abstract | What is essential and what is accidental? | Confusing drawing features with theorem conditions |
| Prove | Why does the relation hold generally? | Visual plausibility without justification |
| Interpret | What does the proof reveal? | Diagram treated as decoration rather than reasoning |
This framework respects visual thinking without romanticizing it. The diagram matters, but so does the movement beyond the diagram.
Computational Companion Examples
The companion repository for this article should extend the Mathematical Thinking codebase with visual-proof audit workflows, diagram-relation metadata, proof-without-words classification, geometric invariant checks, graph-drawing caution tables, dynamic-geometry observation records, Haskell typed visual-proof models, SQL diagram schemas, and responsible visual-argument checklists.
Python: Visual Proof Audit
from dataclasses import dataclass
from typing import Literal

VisualRole = Literal[
    "illustration",
    "evidence",
    "heuristic",
    "diagrammatic_argument",
    "formal_diagrammatic_proof"
]

@dataclass(frozen=True)
class VisualProofAudit:
    title: str
    visual_role: VisualRole
    visible_structure: str
    generalization_question: str
    proof_requirement: str
    risk: str

audits = [
    VisualProofAudit(
        title="sum of odd numbers as square layers",
        visual_role="diagrammatic_argument",
        visible_structure="successive odd layers build a square",
        generalization_question="Does the layer pattern hold for arbitrary n?",
        proof_requirement="explain why the nth layer has size 2n-1 and forms an n by n square",
        risk="viewer sees pattern but cannot state the general argument"
    ),
    VisualProofAudit(
        title="area model for binomial square",
        visual_role="diagrammatic_argument",
        visible_structure="large square decomposes into two squares and two rectangles",
        generalization_question="Are side lengths arbitrary positive quantities?",
        proof_requirement="show area preservation and identify all parts",
        risk="forgetting the two cross terms"
    ),
    VisualProofAudit(
        title="graph drawing of connected network",
        visual_role="evidence",
        visible_structure="vertices appear clustered and connected",
        generalization_question="Is the property about the abstract graph or this drawing?",
        proof_requirement="use graph definitions for connectivity and distance",
        risk="confusing page geometry with graph structure"
    ),
    VisualProofAudit(
        title="dynamic geometry invariant",
        visual_role="heuristic",
        visible_structure="angle appears constant under dragging",
        generalization_question="What construction forces the angle relation?",
        proof_requirement="derive relation from geometry theorems",
        risk="experimental observation mistaken for proof"
    ),
]

for item in audits:
    print(f"{item.title}: {item.visual_role} / {item.proof_requirement}")
R: Visual Proof Risk Table
visual_proof_risks <- data.frame(
  risk = c(
    "special case",
    "scale illusion",
    "hidden assumption",
    "accidental alignment",
    "finite pattern",
    "accessibility gap"
  ),
  problem = c(
    "diagram represents only one configuration",
    "graph or figure distorts relation through scale",
    "argument depends on unstated condition",
    "points or lines appear related because of drawing choices",
    "early examples suggest false generalization",
    "visual argument is not available in nonvisual form"
  ),
  mitigation = c(
    "vary the case and identify invariant relations",
    "check axes, units, and numerical values",
    "list hypotheses and exceptional cases",
    "derive relation from construction",
    "search counterexamples and prove general structure",
    "provide verbal, symbolic, and structural description"
  )
)

print(visual_proof_risks)
Haskell: Typed Visual Proof Model
{-# OPTIONS_GHC -Wall #-}

data VisualRole
  = Illustration
  | Evidence
  | Heuristic
  | DiagrammaticArgument
  | FormalDiagrammaticProof
  deriving (Eq, Show)

data VisualDomain
  = Geometry
  | Algebra
  | Combinatorics
  | GraphTheory
  | Calculus
  | CategoryDiagram
  deriving (Eq, Show)

data ProofStatus
  = VisualOnly
  | NeedsGeneralization
  | InformallyJustified
  | FormallyProved
  deriving (Eq, Show)

data VisualProofRecord = VisualProofRecord
  { title :: String
  , domain :: VisualDomain
  , role :: VisualRole
  , status :: ProofStatus
  , humanReview :: String
  } deriving (Eq, Show)

records :: [VisualProofRecord]
records =
  [ VisualProofRecord "odd sums as square layers" Combinatorics DiagrammaticArgument InformallyJustified
      "state why the layer pattern holds for arbitrary n"
  , VisualProofRecord "binomial square area model" Algebra DiagrammaticArgument InformallyJustified
      "show area preservation and identify all parts"
  , VisualProofRecord "dynamic geometry invariant" Geometry Heuristic NeedsGeneralization
      "derive invariant from construction"
  , VisualProofRecord "graph drawing connectivity" GraphTheory Evidence NeedsGeneralization
      "separate drawing from abstract graph"
  ]

main :: IO ()
main = mapM_ print records
SQL: Visual Proof Schema
CREATE TABLE visual_proof_record (
  record_id TEXT PRIMARY KEY,
  title TEXT NOT NULL,
  domain TEXT NOT NULL,
  visual_role TEXT NOT NULL,
  visible_structure TEXT NOT NULL,
  proof_status TEXT NOT NULL
);

CREATE TABLE diagram_relation (
  relation_id TEXT PRIMARY KEY,
  record_id TEXT NOT NULL,
  visual_feature TEXT NOT NULL,
  mathematical_relation TEXT NOT NULL,
  proof_requirement TEXT NOT NULL
);

CREATE TABLE visual_risk (
  risk_id TEXT PRIMARY KEY,
  risk_name TEXT NOT NULL,
  problem TEXT NOT NULL,
  mitigation TEXT NOT NULL
);

CREATE TABLE accessibility_review (
  review_id TEXT PRIMARY KEY,
  record_id TEXT NOT NULL,
  visual_dependency TEXT NOT NULL,
  alternative_description TEXT NOT NULL,
  accessibility_note TEXT NOT NULL
);
These examples treat visual proof as an auditable mathematical workflow. A diagram is classified by role, domain, visible structure, proof status, risk, and accessibility requirements. The goal is not to reduce visual proof to metadata, but to make visual reasoning more responsible and reusable.
GitHub Repository
The companion repository for this article is designed as a reproducible mathematical-thinking workspace focused on visual-proof audit workflows, diagram-relation metadata, proof-without-words classification, geometric invariant checks, graph-drawing caution tables, dynamic-geometry observation records, Haskell typed visual-proof models, SQL diagram schemas, and responsible visual-argument checklists.
Complete Code Repository
Companion article folder with Python, R, Julia, SQL, Haskell, Rust, Go, C++, Fortran, and C examples for professional mathematical exploration of visual proof, diagrammatic reasoning, proofs without words, geometric invariants, visual algebra, combinatorial arrangements, graph drawings, dynamic geometry, accessibility, and responsible mathematical visualization.
The Future of Visual Proof
The future of visual proof will likely be hybrid. Diagrams will remain central to human intuition. Dynamic geometry will support exploration. Computational visualization will reveal patterns in data, networks, shapes, and models. Proof assistants may formalize some diagrammatic arguments. AI systems may help generate, interpret, or formalize mathematical diagrams. But the deepest issue will remain human: how do we move from seeing to knowing?
Visual proof will become more important as mathematics becomes more computational, interdisciplinary, and public. Models, simulations, networks, uncertainty, algorithms, and formal systems all require visual interpretation. The danger is that images may acquire authority faster than they acquire justification. The opportunity is that visual reasoning can make mathematical structure more accessible, memorable, and meaningful.
The strongest mathematical culture will not choose between visual intuition and formal proof. It will learn how to make them work together. Visual proof can reveal structure. Symbolic proof can generalize it. Formal proof can check it. Explanation can communicate it. Accessibility practices can widen participation. Ethical design can prevent visual authority from becoming manipulation.
Mathematical thinking and visual proof therefore belong together. To see is not always to prove. But to see well is often the beginning of proof.
Related Articles
- Geometry and the Visual Mind in Mathematics
- Mathematical Thinking and AI-Assisted Discovery
- Mathematical Thinking and Proof Assistants
- Mathematical Thinking in an Age of Automation
- Conjecture, Creativity, and Mathematical Discovery
- Non-Algorithmic Reasoning and the Future of Mathematics Learning
- Algorithms, Proof, and Formal Reasoning
- Graphs, Networks, and Discrete Structure
- Mathematical Thinking and Category-Level Abstraction
- Mathematics as the Science of Patterns
Further Reading
- Giaquinto, M. (2015) ‘The Epistemology of Visual Thinking in Mathematics’, Stanford Encyclopedia of Philosophy. Available at: https://plato.stanford.edu/entries/epistemology-visual-thinking/
- Shin, S.-J., Lemon, O. and Mumma, J. (2018) ‘Diagrams’, Stanford Encyclopedia of Philosophy. Available at: https://plato.stanford.edu/entries/diagrams/
- Nelsen, R.B. (1993) Proofs Without Words: Exercises in Visual Thinking. Washington, DC: Mathematical Association of America. Available at: https://bookstore.ams.org/clrm-1
- Avigad, J., Dean, E. and Mumma, J. (2009) ‘A Formal System for Euclid’s Elements’, The Review of Symbolic Logic. Available at: https://arxiv.org/abs/0810.4315
- Mumma, J. (2010) ‘Proofs, Pictures, and Euclid’, Synthese, 175, pp. 255–287. Available at: https://link.springer.com/article/10.1007/s11229-009-9494-3
- Giaquinto, M. (2007) Visual Thinking in Mathematics: An Epistemological Study. Oxford: Oxford University Press. Available at: https://academic.oup.com/book/4181
- Barwise, J. and Etchemendy, J. (1996) Visual Information and Valid Reasoning. Available at: https://web.stanford.edu/class/cs208e/papers/barwise-etchemendy.pdf
- NRICH (n.d.) Dynamic Geometry. University of Cambridge. Available at: https://nrich.maths.org/dynamic-geometry
- Krueger, R., Han, J.M. and Selsam, D. (2020) ‘Automatically Building Diagrams for Olympiad Geometry Problems’. Available at: https://arxiv.org/abs/2012.02590
- Zhang, Z. et al. (2024) ‘Diagram Formalization Enhanced Multi-Modal Geometry Problem Solver’. Available at: https://arxiv.org/abs/2409.04214
References
- Avigad, J., Dean, E. and Mumma, J. (2009) ‘A Formal System for Euclid’s Elements’, The Review of Symbolic Logic. Available at: https://arxiv.org/abs/0810.4315
- Barwise, J. and Etchemendy, J. (1996) Visual Information and Valid Reasoning. Available at: https://web.stanford.edu/class/cs208e/papers/barwise-etchemendy.pdf
- Euclid (1956) The Thirteen Books of Euclid’s Elements, translated by T.L. Heath. 2nd edn. New York: Dover. Available at: https://archive.org/details/EuclidsElementsBooksIIIVolume1Heath
- Giaquinto, M. (2007) Visual Thinking in Mathematics: An Epistemological Study. Oxford: Oxford University Press. Available at: https://academic.oup.com/book/4181
- Giaquinto, M. (2015) ‘The Epistemology of Visual Thinking in Mathematics’, Stanford Encyclopedia of Philosophy. Available at: https://plato.stanford.edu/entries/epistemology-visual-thinking/
- Krueger, R., Han, J.M. and Selsam, D. (2020) ‘Automatically Building Diagrams for Olympiad Geometry Problems’. Available at: https://arxiv.org/abs/2012.02590
- Mumma, J. (2010) ‘Proofs, Pictures, and Euclid’, Synthese, 175, pp. 255–287. Available at: https://link.springer.com/article/10.1007/s11229-009-9494-3
- Nelsen, R.B. (1993) Proofs Without Words: Exercises in Visual Thinking. Washington, DC: Mathematical Association of America. Available at: https://bookstore.ams.org/clrm-1
- NRICH (n.d.) Dynamic Geometry. University of Cambridge. Available at: https://nrich.maths.org/dynamic-geometry
- Shin, S.-J., Lemon, O. and Mumma, J. (2018) ‘Diagrams’, Stanford Encyclopedia of Philosophy. Available at: https://plato.stanford.edu/entries/diagrams/
- Zhang, Z. et al. (2024) ‘Diagram Formalization Enhanced Multi-Modal Geometry Problem Solver’. Available at: https://arxiv.org/abs/2409.04214