
Last Updated June 2, 2026
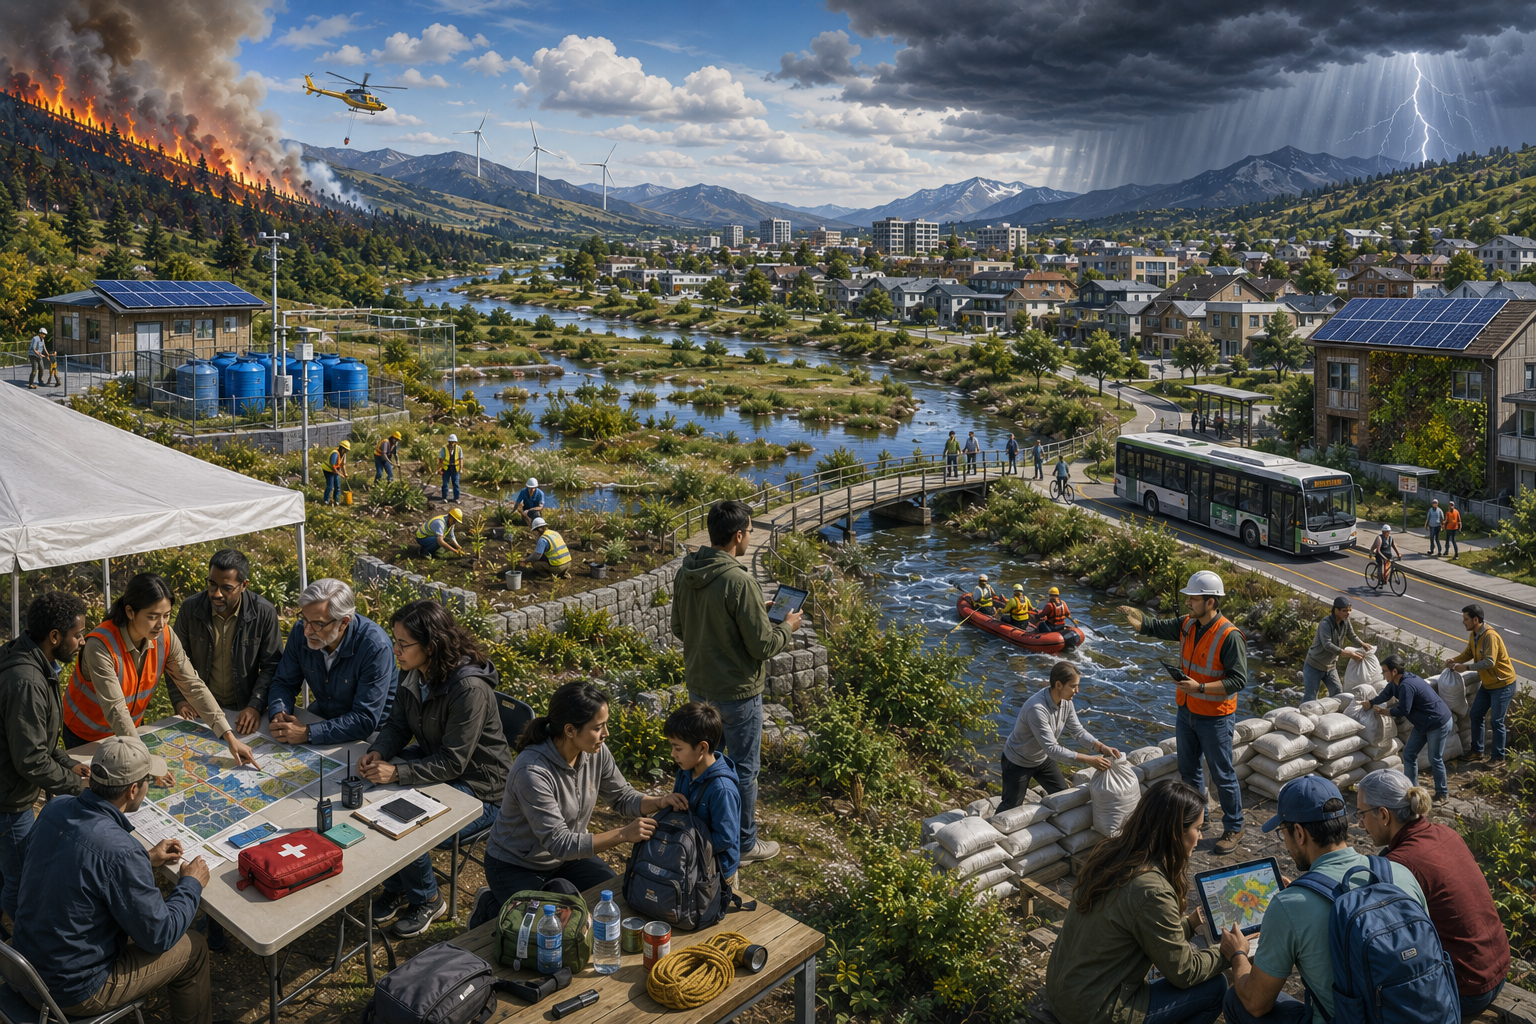
Disaster Risk Reduction and resilience belong together because disaster is not produced by hazard alone. Disaster emerges when hazardous events or processes interact with exposed people, vulnerable systems, fragile infrastructure, degraded ecosystems, weak institutions, unequal protection, and insufficient capacity. A flood, wildfire, heatwave, storm, drought, earthquake, epidemic, or technological failure becomes a disaster through the conditions that shape who is in harm’s way, how prepared systems are, how quickly essential functions can be restored, and whether recovery reduces future risk or rebuilds the same vulnerability.
Disaster Risk Reduction is the systematic effort to identify, assess, prevent, reduce, and govern the drivers of disaster risk. Resilience refers to the capacity of systems to absorb disturbance, maintain essential function, recover, adapt, learn, and, when necessary, transform. Together, they provide a unified framework for governing risk in complex systems where hazards, exposure, vulnerability, capacity, feedback, infrastructure, ecosystems, institutions, economies, and communities interact over time.
This article examines Disaster Risk Reduction and resilience as a systems problem rather than a narrow emergency-management problem. It explains why disasters are socially and institutionally produced, how DRR evolved from response to prevention, why resilience thinking adds a dynamic view of function and recovery, how climate change intensifies disaster risk, why community knowledge and justice matter, how infrastructure and institutions shape cascading failure, and how measurement, modeling, and public investment can support risk reduction before hazard becomes catastrophe.
What Disaster Risk Reduction Means
Disaster Risk Reduction focuses on reducing disaster risk by addressing the underlying conditions that allow hazards to become catastrophic. It includes hazard identification, exposure assessment, vulnerability analysis, preparedness, mitigation, prevention, early warning, response capacity, recovery planning, governance, public investment, and long-term risk reduction. DRR begins from the recognition that disasters are not simply “natural” events. They are produced through the interaction of hazardous processes with social, ecological, infrastructural, economic, and institutional vulnerability.
In a narrow emergency-management model, disaster planning begins when an event is imminent or already underway. In a DRR framework, the most important work begins earlier: before homes are built in floodplains, before wetlands are destroyed, before infrastructure maintenance is deferred, before public-health systems are underfunded, before early warning systems fail, before evacuation routes exclude people without cars, before heat vulnerability is locked into housing and labor conditions, and before recovery policy reproduces the same exposure that produced the previous loss.
DRR therefore shifts attention from event response to risk production. It asks how land use, poverty, housing, infrastructure, environmental degradation, governance failure, economic inequality, climate stress, and weak public capacity create conditions in which hazard becomes disaster. It also asks what can be changed before the next disruption occurs.
| DRR concept | Core question | Example |
|---|---|---|
| Hazard | What potentially damaging event or process may occur? | Flood, wildfire, earthquake, drought, heatwave, storm surge, landslide, epidemic. |
| Exposure | Who or what is located where harm can occur? | Homes in floodplains, hospitals in storm zones, power lines in wildfire corridors. |
| Vulnerability | Why are exposed people or systems susceptible to harm? | Poor housing, poverty, degraded ecosystems, weak infrastructure, limited access, poor health. |
| Capacity | What resources, institutions, knowledge, and systems can reduce harm? | Early warning, shelters, healthcare, emergency logistics, mutual aid, public finance. |
| Risk governance | Who is responsible for reducing risk before and after disruption? | Land-use regulation, infrastructure standards, public investment, recovery rules, accountability. |
Disaster Risk Reduction is strongest when it treats risk as something that can be governed, not simply endured.
Disasters Are Not Natural
One of the central insights of Disaster Risk Reduction is that hazards may be natural, technological, biological, climatic, or social, but disasters are not simply natural. A hurricane is a hazard. A floodplain development pattern is a policy choice. A heatwave is a hazard. Uninsulated housing, low tree canopy, energy unaffordability, and unsafe labor conditions are social and institutional conditions. A wildfire is a hazard. Land management, housing expansion, grid design, evacuation planning, and insurance policy shape whether fire becomes mass loss.
This distinction matters because calling disasters “natural” can obscure responsibility. It can make loss appear inevitable when vulnerability has been produced over years or decades. It can also hide unequal exposure: one community may have drainage, insurance, evacuation access, and rapid recovery funding, while another faces repeated flooding, mold, debt, displacement, and delayed repair. The hazard may be shared, but the disaster is distributed through power, infrastructure, wealth, governance, and public capacity.
DRR therefore asks who is made vulnerable, who is protected, who benefits from risky development, who pays for recovery, who is included in planning, and whose warnings are ignored. These are not secondary ethical questions added after technical risk analysis. They are part of the structure of disaster risk itself.
How disaster risk is produced
Risky land use
Settlement, infrastructure, or development is allowed in places where hazards are known or increasing.
Unequal protection
Some neighborhoods receive stronger infrastructure, insurance access, warning systems, or recovery support than others.
Deferred maintenance
Roads, levees, bridges, drainage systems, water systems, hospitals, and power networks become fragile before crisis.
Ecological degradation
Wetlands, forests, dunes, reefs, soils, and watersheds lose the capacity to buffer hazards.
Weak institutions
Fragmented authority, poor coordination, corruption, underfunding, and low trust deepen harm.
Social vulnerability
Poverty, disability, age, health burden, housing insecurity, language barriers, and exclusion shape disaster outcomes.
To say disasters are not natural is not to deny the force of hazards. It is to recognize that harm is shaped by social, ecological, infrastructural, and political choices long before the hazard arrives.
Resilience and Disaster Risk Reduction
Resilience extends DRR by focusing on how systems behave before, during, and after disruption. DRR emphasizes prevention, mitigation, preparedness, risk governance, and the reduction of exposure and vulnerability. Resilience emphasizes functional continuity, recovery, adaptation, learning, reorganization, and transformation. The two frameworks are therefore complementary. DRR reduces the conditions that make disaster likely. Resilience strengthens the capacity of systems to function under the risks that remain.
This distinction is useful but not absolute. Good DRR builds resilience, and serious resilience requires DRR. A community cannot be called resilient if it is repeatedly placed in avoidable danger without public investment. A city cannot be called resilient if it recovers quickly in wealthy areas while low-income neighborhoods remain displaced. A system cannot be called resilient if it absorbs repeated loss only by exhausting workers, depleting ecosystems, increasing debt, or shifting risk onto marginalized people.
Resilience thinking adds a dynamic systems perspective. It asks how disturbance affects function, how recovery unfolds over time, whether adaptation reduces future risk, whether feedback is used for learning, whether thresholds are approaching, and whether transformation is necessary when old arrangements become unsafe. DRR becomes stronger when it incorporates this dynamic understanding of system behavior.
| Framework | Primary emphasis | Key question |
|---|---|---|
| Disaster Risk Reduction | Prevention, mitigation, preparedness, exposure reduction, vulnerability reduction | How can we reduce the conditions that turn hazard into disaster? |
| Resilience | Absorption, continuity, recovery, adaptation, learning, transformation | How can systems maintain or restore essential function under disturbance? |
| Integrated DRR-resilience | Risk governance before, during, and after disruption | How can systems reduce risk, protect people, recover justly, and adapt over time? |
DRR without resilience can become too focused on hazard control. Resilience without DRR can become too accepting of repeated harm. Their integration is what makes the framework powerful.
Core Components of Disaster Risk Reduction
Disaster Risk Reduction is not a single intervention. It is a cycle of analysis, prevention, preparedness, response, recovery, governance, and learning. These components must work together. A strong warning system is insufficient if evacuation is inaccessible. Strong emergency response is insufficient if land-use policy repeatedly places people in danger. Recovery funding is insufficient if reconstruction rebuilds vulnerability. The components below should therefore be understood as a connected risk-governance system.
Risk Identification and Assessment
Risk identification and assessment provide the analytical foundation for DRR. This includes hazard mapping, exposure inventories, vulnerability analysis, climate scenarios, infrastructure dependency mapping, social vulnerability assessment, ecological risk review, and community-based knowledge gathering. The purpose is not only to estimate possible losses, but to understand how risk is produced, distributed, amplified, and reduced across systems.
Risk Prevention and Mitigation
Risk prevention and mitigation reduce the likelihood or severity of disaster before disruption occurs. Examples include land-use planning, building standards, floodplain restoration, slope stabilization, drainage design, fire management, ecosystem protection, safe siting of critical facilities, infrastructure upgrades, heat-reduction strategies, and public-health prevention. Prevention is often less visible than response, but it is usually more effective at reducing avoidable harm.
Preparedness and Early Warning
Preparedness includes emergency plans, training, stockpiles, communication systems, mutual aid agreements, evacuation planning, shelter access, surge staffing, early warning, and public education. Early warning is not only a technical alert. It requires trust, language access, accessible communication, transportation options, community networks, and clear instructions. A warning that people cannot act on is not an effective warning.
Response and Critical Function Continuity
Response refers to emergency action during disruption: evacuation, search and rescue, emergency medical care, communications, resource distribution, shelter, security, logistics, and restoration of critical services. From a resilience perspective, response is also about maintaining essential function. Water, power, healthcare, transport, communications, food access, sanitation, and public information are not optional conveniences during disaster. They are the operating conditions of survival and recovery.
Recovery, Reconstruction, and Risk Reduction
Recovery is not simply the restoration of what existed before. If recovery rebuilds the same exposure, vulnerability, and institutional weakness, it prepares the next disaster. Risk-informed recovery asks whether housing, infrastructure, ecosystems, public services, and livelihoods can be rebuilt in ways that reduce future harm. This includes equitable repair, anti-displacement safeguards, public-health support, infrastructure redesign, ecosystem restoration, and long-term adaptation.
Risk Governance and Learning
Risk governance connects DRR to institutions, law, finance, accountability, public participation, and implementation. It defines who is responsible, who pays, who participates, who receives protection, and how lessons are used. Learning matters because risk changes over time. Climate baselines shift, infrastructure ages, development patterns change, populations move, ecosystems degrade or recover, and institutions gain or lose trust. DRR must therefore be adaptive, not static.
| DRR component | Main purpose | Failure if neglected |
|---|---|---|
| Risk identification | Understand hazards, exposure, vulnerability, capacity, and system dependencies | Risk remains invisible until disaster occurs. |
| Prevention and mitigation | Reduce the conditions that make disaster likely or severe | Hazards repeatedly become avoidable losses. |
| Preparedness | Ensure people and institutions can act before and during disruption | Warning, evacuation, communication, and logistics fail under pressure. |
| Response | Protect life and maintain essential functions during crisis | Temporary disruption cascades into prolonged emergency. |
| Recovery | Restore function while reducing future vulnerability | Reconstruction rebuilds risk into the next disaster cycle. |
| Governance and learning | Assign responsibility, fund action, include communities, and revise strategy | Risk reduction remains fragmented, reactive, and unaccountable. |
DRR becomes resilient when each component reinforces the others rather than operating as a disconnected checklist.
A Systems Perspective on Disaster Risk
Disaster risk is systemic because hazards move through networks of dependency. Infrastructure, ecosystems, economies, institutions, communities, housing systems, public health, supply chains, and communications interact. A hazard that begins in one domain can become a wider crisis when it disrupts the systems that other systems rely on. Flooding can shut roads, which delays emergency response, which slows medical care, which deepens health loss, which affects labor availability, which slows recovery. Power failure can disrupt water treatment, communications, hospitals, cooling, food storage, and digital coordination. Institutional failure can delay all of these responses.
A systems perspective therefore shifts DRR from isolated hazard planning to dependency mapping. The question is not only what hazard may occur, but what functions depend on what other functions. Which nodes are critical? Where are bottlenecks? Where is redundancy missing? Which communities would be cut off first? Which systems would fail together? Which slow variables are weakening capacity before the event?
| System dependency | Disaster pathway | DRR implication |
|---|---|---|
| Power and water | Grid failure disrupts pumping, treatment, refrigeration, sanitation, and hospital operations | Protect backup power, distributed energy, water storage, and critical-service islanding. |
| Transport and healthcare | Flooded roads delay ambulances, staff arrival, supply delivery, and evacuation | Map alternate routes, protect critical corridors, and pre-position resources. |
| Communications and coordination | Outages prevent warnings, public instructions, mutual aid, and agency coordination | Build redundant communication channels and trusted local networks. |
| Ecosystems and infrastructure | Wetland loss, deforestation, or soil degradation increases flood, landslide, heat, and drought risk | Treat ecological restoration as risk-reduction infrastructure. |
| Housing and recovery | Unsafe or insecure housing turns hazard into displacement, debt, and long recovery | Include housing repair, tenant protection, and anti-displacement safeguards in DRR. |
Systems thinking makes visible the pathways through which local disruption becomes cascading disaster.
Climate Change and Disaster Risk
Climate change intensifies DRR because it alters the hazard landscape. Many places face more frequent, severe, longer-lasting, or compound risks involving heat, drought, wildfire, extreme precipitation, floods, coastal storm surge, sea-level rise, ecosystem stress, food insecurity, water scarcity, and disease shifts. Historical baselines become less reliable when climate conditions are changing. Infrastructure designed for past rainfall, temperature, river flow, fire behavior, or coastal conditions may no longer match present or future risk.
Climate change also increases the importance of slow variables. Groundwater decline, soil degradation, tree canopy loss, insurance retreat, public-health strain, ecosystem degradation, maintenance backlog, housing insecurity, and institutional distrust can accumulate slowly before an acute hazard exposes them. DRR must therefore address both acute shocks and chronic stresses. A flood plan that ignores land-use change and wetland loss is incomplete. A heat plan that ignores housing and labor is incomplete. A wildfire plan that ignores ecosystem management, evacuation inequality, and grid fragility is incomplete.
Climate resilience and DRR are now inseparable. Risk reduction must account for changing baselines, compound hazards, uncertainty, thresholds, and adaptation limits. It must also avoid maladaptation: interventions that reduce immediate risk while increasing future vulnerability, emissions, displacement, or ecological harm.
Climate pressures that reshape DRR
Changing baselines
Past hazard frequencies and design standards may no longer predict future conditions.
Compound hazards
Heat, drought, wildfire smoke, flood, grid stress, and public-health burdens may overlap.
Slow-onset stress
Sea-level rise, salinization, groundwater decline, and ecosystem degradation accumulate over time.
Adaptation limits
Some systems may eventually require relocation, transformation, or development-pathway change.
Climate change makes DRR a long-term governance challenge, not only a preparedness exercise.
Compound Risk and Cascading Failure
Compound risk occurs when multiple hazards, stresses, or vulnerabilities interact. Cascading failure occurs when disruption spreads from one system to another through dependency. These patterns are central to modern disaster risk because societies are increasingly interconnected. A single event can trigger effects across infrastructure, health, housing, finance, ecosystems, supply chains, and governance.
For example, a heatwave can increase cooling demand, strain the grid, cause power outages, disable cooling, increase hospital admissions, disrupt work, and deepen household financial stress. A flood can damage homes, close roads, contaminate water, interrupt schooling, displace residents, and reduce local tax revenue. A wildfire can destroy homes, produce smoke exposure hundreds of miles away, trigger evacuations, disrupt insurance markets, and place long-term stress on public budgets.
| Initial disruption | Possible cascade | Risk-reduction strategy |
|---|---|---|
| Heatwave | Cooling demand → grid stress → outage → health emergency → hospital surge | Energy efficiency, distributed power, cooling access, heat-health alerts, labor protections. |
| Flood | Road closure → delayed response → supply disruption → prolonged recovery | Alternate routes, resilient logistics, local resource hubs, floodplain restoration. |
| Wildfire | Fire damage → smoke exposure → evacuation → grid shutdown → displacement | Fuel management, clean air shelters, evacuation planning, grid resilience, housing support. |
| Drought | Water shortage → crop loss → food prices → household insecurity → public-health burden | Water governance, soil health, crop diversity, food assistance, demand management. |
| Power outage | Loss of electricity → water failure → communications failure → healthcare disruption | Backup systems, microgrids, critical-service islanding, emergency communications. |
DRR must therefore move beyond single-hazard planning. It needs scenario stress testing, dependency mapping, redundancy, modularity, and cross-sector governance.
Community-Level Disaster Risk Reduction
DRR is often most effective when it is grounded in community knowledge and local capacity. People closest to risk often know where flooding starts, which roads fail, which households need help, where informal shelter exists, which warnings are trusted, which institutions are avoided, which language access gaps matter, and which official plans do not match lived conditions. This knowledge is not anecdotal noise. It is operational intelligence.
Community-level DRR includes neighborhood preparedness, mutual aid, local emergency communication, participatory mapping, trusted messengers, accessible evacuation planning, community response teams, local shelters, culturally appropriate communication, and direct participation in planning and recovery. It also includes recognizing that communities are not only vulnerable. They are sources of adaptive capacity, social memory, practical knowledge, and collective response.
However, community resilience should never be used as an excuse for public abandonment. Local capacity is vital, but communities should not be expected to compensate for underinvestment, unsafe infrastructure, unaffordable housing, weak public health, or exclusionary governance. Community-based DRR is strongest when local knowledge is paired with public responsibility and material support.
Community-level DRR capacities
Local risk knowledge
Residents identify flood points, heat exposure, evacuation barriers, informal care networks, and service gaps.
Trusted communication
Warnings move through credible messengers, accessible formats, multilingual channels, and local institutions.
Mutual aid
Neighbors, organizations, and local groups support food, transport, shelter, care, and recovery.
Participatory planning
Communities shape risk priorities, adaptation investments, relocation decisions, and recovery rules.
Community-level DRR is not only about preparing people for disaster. It is about giving communities real authority in reducing the risks they are asked to endure.
Infrastructure and Disaster Risk Reduction
Infrastructure shapes whether hazards remain manageable or become cascading crises. Roads, bridges, drainage systems, levees, power grids, water systems, hospitals, communications networks, ports, rail systems, schools, shelters, and digital systems determine how people move, communicate, receive care, access water, maintain livelihoods, and recover. When infrastructure is fragile, disasters spread faster and recovery takes longer.
Infrastructure DRR includes safe siting, hazard-resistant design, maintenance, redundancy, modularity, distributed capacity, ecological buffers, real-time monitoring, emergency operations planning, and recovery logistics. It also includes governance: infrastructure systems only reduce disaster risk when standards are enforced, maintenance is funded, risks are disclosed, and service continuity is prioritized for vulnerable populations.
Resilient infrastructure is not only hardened infrastructure. Hardening may be necessary, but resilience also requires flexibility, recoverability, backup capacity, and the ability to isolate failures before they cascade. In some cases, the most effective infrastructure is ecological: wetlands, dunes, forests, watersheds, soils, mangroves, floodplains, and urban tree canopy.
| Infrastructure domain | DRR concern | Resilience strategy |
|---|---|---|
| Power | Outages cascade into water, health, cooling, communications, and food storage | Distributed energy, microgrids, backup power, grid modernization, demand response. |
| Water and sanitation | Flood, drought, contamination, and power loss threaten public health | Backup power, storage, watershed protection, leak reduction, treatment redundancy. |
| Transport | Road and transit failure can isolate people and delay response | Redundant routes, elevated corridors, evacuation access, resilient public transit. |
| Healthcare | Hospitals and clinics may face surge, outages, supply disruption, and staffing strain | Continuity planning, backup systems, mobile care, supply resilience, surge staffing. |
| Communications | Loss of communication weakens warning, coordination, and public trust | Redundant networks, low-tech backups, multilingual alerts, community messengers. |
| Ecological infrastructure | Degraded ecosystems increase flood, heat, erosion, drought, and fire risk | Wetland restoration, floodplain reconnection, forest management, soil protection. |
Infrastructure DRR is most effective when it protects essential functions, reduces cascading failure, and serves people who cannot buy private resilience.
Governance and Institutional Dimensions
Effective DRR depends on governance because risk reduction requires decisions before crisis. Institutions set land-use rules, enforce building codes, maintain infrastructure, fund public health, regulate development, coordinate emergency systems, manage environmental resources, protect workers, distribute recovery funds, and decide whether warnings become action. Weak governance can produce disaster even when hazards are well understood.
Institutional resilience matters because disasters test coordination, legitimacy, memory, trust, and administrative capacity. A plan that exists on paper may fail if agencies do not coordinate, if communities distrust authorities, if data are outdated, if funding is absent, if authority is fragmented, or if political incentives reward response visibility over prevention.
Governance also shapes whether risk is reduced fairly. A risk-reduction program can protect wealthy property while neglecting renters, informal workers, disabled people, rural communities, Indigenous peoples, migrants, or neighborhoods facing historical disinvestment. DRR therefore requires transparency, accountability, participation, and public contestability.
Institutional capacities for DRR
Coordination
Agencies, utilities, community organizations, responders, and planners must act together across sectors and scales.
Accountability
Risk owners, funding obligations, decision triggers, and recovery responsibilities must be visible.
Learning
After-action reviews, near-miss analysis, monitoring, and community feedback must change future practice.
Legitimacy
People are more likely to act on warnings and plans when institutions are trusted and responsive.
Public finance
Prevention, maintenance, preparedness, and recovery require stable investment before disaster occurs.
Legal authority
Land-use control, safety standards, evacuation authority, and recovery rules must be enforceable and just.
Governance is not a background condition for DRR. It is one of the central mechanisms through which disaster risk is either reduced or reproduced.
Equity, Vulnerability, and Power
Disaster vulnerability is not evenly distributed. Poverty, racism, colonial dispossession, disability, age, gender, health status, housing insecurity, immigration status, language access, labor conditions, incarceration, rural isolation, and political exclusion can all shape exposure, preparedness, response, recovery, and long-term harm. DRR that does not address these conditions may reduce aggregate losses while leaving the most exposed people in danger.
Equity is not only about identifying vulnerable groups. It is about changing the conditions that produce vulnerability. That includes safer housing, accessible warnings, affordable insurance, public health capacity, income support, worker protection, transportation access, disability-inclusive evacuation, culturally competent communication, tenant protections, and recovery funds that reach people without wealth, property, or political influence.
Power also matters. Some risks are created because powerful actors benefit from risky development, weak regulation, privatized gains, public recovery subsidies, or environmental degradation. DRR must therefore ask who profits from exposure, who carries loss, who receives protection, and who has authority in planning decisions.
| Equity dimension | DRR question | Example practice |
|---|---|---|
| Exposure | Who lives, works, or depends on services in hazard-prone areas? | Disaggregated hazard mapping, worker exposure analysis, tenant vulnerability review. |
| Access | Who can receive warnings, evacuate, shelter, obtain care, and return safely? | Accessible alerts, transport support, multilingual communication, disability-inclusive shelters. |
| Recovery | Who receives repair, aid, housing, insurance, and livelihood support? | Equitable recovery funding, renter protection, anti-displacement safeguards. |
| Participation | Who defines risk priorities and acceptable trade-offs? | Community-led planning, Indigenous governance, worker participation, public oversight. |
| Accountability | Who is responsible for reducing risk created by past decisions? | Public reporting, regulatory enforcement, investment in historically disinvested places. |
A DRR strategy that ignores power may manage symptoms while preserving the structures that keep producing disaster.
Economic Dimensions of Disaster Risk Reduction
Economic systems shape disaster risk in several ways. Income determines whether households can prepare, evacuate, insure, rebuild, relocate, or absorb lost wages. Public finance determines whether infrastructure is maintained, prevention is funded, and recovery is equitable. Labor markets shape who works outdoors during heat, who can leave during emergencies, and who loses income after disruption. Supply chains determine whether food, medicine, fuel, and equipment remain available. Insurance markets influence where people rebuild and whether risk is priced, hidden, or abandoned.
Investment in DRR is often far more cost-effective than repeated emergency response and reconstruction. But prevention can be politically difficult because its success is often invisible. A bridge that does not fail, a flood that does not become disaster, a heatwave that does not produce mass mortality, or a community that does not collapse after disruption may not receive the same attention as visible rescue. This creates a bias toward response over prevention.
Economic resilience in DRR includes diversified livelihoods, household reserves, public insurance or social protection, resilient supply chains, fiscal capacity, local business continuity, and recovery programs that do not deepen debt or displacement.
| Economic factor | How it shapes disaster risk | DRR implication |
|---|---|---|
| Household income | Determines ability to prepare, evacuate, insure, repair, and recover | Include cash support, energy affordability, food access, and housing protection. |
| Public finance | Funds prevention, maintenance, emergency response, and recovery | Invest before disaster rather than paying only after loss. |
| Insurance | Can support recovery but may also enable risky rebuilding or withdraw from high-risk places | Align risk finance with prevention, affordability, and managed transition. |
| Labor systems | Shape exposure, income loss, worker safety, and recovery capacity | Protect workers, ensure paid leave, and plan for workforce continuity. |
| Supply chains | Determine availability of food, medicine, fuel, water, and repair materials | Build redundancy, local stockpiles, and logistics resilience. |
DRR is not a cost outside development. It is part of the economic infrastructure of long-term security.
Measuring Disaster Risk Reduction and Resilience
Measuring DRR and resilience is difficult because disaster risk is multidimensional, dynamic, and system-specific. Losses after disaster are important, but they are not enough. A serious measurement system must also track exposure, vulnerability, preparedness, institutional capacity, infrastructure condition, ecosystem function, early warning, social protection, recovery time, adaptive learning, and whether risk is being reduced or merely shifted.
Indicators can help make risk visible, but they can also mislead. A dashboard may show high preparedness while evacuation is inaccessible. A community may appear resilient because it recovers repeatedly, while the recovery depends on unpaid labor, debt, informal care, or displacement. A city may reduce aggregate loss while some neighborhoods remain repeatedly flooded. A system may score well because easy-to-measure indicators are improving, while slow variables such as maintenance backlog, trust, ecological buffering, or household precarity are worsening.
| Measurement domain | Example indicator | Risk if measured poorly |
|---|---|---|
| Hazard exposure | Population, infrastructure, or ecosystem function in hazard zones | Coarse maps hide local risk and informal settlements. |
| Vulnerability | Housing quality, health burden, poverty, disability access, ecosystem degradation | Aggregate indicators hide unequal exposure and recovery barriers. |
| Preparedness | Warning coverage, evacuation access, shelter capacity, training, emergency supplies | Plans are counted even when they cannot be acted on. |
| Infrastructure resilience | Service continuity, redundancy, repair time, maintenance backlog | Critical dependencies and cascading failure remain invisible. |
| Recovery | Time to restore housing, water, power, healthcare, schools, livelihoods | Fast recovery for some hides long recovery for others. |
| Learning | Implementation of after-action recommendations and risk-reduction investments | Lessons are documented but not funded or institutionalized. |
Responsible measurement should show uncertainty, missing data, distributional differences, and decision triggers. The goal is not to create a polished score. The goal is to support earlier, fairer, and more accountable action.
From Response to Prevention
One of the most important shifts in DRR is the move from reactive response to proactive prevention. Emergency response remains essential, but it is not enough. A society that repeatedly mobilizes heroic response while failing to reduce exposure and vulnerability is not managing disaster risk well. It is normalizing preventable loss.
Prevention changes the time horizon of disaster governance. It integrates risk reduction into land use, housing, infrastructure, environmental management, public health, labor policy, education, finance, social protection, climate adaptation, and development planning. It recognizes that disaster risk is built into systems before an event occurs. This is why the most effective DRR work may look like ordinary public policy: safe housing, maintained drainage, accessible transit, healthy ecosystems, public health capacity, fair labor standards, trusted institutions, and well-funded local government.
Prevention also changes recovery. Reconstruction should not aim to restore the old risk landscape. It should reduce future risk. This is often described as building back better, but the phrase only matters if it means real changes: safer siting, stronger standards, equitable recovery, ecological repair, community participation, and avoidance of displacement.
What prevention looks like in practice
Safer land use
Limit development in high-risk zones and create pathways for just relocation where necessary.
Maintained infrastructure
Fund repair, upgrade design standards, and reduce hidden fragility before failure occurs.
Social protection
Reduce vulnerability through housing, health, income, labor, energy, and recovery support.
Ecological restoration
Use wetlands, forests, soils, floodplains, dunes, and watersheds as living risk-reduction systems.
Prevention is not the absence of disaster response. It is the public commitment to make disaster less likely, less unequal, and less destructive before the next hazard arrives.
A Practical Framework for DRR and Resilience Planning
A practical DRR and resilience planning process should move from system definition to risk pathways, intervention design, accountability, and learning. It should not begin with generic hazards or end with generic recommendations. The framework must identify who and what is exposed, why vulnerability exists, how systems depend on one another, what capacities are present, what thresholds matter, who is responsible, and how decisions will change when indicators worsen.
| Step | Question | Output |
|---|---|---|
| Define the system | What place, community, infrastructure, ecosystem, or institution is being assessed? | System boundary, essential functions, stakeholders, dependencies. |
| Identify hazards | What shocks, stresses, and slow-onset changes matter? | Hazard profile, climate scenarios, historical events, emerging risks. |
| Map exposure | Who and what is in harm’s way? | Exposure maps, asset inventories, population profiles, critical-service maps. |
| Assess vulnerability | Why would exposure become severe harm? | Housing, health, poverty, ecosystem, infrastructure, governance, and access indicators. |
| Map dependencies | How could disruption cascade? | Infrastructure, supply-chain, ecological, institutional, and social dependency maps. |
| Evaluate capacity | What can reduce harm before, during, and after disruption? | Preparedness, response, recovery, adaptive capacity, local knowledge, public finance. |
| Design interventions | What reduces risk without shifting harm? | Prevention, mitigation, preparedness, ecosystem restoration, social protection, governance reform. |
| Set decision triggers | When must action escalate? | Thresholds, warning levels, accountability rules, funding triggers. |
| Monitor and learn | How will the system revise assumptions? | Indicators, dashboards, after-action learning, public reporting, participatory review. |
This framework treats DRR as a living risk-governance process rather than a one-time planning document.
Mathematical Lens: Modeling Hazard, Exposure, Vulnerability, and Capacity
Disaster risk is not reducible to a single number, but formal models can clarify the structure of the problem. A simple abstraction represents disaster risk \(D_i\) for system \(i\) as a function of hazard intensity, exposure, vulnerability, and coping or response capacity:
D_i = \frac{H_i \cdot E_i \cdot V_i}{C_i}
\]
Interpretation: \(H_i\) represents hazard intensity, \(E_i\) exposure, \(V_i\) vulnerability, and \(C_i\) coping or response capacity. Risk rises when hazards intersect with exposed and vulnerable systems and falls when capacity is stronger.
The expression is intentionally simplified. In real systems, hazard, exposure, vulnerability, and capacity interact through feedback loops, institutional decisions, infrastructure dependencies, ecological conditions, and social inequality. But the model captures a central DRR insight: disaster risk can be reduced by decreasing exposure and vulnerability or increasing capacity, even when the hazard itself cannot be eliminated.
Dynamic resilience can also be represented over time. Let system functionality at time \(t\) be \(F_t\), shock intensity be \(S_t\), adaptive response be \(A_t\), and recovery support be \(R_t\):
F_{t+1} = F_t – \alpha S_t + \beta A_t + \gamma R_t
\]
Interpretation: Post-disaster function depends not only on the size of the shock, but on adaptive response and recovery support. A severe hazard may produce less disaster when capacity is strong and recovery is equitable.
A portfolio framing is useful because DRR rarely depends on one intervention. If each pathway \(j\) has probability \(p_j\) of producing a risk-reduction benefit \(B_j\), expected resilience benefit can be represented as:
E(P) = \sum_{j=1}^{n} p_j B_j
\]
Interpretation: DRR benefits emerge from a portfolio of interventions: hazard mitigation, exposure reduction, vulnerability reduction, preparedness, institutional capacity, ecosystem restoration, and adaptive recovery.
A justice-adjusted DRR value can include a penalty for unequal exposure, unequal recovery, or displacement risk:
D_i^{*} = D_i + \lambda J_i
\]
Interpretation: \(J_i\) represents justice-related risk, such as unequal exposure, inaccessible evacuation, delayed recovery, or exclusion from planning. The penalty prevents aggregate risk estimates from hiding concentrated harm.
These models do not replace field knowledge, engineering judgment, ecological monitoring, community participation, or institutional accountability. They help make assumptions explicit so that risk-reduction choices can be tested, debated, and improved.
Advanced R Workflow: Comparing Disaster Risk Reduction Strategies
The R workflow below compares several DRR strategies across hazard reduction, exposure reduction, vulnerability reduction, capacity enhancement, justice protection, and maladaptation risk. It then shows how rankings change under different strategic priorities.
# Install packages if needed.
# install.packages(c("tidyverse", "scales"))

library(tidyverse)
library(scales)

# -------------------------------------------------------------------
# Example disaster risk reduction strategies.
# Values are synthetic and for methodological demonstration only.
# Higher maladaptation_risk is worse.
# -------------------------------------------------------------------

strategies <- tibble(
  strategy = c(
    "Floodplain Land-Use Restriction",
    "Community Early Warning Network",
    "Critical Infrastructure Hardening",
    "Ecosystem-Based Flood and Fire Risk Reduction",
    "Integrated Preparedness and Response Training",
    "Equitable Recovery and Housing Protection Program"
  ),
  hazard_reduction = c(7.4, 6.8, 7.2, 8.1, 6.5, 6.7),
  exposure_reduction = c(8.6, 7.1, 7.3, 8.0, 6.8, 7.4),
  vulnerability_reduction = c(7.5, 8.1, 7.8, 8.0, 8.4, 8.9),
  capacity_enhancement = c(6.9, 8.7, 7.6, 7.8, 8.8, 8.3),
  justice_protection = c(7.2, 8.0, 7.1, 7.8, 8.1, 9.0),
  maladaptation_risk = c(3.4, 2.6, 3.8, 2.7, 2.8, 2.4)
)

# -------------------------------------------------------------------
# Weighted DRR value function.
# -------------------------------------------------------------------

score_strategies <- function(data, wh, we, wv, wc, wj, wm) {
  data %>%
    mutate(
      drr_value =
        wh * hazard_reduction +
        we * exposure_reduction +
        wv * vulnerability_reduction +
        wc * capacity_enhancement +
        wj * justice_protection -
        wm * maladaptation_risk
    ) %>%
    arrange(desc(drr_value))
}

# -------------------------------------------------------------------
# Scenario weights for different priorities.
# -------------------------------------------------------------------

scenarios <- tribble(
  ~scenario,                ~wh,  ~we,  ~wv,  ~wc,  ~wj,  ~wm,
  "Balanced",               0.17, 0.18, 0.18, 0.17, 0.18, 0.12,
  "Exposure-first",         0.12, 0.42, 0.14, 0.12, 0.12, 0.08,
  "Vulnerability-first",    0.12, 0.14, 0.42, 0.12, 0.12, 0.08,
  "Capacity-first",         0.12, 0.14, 0.14, 0.42, 0.10, 0.08,
  "Hazard-first",           0.42, 0.16, 0.14, 0.10, 0.10, 0.08,
  "Justice-first",          0.10, 0.14, 0.16, 0.12, 0.42, 0.06,
  "Maladaptation-sensitive",0.13, 0.15, 0.15, 0.13, 0.14, 0.30
)

# -------------------------------------------------------------------
# Evaluate strategies across scenarios.
# -------------------------------------------------------------------

scenario_results <- scenarios %>%
  rowwise() %>%
  do(
    score_strategies(
      strategies,
      wh = .$wh,
      we = .$we,
      wv = .$wv,
      wc = .$wc,
      wj = .$wj,
      wm = .$wm
    ) %>%
      mutate(scenario = .$scenario)
  ) %>%
  ungroup()

ranked_results <- scenario_results %>%
  group_by(scenario) %>%
  arrange(desc(drr_value), .by_group = TRUE) %>%
  mutate(rank = row_number()) %>%
  ungroup()

print(ranked_results)

# -------------------------------------------------------------------
# Visualize ranking shifts across priorities.
# -------------------------------------------------------------------

ggplot(ranked_results, aes(x = strategy, y = drr_value, group = scenario)) +
  geom_point(size = 3) +
  geom_line(aes(color = scenario), linewidth = 1) +
  coord_flip() +
  labs(
    title = "Disaster Risk Reduction Strategy Value Across Priority Scenarios",
    x = "Strategy",
    y = "Weighted DRR Value",
    color = "Scenario"
  ) +
  theme_minimal(base_size = 12)

# -------------------------------------------------------------------
# Summarize which strategies rank first most often.
# -------------------------------------------------------------------

top_rank_summary <- ranked_results %>%
  filter(rank == 1) %>%
  count(strategy, name = "times_ranked_first") %>%
  arrange(desc(times_ranked_first))

print(top_rank_summary)

# -------------------------------------------------------------------
# Export results for review.
# -------------------------------------------------------------------

write_csv(ranked_results, "disaster_risk_reduction_strategy_rankings.csv")
write_csv(top_rank_summary, "disaster_risk_reduction_top_rank_summary.csv")
This workflow shows why DRR strategy rankings depend on values and assumptions. A hazard-first strategy, an exposure-first strategy, and a justice-first strategy may rank differently. A responsible DRR process should make those trade-offs explicit rather than hiding them inside a single score.
Advanced Python Workflow: Uncertainty Analysis for DRR and Resilience Choices
The Python workflow below extends the same logic with Monte Carlo simulation. Instead of assuming fixed values, it models uncertainty across hazard reduction, exposure reduction, vulnerability reduction, capacity enhancement, justice protection, and maladaptation risk.
# Install packages if needed:
# pip install pandas numpy matplotlib

import numpy as np
import pandas as pd
import matplotlib.pyplot as plt

# ---------------------------------------------------------------------
# Example disaster risk reduction strategies.
# Values are synthetic and for methodological demonstration only.
# Higher maladaptation_risk is worse.
# ---------------------------------------------------------------------

strategies = pd.DataFrame({
    "strategy": [
        "Floodplain Land-Use Restriction",
        "Community Early Warning Network",
        "Critical Infrastructure Hardening",
        "Ecosystem-Based Flood and Fire Risk Reduction",
        "Integrated Preparedness and Response Training",
        "Equitable Recovery and Housing Protection Program"
    ],
    "hazard_reduction": [7.4, 6.8, 7.2, 8.1, 6.5, 6.7],
    "exposure_reduction": [8.6, 7.1, 7.3, 8.0, 6.8, 7.4],
    "vulnerability_reduction": [7.5, 8.1, 7.8, 8.0, 8.4, 8.9],
    "capacity_enhancement": [6.9, 8.7, 7.6, 7.8, 8.8, 8.3],
    "justice_protection": [7.2, 8.0, 7.1, 7.8, 8.1, 9.0],
    "maladaptation_risk": [3.4, 2.6, 3.8, 2.7, 2.8, 2.4]
})

# ---------------------------------------------------------------------
# Baseline weights.
# ---------------------------------------------------------------------

weights = {
    "hazard_reduction": 0.17,
    "exposure_reduction": 0.18,
    "vulnerability_reduction": 0.18,
    "capacity_enhancement": 0.17,
    "justice_protection": 0.18,
    "maladaptation_risk": 0.12
}

# ---------------------------------------------------------------------
# Weighted DRR value function.
# ---------------------------------------------------------------------

def compute_drr_value(df, weights_dict):
    result = df.copy()
    result["drr_value"] = (
        weights_dict["hazard_reduction"] * result["hazard_reduction"]
        + weights_dict["exposure_reduction"] * result["exposure_reduction"]
        + weights_dict["vulnerability_reduction"] * result["vulnerability_reduction"]
        + weights_dict["capacity_enhancement"] * result["capacity_enhancement"]
        + weights_dict["justice_protection"] * result["justice_protection"]
        - weights_dict["maladaptation_risk"] * result["maladaptation_risk"]
    )

    result["diagnostic"] = np.select(
        [
            result["maladaptation_risk"] >= 3.6,
            result["justice_protection"] < 7.5,
            result["capacity_enhancement"] < 7.2
        ],
        [
            "maladaptation review needed",
            "justice protection needs strengthening",
            "capacity constraint"
        ],
        default="promising but requires scenario validation"
    )

    return result.sort_values("drr_value", ascending=False)

baseline_results = compute_drr_value(strategies, weights)

print("Baseline DRR ranking:")
print(baseline_results[["strategy", "drr_value", "diagnostic"]])

# ---------------------------------------------------------------------
# Monte Carlo simulation.
# Allow values to vary around current estimates.
# ---------------------------------------------------------------------

np.random.seed(42)
n_simulations = 5000
simulation_rows = []

for simulation_id in range(n_simulations):
    simulated = strategies.copy()

    for col in [
        "hazard_reduction",
        "exposure_reduction",
        "vulnerability_reduction",
        "capacity_enhancement",
        "justice_protection",
        "maladaptation_risk"
    ]:
        simulated[col] = np.random.normal(
            loc=strategies[col],
            scale=0.6
        )
        simulated[col] = simulated[col].clip(1, 10)

    simulated_results = compute_drr_value(simulated, weights)

    for rank, (_, row) in enumerate(simulated_results.iterrows(), start=1):
        simulation_rows.append({
            "simulation_id": simulation_id,
            "strategy": row["strategy"],
            "rank": rank,
            "drr_value": row["drr_value"],
            "diagnostic": row["diagnostic"],
            "winner": simulated_results.iloc[0]["strategy"]
        })

simulation = pd.DataFrame(simulation_rows)

# ---------------------------------------------------------------------
# Estimate robustness under uncertainty.
# ---------------------------------------------------------------------

summary = (
    simulation
    .groupby("strategy")
    .agg(
        mean_drr_value=("drr_value", "mean"),
        median_drr_value=("drr_value", "median"),
        probability_ranked_first=("rank", lambda x: (x == 1).mean() * 100),
        probability_top_two=("rank", lambda x: (x <= 2).mean() * 100),
        probability_bottom_two=("rank", lambda x: (x >= 5).mean() * 100),
        maladaptation_review_rate=("diagnostic", lambda x: (x == "maladaptation review needed").mean() * 100)
    )
    .reset_index()
    .sort_values("probability_ranked_first", ascending=False)
)

print("\nStrategy robustness under uncertainty:")
print(summary)

# ---------------------------------------------------------------------
# Plot robustness under uncertainty.
# ---------------------------------------------------------------------

plt.figure(figsize=(10, 6))
plt.bar(summary["strategy"], summary["probability_ranked_first"])
plt.xticks(rotation=20, ha="right")
plt.ylabel("Probability of Ranking First (%)")
plt.title("Robustness of DRR and Resilience Choices Under Uncertainty")
plt.tight_layout()
plt.show()

# ---------------------------------------------------------------------
# Plot maladaptation review rate.
# ---------------------------------------------------------------------

plt.figure(figsize=(10, 6))
plt.bar(summary["strategy"], summary["maladaptation_review_rate"])
plt.xticks(rotation=20, ha="right")
plt.ylabel("Maladaptation Review Rate (%)")
plt.title("How Often DRR Strategies Trigger Maladaptation Review")
plt.tight_layout()
plt.show()

# ---------------------------------------------------------------------
# Export summary for reporting.
# ---------------------------------------------------------------------

baseline_results.to_csv("drr_resilience_baseline_results.csv", index=False)
simulation.to_csv("drr_resilience_uncertainty_simulation.csv", index=False)
summary.to_csv("drr_resilience_uncertainty_summary.csv", index=False)
This workflow shows why DRR and resilience choices should be evaluated under uncertainty. A strategy that appears strongest under fixed assumptions may not remain robust when estimates vary. A strategy may also score well while still triggering maladaptation review, justice review, or capacity concern.
GitHub Repository
The companion GitHub repository for this article is designed as an advanced Disaster Risk Reduction and resilience modeling scaffold. It translates hazard reduction, exposure reduction, vulnerability reduction, capacity enhancement, justice protection, maladaptation risk, and uncertainty into reproducible workflows for risk-governance analysis.
Complete Code Repository
Companion code for Disaster Risk Reduction and resilience modeling, including strategy comparison, hazard-exposure-vulnerability-capacity scoring, justice-adjusted DRR value, maladaptation-risk review, Monte Carlo uncertainty analysis, responsible-use notes, and multi-language computational examples.
The companion article directory is articles/disaster-risk-reduction-and-resilience/. It is structured to support a professional modeling workflow: Python for uncertainty analysis and scenario simulation; R for DRR strategy comparison and ranking sensitivity; SQL for hazards, exposure, vulnerability, capacity, strategies, scenarios, model runs, and outputs; Julia for dynamic risk-reduction examples; and Rust, Go, C, C++, and Fortran for lightweight diagnostic and simulation utilities.
The modeling objective is to explore how hazard reduction, exposure reduction, vulnerability reduction, capacity enhancement, justice protection, and maladaptation risk shape DRR and resilience choices under uncertainty. The scaffold includes synthetic data, validation notes, responsible-use documentation, generated outputs, and notebook placeholders.
This repository extends the article from conceptual DRR into applied risk-governance modeling. It gives readers a reproducible foundation for examining when disaster risk reduction strengthens resilience, when it risks shifting harm, and how strategy choices change under different priorities and uncertainty assumptions.
Conclusion
Disaster Risk Reduction and resilience belong together because effective risk governance must both reduce the conditions that make hazards catastrophic and strengthen the capacity of systems to function under the risks that remain. DRR without resilience can become too narrowly preventive or technocratic. Resilience without DRR can become too accepting of repeated harm. Their integration provides a more serious framework for preventing disaster, protecting essential functions, supporting recovery, and learning over time.
Seen clearly, disasters are not simply external shocks. They are outcomes of hazard interacting with exposure, vulnerability, infrastructure, ecosystems, institutions, economic conditions, and social capacity. This is why DRR matters strategically: it moves the focus from emergency response alone to the deeper systems that shape whether disruption becomes disaster. Resilience extends that perspective by emphasizing continuity, recovery, adaptation, learning, and transformation.
The field is weakened when DRR is reduced to emergency management or when resilience is treated as a vague slogan of recovery. It is strongest when both are integrated into a systems framework that addresses prevention, preparedness, infrastructure, ecosystems, institutions, equity, public finance, and long-term adaptation together.
In the broader Resilience Thinking series, Disaster Risk Reduction and resilience connect climate resilience, infrastructure resilience, community resilience, adaptive governance, resilience indicators, cascading failure, social vulnerability, and just transformation. The central lesson is simple but demanding: disasters are not only events to respond to. They are risks to govern before the event arrives.
Related Articles
- Climate Resilience
- Community Resilience
- Infrastructure Resilience
- Economic Resilience
- Resilience Indicators and Dashboard Risk
- Resilience Metrics and Measurement
- Modularity and Cascading Failure
Further Reading
- Kelman, I. (2020) Disaster by Choice: How Our Actions Turn Natural Hazards into Catastrophes. Oxford: Oxford University Press. Available at: https://global.oup.com/academic/product/disaster-by-choice-9780198841357.
- United Nations Office for Disaster Risk Reduction (UNDRR) (2015) Sendai Framework for Disaster Risk Reduction 2015–2030. Geneva: UNDRR. Available at: https://www.undrr.org/publication/sendai-framework-disaster-risk-reduction-2015-2030.
- United Nations Office for Disaster Risk Reduction (UNDRR) (2022) Global Assessment Report on Disaster Risk Reduction 2022: Our World at Risk. Geneva: UNDRR. Available at: https://www.undrr.org/gar2022-our-world-risk.
- Intergovernmental Panel on Climate Change (IPCC) (2022) Climate Change 2022: Impacts, Adaptation and Vulnerability. Cambridge: Cambridge University Press. Available at: https://www.ipcc.ch/report/ar6/wg2/.
- Wisner, B., Blaikie, P., Cannon, T. and Davis, I. (2004) At Risk: Natural Hazards, People’s Vulnerability and Disasters. 2nd edn. London: Routledge. Available at: https://www.routledge.com/At-Risk-Natural-Hazards-Peoples-Vulnerability-and-Disasters/Wisner-Blaikie-Cannon-Davis/p/book/9780415252164.
- World Bank (no date) Disaster Risk Management. Available at: https://www.worldbank.org/en/topic/disasterriskmanagement.
References
- Adger, W.N. (2006) ‘Vulnerability’, Global Environmental Change, 16(3), pp. 268–281. Available at: https://doi.org/10.1016/j.gloenvcha.2006.02.006.
- Alexander, D.E. (2002) Principles of Emergency Planning and Management. Harpenden: Terra Publishing. Available at: https://global.oup.com/academic/product/principles-of-emergency-planning-and-management-9780195218381.
- Intergovernmental Panel on Climate Change (IPCC) (2022) Climate Change 2022: Impacts, Adaptation and Vulnerability. Cambridge: Cambridge University Press. Available at: https://www.ipcc.ch/report/ar6/wg2/.
- Kelman, I. (2020) Disaster by Choice: How Our Actions Turn Natural Hazards into Catastrophes. Oxford: Oxford University Press. Available at: https://global.oup.com/academic/product/disaster-by-choice-9780198841357.
- Manyena, S.B. (2006) ‘The concept of resilience revisited’, Disasters, 30(4), pp. 434–450. Available at: https://doi.org/10.1111/j.0361-3666.2006.00331.x.
- Tierney, K. (2019) Disasters: A Sociological Approach. Cambridge: Polity Press. Available at: https://www.politybooks.com/bookdetail?book_slug=disasters-a-sociological-approach–9780745671017.
- United Nations Office for Disaster Risk Reduction (UNDRR) (2015) Sendai Framework for Disaster Risk Reduction 2015–2030. Geneva: UNDRR. Available at: https://www.undrr.org/publication/sendai-framework-disaster-risk-reduction-2015-2030.
- United Nations Office for Disaster Risk Reduction (UNDRR) (2022) Global Assessment Report on Disaster Risk Reduction 2022: Our World at Risk. Geneva: UNDRR. Available at: https://www.undrr.org/gar2022-our-world-risk.
- Wisner, B., Blaikie, P., Cannon, T. and Davis, I. (2004) At Risk: Natural Hazards, People’s Vulnerability and Disasters. 2nd edn. London: Routledge. Available at: https://www.routledge.com/At-Risk-Natural-Hazards-Peoples-Vulnerability-and-Disasters/Wisner-Blaikie-Cannon-Davis/p/book/9780415252164.
- World Bank (no date) Disaster Risk Management. Available at: https://www.worldbank.org/en/topic/disasterriskmanagement.