
Last Updated May 10, 2026
Model monitoring, drift, and AI observability describe the operational discipline required to keep artificial intelligence systems reliable after deployment. A model that performs well in offline evaluation can degrade in production when input data changes, user behavior shifts, sensors drift, labels become delayed, downstream systems change, prompts evolve, retrieval indexes become stale, or the social context around the system changes. Monitoring is therefore not a postscript to AI development. It is part of the system itself.
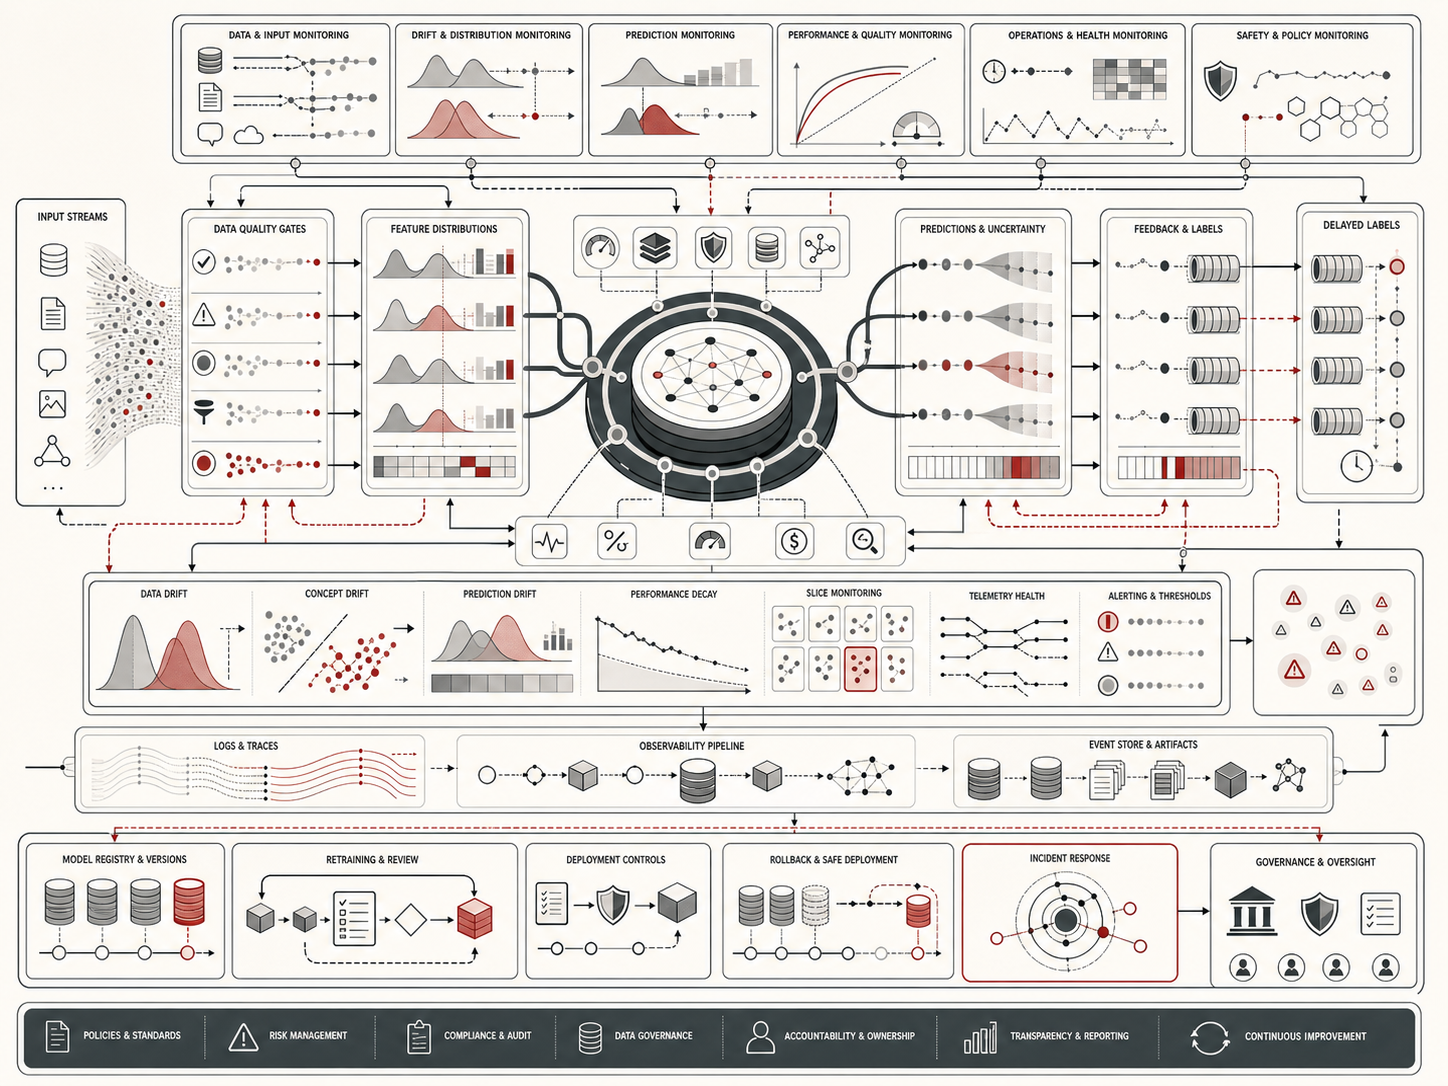
AI observability extends traditional machine-learning monitoring by connecting data quality, feature distributions, model outputs, performance metrics, latency, cost, feedback, fairness, safety, retrieval quality, tool behavior, user interactions, incidents, and governance records. It asks not only whether the model is running, but whether the system is still behaving as intended, under the conditions it actually faces, for the users and institutions that depend on it.
The central argument is that trustworthy AI requires operational visibility. Evaluation before deployment is necessary but insufficient. Production systems need telemetry, drift detection, model-performance monitoring, slice-level analysis, uncertainty tracking, human-feedback loops, incident response, retraining governance, rollback procedures, and audit trails. Without observability, an AI system can fail quietly, degrade gradually, or produce harm before anyone notices.
Main Library
Publications
Article Map
Artificial Intelligence Systems
Related Topic
Data Systems & Analytics
Related Topic
Risk & Resilience
Related Topic
Institutions & Governance
This article develops Model Monitoring, Drift, and AI Observability as an advanced article within the Artificial Intelligence Systems knowledge series. It explains production telemetry, data quality monitoring, feature drift, prediction drift, concept drift, label delay, performance decay, calibration monitoring, slice-level observability, fairness monitoring, LLM/RAG/agent observability, alerting, escalation, retraining governance, rollback readiness, incident response, and institutional accountability. Selected Python and R examples appear here, while the full GitHub repository contains expanded computational scaffolding for feature drift, prediction drift, delayed-label performance review, slice monitoring, observability risk scoring, SQL schemas, documentation templates, and reproducible notebooks.
Why Model Monitoring Matters
Model monitoring matters because deployment changes the evidence environment. During development, teams usually evaluate models against historical datasets, validation splits, test sets, benchmark tasks, or controlled simulations. Production is different. The model receives new inputs from changing users, changing systems, changing markets, changing environments, and changing institutional processes. A model that was valid yesterday may not remain valid tomorrow.
Monitoring is especially important because AI failures are often gradual rather than catastrophic. A data pipeline may slowly introduce missing values. A sensor may drift. A user population may change. A fraud pattern may adapt. A recommendation system may create feedback loops. A language model’s retrieval index may become stale. An agent may begin calling a tool in unexpected ways after a workflow change. These failures may not appear as server outages. They may appear as subtle degradation in decision quality.
AI observability is therefore not only a technical practice. It is a governance practice. A deployed model should be observable enough for engineers, domain experts, reviewers, and decision-makers to know when it is operating normally, when it is uncertain, when it is degrading, and when it should be paused, retrained, rolled back, or escalated.
Monitoring also changes the meaning of responsibility. If an institution deploys an AI system that cannot be observed, audited, or corrected, then the institution has delegated decision influence to a system it cannot adequately govern. In high-impact settings, invisible degradation is not merely an engineering problem. It is an accountability failure.
The purpose of observability is not to produce more dashboards for their own sake. It is to make production uncertainty visible. It should help answer: What changed? Who was affected? Did performance degrade? Are labels delayed? Which slices are failing? Is the retrieval system stale? Are tool calls safe? Is the model still calibrated? Should the system continue operating, be restricted, be retrained, be rolled back, or be escalated?
From Offline Evaluation to AI Observability
Offline evaluation asks whether a model performed well on a known dataset before deployment. Observability asks whether the deployed system is still performing acceptably under real operating conditions. The difference is temporal, operational, and institutional.
An offline evaluation report may include accuracy, precision, recall, calibration, fairness metrics, robustness tests, and benchmark comparisons. An observability system adds production signals:
- input data quality;
- feature distributions;
- prediction distributions;
- confidence and uncertainty patterns;
- model latency and throughput;
- cost and resource usage;
- label availability and label delay;
- ground-truth performance when labels arrive;
- slice-level behavior across user groups, regions, products, or contexts;
- feedback and override rates;
- error reports and incident records;
- version changes in data, model, prompts, retrieval, tools, or policy.
Observability also changes responsibility. If an institution deploys an AI system but cannot detect drift, explain incidents, reconstruct model behavior, or know when data changed, it cannot credibly govern that system. Production visibility is part of accountability.
| Layer | Offline Evaluation Question | Production Observability Question | Governance Relevance |
|---|---|---|---|
| Data | Was the validation dataset representative? | Are production inputs still valid, complete, fresh, and comparable? | Detects training-serving skew and pipeline failure. |
| Model | Did the model meet predeployment metrics? | Is performance stable after deployment? | Connects model quality to real conditions. |
| Output | Were predictions accurate on test data? | Are prediction distributions, confidence, and thresholds changing? | Identifies silent behavioral shifts before labels arrive. |
| Workflow | Was the model suitable for intended use? | Are users overriding, ignoring, misusing, or being harmed by outputs? | Links model behavior to actual decision processes. |
| System | Was deployment approved? | Are latency, cost, tools, retrieval, prompts, and incidents under control? | Monitors the broader AI system, not only the model. |
Note: Offline evaluation provides initial evidence. Observability keeps evidence alive after deployment.
Offline\ Evaluation \neq Production\ Reliability
\]
Interpretation: A model that performs well before deployment still needs observability because production data, users, workflows, labels, and system dependencies change over time.
AI observability therefore requires both technical instrumentation and institutional process. Technical systems must capture logs, metrics, traces, model versions, feature values, prediction outputs, prompts, retrieved sources, tool calls, review outcomes, and incidents. Institutions must decide who reviews these signals, which thresholds matter, what actions follow alerts, and how monitoring evidence is preserved for audit and accountability.
Types of Drift: Data, Concept, Label, Feature, and System Drift
Drift describes change over time. But different kinds of drift have different implications. Some drift affects input distributions. Some affects the relationship between inputs and outcomes. Some affects labels, workflows, knowledge bases, user behavior, or surrounding systems. Monitoring should identify the type of drift before deciding what action to take.
| Drift Type | What Changes? | Example | Why It Matters |
|---|---|---|---|
| Data drift | The distribution of input data changes. | New users have different feature patterns than training users. | The model may be operating outside its learned data regime. |
| Feature drift | Individual features change distribution, meaning, scale, or quality. | A sensor begins reporting values with a shifted baseline. | Predictions may change even if the real-world target has not changed. |
| Concept drift | The relationship between inputs and target changes. | Fraud patterns change, so old predictors no longer work. | Performance can decay even if input distribution looks stable. |
| Label drift | The distribution of outcomes changes. | A disease prevalence or default rate changes over time. | Base rates shift, affecting calibration and thresholds. |
| Prediction drift | The model’s output distribution changes. | A risk score begins producing many more high-risk outputs. | Operational impact may change before labels are available. |
| System drift | The surrounding software, workflow, data pipeline, or policy changes. | A new form field changes how inputs are collected. | The model may fail because the system around it changed. |
| Behavioral drift | Users adapt to or react to the model. | Users learn how to game a ranking or scoring system. | Feedback loops can alter the environment the model measures. |
| Knowledge drift | Relevant facts, documents, standards, or rules change. | A policy, law, product spec, or scientific guideline is updated. | RAG and LLM systems may answer from stale knowledge. |
Note: Not all drift is harmful. The governance question is whether change threatens performance, fairness, safety, reliability, compliance, or public trust.
Not all drift is harmful. Some drift reflects normal seasonality, growth, new use cases, or successful expansion into new populations. A model serving more people may see new patterns. A seasonal business may experience predictable changes. A public-health system may see changing base rates. The monitoring challenge is not simply to detect any change, but to determine whether the change threatens performance, fairness, safety, reliability, or compliance.
Different drift types require different responses. Data drift may require pipeline investigation or local validation. Concept drift may require retraining, model redesign, or new labels. Label drift may require threshold recalibration. System drift may require workflow review. Knowledge drift may require index refresh, source review, or updated retrieval policies. Treating all drift as the same can lead to poor decisions.
Drift\ Signal \neq Retraining\ Decision
\]
Interpretation: Drift detection should trigger investigation, not automatic retraining. The institution must determine whether the drift is harmful, temporary, expected, or caused by a system error.
Data Quality and Feature Monitoring
Data quality monitoring asks whether the system is receiving valid, complete, timely, and meaningful inputs. Many model failures begin before inference. A field may become null. A categorical value may change format. A feature may stop updating. A timestamp may shift time zone. A sensor may saturate. A data provider may change schema. A preprocessing pipeline may silently transform values differently than expected.
Important data-quality signals include:
- missing-value rate;
- schema validity;
- range violations;
- categorical novelty;
- feature freshness;
- duplicate rate;
- outlier frequency;
- training-serving skew;
- pipeline latency;
- source availability;
- feature importance changes;
- data lineage and transformation version.
Feature monitoring should not only look at global averages. A global distribution may appear stable while a critical subgroup or region has shifted. Monitoring should therefore include slice-level feature checks for important populations, products, geographies, time windows, devices, workflows, and risk categories.
Data quality is also a social and institutional issue. A missing feature may reflect a broken pipeline, but it may also reflect unequal data collection, under-documentation, language access barriers, device limitations, or organizational workflow changes. In high-impact systems, missingness itself may carry meaning. Monitoring should therefore ask why data are missing, for whom, and with what consequences.
Bad\ Inputs \rightarrow Unreliable\ Outputs
\]
Interpretation: Model monitoring begins with data quality because prediction reliability depends on the validity, freshness, completeness, and meaning of production inputs.
Feature monitoring should also preserve lineage. If a feature changes, reviewers should be able to trace whether the change came from a source system, transformation, schema change, business process, user behavior, sensor drift, or real-world shift. Without lineage, monitoring may detect a symptom but not identify the cause.
Prediction, Confidence, and Output Monitoring
Prediction monitoring looks at what the model is producing. In classification, this may include class distribution, confidence scores, calibration, threshold crossings, abstention rates, and decision rates. In regression, it may include predicted-value distribution, variance, residuals when labels arrive, and extreme-value frequency. In ranking or recommendation systems, it may include exposure distribution, click-through behavior, diversity, feedback loops, and intervention rates.
For generative AI, output monitoring may include refusal rate, unsupported-claim rate, toxicity or safety flags, factuality review, citation fidelity, retrieval-grounding quality, prompt-injection attempts, tool-call behavior, response length, latency, cost, and user feedback. Generative systems require observability beyond traditional prediction scores because their outputs are open-ended and context-dependent.
Confidence monitoring is also important, but confidence is not the same as correctness. A model can be confidently wrong. A language model can sound authoritative while unsupported. A classifier can produce calibrated scores in one data regime and miscalibrated scores after drift. Confidence should be monitored alongside performance, uncertainty, grounding, and human feedback.
| Signal | What It Measures | Possible Warning | Governance Response |
|---|---|---|---|
| Prediction distribution | How outputs are distributed across classes, scores, or values. | Sudden increase in high-risk or low-confidence outputs. | Review thresholds, inputs, drift, and downstream workflow impact. |
| Confidence distribution | How confident the system is over time. | Rising confidence without performance evidence. | Review calibration, uncertainty, and delayed labels. |
| Abstention rate | How often the system declines or routes to review. | Spike in abstentions or unexplained drop to zero. | Check uncertainty rules, input quality, and workflow capacity. |
| Threshold crossings | How often outputs trigger decisions or escalations. | Review queues overload or automation rate changes abruptly. | Evaluate operational burden and decision policy. |
| Generated-output quality | Grounding, factuality, safety, usefulness, citation support. | Unsupported claims or unsafe responses increase. | Restrict deployment, improve retrieval, or require review. |
| Tool-call behavior | Frequency, arguments, failures, permissions, confirmations. | Unexpected tool use or failure loops. | Apply permission review, sandboxing, and incident investigation. |
Note: Prediction monitoring is especially valuable before labels arrive because output distributions can reveal system change earlier than ground-truth performance metrics.
Prediction monitoring should be interpreted with workflow context. A spike in high-risk predictions may indicate real-world deterioration, model drift, data pipeline error, or threshold miscalibration. A drop in unsafe-output reports may reflect safer behavior, underreporting, monitoring failure, or users abandoning the system. Observability should support investigation, not replace judgment.
Performance Monitoring and Delayed Labels
Performance monitoring requires ground truth. In some systems, labels arrive quickly. A fraud model may learn whether a transaction was fraudulent after investigation. A recommendation system may observe clicks immediately. A medical or credit model may wait weeks or months for outcomes. In other systems, labels may be expensive, subjective, contested, or unavailable.
Delayed labels create a monitoring gap. During that gap, teams may rely on proxy signals: input drift, prediction drift, confidence shifts, human overrides, customer complaints, error reports, retrieval failures, operational anomalies, or incident reports. These proxies can help, but they are not substitutes for true performance measurement.
When labels arrive, performance should be monitored over time and across slices. A model may maintain overall accuracy while degrading for one subgroup, region, product line, language, device type, or risk class. Model monitoring should therefore include aggregate metrics and disaggregated metrics.
Performance monitoring should also account for feedback loops. If a model’s prediction changes the outcome, the observed label may no longer represent the same process as historical labels. A high-risk score may trigger intervention that prevents the adverse outcome, making the model appear wrong even if the intervention worked. A recommendation may shape user behavior, changing future data. Monitoring should therefore interpret outcomes in light of actions taken.
Delayed\ Labels \rightarrow Proxy\ Signals + Later\ Ground\ Truth
\]
Interpretation: When outcomes arrive late, institutions must use interim monitoring signals cautiously and update performance evidence when true labels become available.
Delayed labels also create governance responsibilities. Monitoring reports should state which metrics are based on mature labels, which are preliminary, which are proxy signals, and which remain unknown. A dashboard that hides label delay can create false confidence.
Slice-Level Monitoring, Fairness, and Local Failures
Slice-level monitoring asks whether the model behaves consistently across meaningful groups or contexts. These slices may reflect geography, product category, customer segment, language, device type, time period, demographic group, operational workflow, risk tier, or input source. The right slices depend on domain knowledge and governance priorities.
Slice monitoring is essential because AI systems can fail locally while appearing healthy globally. A model may work well in aggregate but fail for rural users, low-resource languages, new products, rare diseases, minority populations, edge cases, or newly introduced data sources. Local failures are often where harm concentrates.
Fairness monitoring should be treated as a living practice, not a one-time predeployment report. Distribution shift can alter fairness. Policy changes can alter impact. User behavior can adapt. Data coverage can change. Monitoring should track both performance differences and outcome differences where legally, ethically, and technically appropriate.
Global\ Stability \neq Local\ Reliability
\]
Interpretation: Aggregate monitoring can conceal failures in important subgroups, sources, workflows, regions, or edge cases.
Slice monitoring should also account for sample size. Rare slices may have sparse data, noisy metrics, and delayed labels. But sparse evidence should not be used as an excuse to ignore vulnerable populations. Instead, institutions may need confidence intervals, qualitative review, targeted sampling, expert review, or additional monitoring for small but high-impact groups.
Fairness monitoring is not only about model error. It also concerns who receives intervention, who is escalated, who is burdened by false positives, who is missed by false negatives, whose complaints are reviewed, whose data are missing, and whose outcomes improve after deployment. Observability should therefore examine system effects, not only model metrics.
LLM, RAG, and Agent Observability
Large language models, retrieval-augmented generation systems, and AI agents require expanded observability. Traditional monitoring asks whether a model predicted correctly. LLM observability asks whether the system followed instructions, used evidence correctly, avoided unsafe content, cited sources faithfully, respected privacy, and produced useful outputs. RAG observability asks whether retrieval found the right sources, whether citations supported claims, whether indexes were fresh, and whether access controls were enforced. Agent observability asks whether tools were selected correctly, arguments were valid, actions were authorized, state was updated safely, and human review was triggered when required.
| System Type | Key Observability Signals | Failure Mode | Governance Response |
|---|---|---|---|
| Predictive model | Feature drift, prediction drift, performance, calibration, latency. | Silent model decay or miscalibration. | Review drift, labels, thresholds, and retraining need. |
| LLM application | Prompt patterns, refusal rate, factuality, safety flags, user feedback. | Fluent unsupported or unsafe output. | Require grounding, review, safety testing, or deployment limits. |
| RAG system | Retrieval recall, source freshness, citation support, grounding, access filters. | Answer grounded in wrong or stale evidence. | Refresh index, review source authority, verify citation support. |
| AI agent | Tool-call logs, permission checks, state updates, action confirmations, rollback events. | Unauthorized or unsafe workflow execution. | Apply least privilege, approval gates, tool validation, and incident review. |
| Multimodal model | Modality quality, alignment, missing-modality behavior, conflict detection. | Confident fusion of weak or contradictory evidence. | Monitor modality reliability and require review under conflict. |
| Decision support system | Human overrides, escalation rate, threshold behavior, decision outcomes. | Automation bias or unreviewed high-impact decisions. | Track overrides, review thresholds, and audit decision pathways. |
Note: The shared principle is traceability. A monitored AI system should make it possible to reconstruct what input arrived, what model version ran, what context was used, what output was produced, what tools or retrieval sources were involved, what decision was made, and what happened afterward.
LLM observability must handle open-endedness. There may be no single label for whether an answer is correct, safe, useful, complete, grounded, or appropriate. Monitoring may therefore combine automated checks, human review, sampled audits, user feedback, source-grounding analysis, incident reports, and red-team tests.
RAG observability must distinguish retrieval from generation. A system may retrieve the wrong source and still produce a fluent answer. It may retrieve a relevant source but cite it for a claim the source does not support. It may retrieve stale documents after a policy update. It may retrieve documents the user should not have permission to access. Observability should track retrieval quality, source freshness, citation support, permission enforcement, and answer grounding separately.
Agent observability must track action. It is not enough to know what the model said. Observability must preserve the plan, tool calls, arguments, permissions, outputs, state changes, approvals, failures, retries, and rollback events. An agent without traceability is difficult to audit precisely when its actions matter most.
Observe = Input + Context + Model + Output + Action + Outcome
\]
Interpretation: AI observability requires visibility into the full system chain, not only the final model output.
Alerting, Thresholds, and Escalation
Monitoring without alerting is passive visibility. Alerting turns observability into operational response. But alerting must be designed carefully. If thresholds are too sensitive, teams receive noisy alerts and learn to ignore them. If thresholds are too weak, failures go undetected. Alert design should consider severity, confidence, persistence, affected population, business impact, safety impact, and reversibility.
Alerts may be organized into levels:
- informational: signal changed, but no action required;
- warning: monitor closely or investigate during normal review;
- action: assign owner, investigate, and document outcome;
- incident: pause, rollback, escalate, or invoke response procedure;
- governance review: trigger formal review for safety, fairness, compliance, or accountability.
Escalation paths should be defined before deployment. The system should identify who owns the model, who owns the data pipeline, who owns the business workflow, who reviews safety issues, who approves retraining, and who can pause or roll back the system.
Good alerting distinguishes signal from noise. A single unusual batch may require observation; persistent drift may require investigation; severe degradation may require rollback. A rare but high-impact failure may require immediate escalation even if aggregate metrics remain normal. Alerting should therefore combine statistical thresholds with domain severity.
Alert \rightarrow Owner \rightarrow Investigation \rightarrow Decision \rightarrow Record
\]
Interpretation: Alerting becomes governance only when each alert has an owner, investigation path, decision, and recorded outcome.
Escalation should also include “stop” authority. If a model is causing harm, exposing sensitive information, producing unsafe outputs, or acting outside its intended use, someone must be able to pause, restrict, or roll back the system. Observability without intervention authority is incomplete.
Retraining, Rollback, and Model Lifecycle Governance
Drift detection does not automatically mean retraining is required. Retraining can help when the environment changes, but it can also introduce regressions, fairness changes, new vulnerabilities, or loss of previously reliable behavior. A retraining trigger should therefore be part of model lifecycle governance, not an automatic reflex.
Retraining governance should answer:
- What signal triggered retraining consideration?
- Is the drift harmful, seasonal, temporary, or expected?
- Do labels confirm performance degradation?
- Which data will enter the new training set?
- Does the new model improve target metrics and slice metrics?
- Does it preserve calibration, fairness, safety, and robustness?
- Can the system roll back if the new model fails?
- Who approves promotion to production?
Rollback is as important as deployment. Every production model should have versioning, reproducible artifacts, deployment records, evaluation reports, monitoring links, and rollback procedures. The ability to restore a previous model, prompt, index, tool configuration, or policy layer is part of responsible operations.
Model lifecycle governance should also account for non-model components. In modern AI systems, reliability may depend on prompts, retrieval indexes, embedding models, ranking pipelines, feature stores, policy layers, tool schemas, API dependencies, safety classifiers, and user interfaces. Retraining a model may not solve a problem caused by a stale index or a broken feature pipeline. Rollback may need to restore more than model weights.
Retraining \neq Remediation
\]
Interpretation: Retraining is only one possible response to monitoring signals. The right remedy may be data repair, recalibration, threshold adjustment, prompt revision, index refresh, workflow redesign, rollback, or deployment restriction.
Lifecycle governance should preserve model lineage. Reviewers should know which model version produced which output, which data version trained it, which evaluation approved it, which monitoring signals applied, which incidents occurred, and which remediation steps followed. Without lineage, model operations become difficult to audit and harder to improve.
The AI Observability Stack
An AI observability stack connects production telemetry to governance decisions. It typically includes:
- instrumentation: logs, metrics, traces, model inputs, outputs, context, and metadata;
- data validation: schema checks, quality tests, freshness checks, and missingness alerts;
- drift detection: distribution comparisons for features, predictions, labels, embeddings, prompts, or retrieval results;
- performance monitoring: error metrics, calibration, ranking metrics, human review outcomes, and delayed labels;
- system monitoring: latency, cost, failures, retries, tool errors, throughput, and resource use;
- safety monitoring: unsafe outputs, policy violations, prompt injection, incident reports, and red-team signals;
- slice monitoring: subgroup, geography, language, workflow, or context-specific metrics;
- governance records: model versions, approvals, alerts, investigations, retraining decisions, and incidents.
The stack should support both engineering observability and institutional review. Engineers need diagnostics. Domain experts need interpretable patterns. Governance teams need traceability, accountability, and decision records. A mature observability system serves all three.
| Stack Layer | Purpose | Typical Records | Governance Value |
|---|---|---|---|
| Telemetry | Capture system behavior. | Inputs, outputs, latency, errors, traces, metadata. | Creates the evidence base for investigation. |
| Validation | Check incoming data and context. | Schema tests, missingness checks, freshness checks. | Detects pipeline and source problems early. |
| Drift analysis | Compare current conditions to reference conditions. | Feature drift, prediction drift, embedding drift, source drift. | Signals changed operating environments. |
| Performance review | Evaluate outcomes when labels arrive. | Error metrics, calibration, ranking metrics, slice performance. | Determines whether model behavior remains acceptable. |
| Safety and incident review | Track harmful, unsafe, or anomalous behavior. | Policy violations, complaints, incidents, red-team findings. | Links observability to risk management. |
| Governance workflow | Turn signals into decisions. | Alerts, owners, investigations, approvals, retraining records. | Converts monitoring into accountable action. |
Note: Observability should not stop at dashboards. The stack must connect signals to people, decisions, documentation, and system changes.
Observability design should also protect privacy. Production logs may contain sensitive inputs, outputs, prompts, documents, identifiers, tool calls, or user behavior. Logging everything without governance can create new risk. A responsible stack should include data minimization, role-based access, redaction, retention policies, encryption, audit logging, and clear rules for reviewing sensitive traces.
Governance, Auditability, and Institutional Accountability
Model monitoring becomes governance when signals are tied to responsibility, review, and action. A dashboard alone is not governance. Governance requires owners, thresholds, escalation paths, documentation, review cadence, incident response, and accountability for decisions.
A responsible monitoring program should document:
- model purpose and deployment context;
- approved use cases and prohibited use cases;
- reference datasets and production data sources;
- data-quality checks and drift metrics;
- performance metrics and label-delay assumptions;
- slice-level monitoring plan;
- safety and fairness monitoring plan;
- alert thresholds and owners;
- incident-response procedure;
- retraining and rollback policy;
- model version and artifact lineage;
- audit-log retention and governance review cadence.
Institutional accountability means that monitoring signals must influence decisions. If a model drifts, someone investigates. If performance decays, someone owns remediation. If a subgroup is harmed, the system is reviewed. If labels are missing, the limitation is documented. If incidents occur, the system learns from them. Observability should convert hidden failure into visible responsibility.
Auditability requires reconstructability. For a consequential output, reviewers should be able to identify the input, timestamp, model version, prompt version, retrieval corpus version, feature values, prediction or generated output, confidence or uncertainty signals, tool calls, human review decision, final action, and later outcome. This evidence chain is what makes post-deployment governance possible.
Observability + Ownership + Authority = Operational\ Accountability
\]
Interpretation: Monitoring becomes accountable only when signals are connected to named ownership and authority to investigate, restrict, retrain, roll back, or retire a system.
Governance also means refusing false certainty. A system may have limited labels, incomplete telemetry, privacy-constrained logs, or ambiguous outcomes. Those limits should be documented. An honest monitoring program says what is known, what is unknown, what is delayed, and what is being done to reduce uncertainty.
Common Failure Modes
AI observability often fails when monitoring is treated as a dashboard rather than an operating model. Metrics may exist, but no one owns them. Alerts may fire, but no one responds. Drift may be detected, but no investigation follows. Labels may be delayed, but dashboards present proxy metrics as if they were final performance. These are governance failures, not only technical failures.
| Failure Mode | Description | Likely Consequence | Governance Response |
|---|---|---|---|
| Dashboard without ownership | Metrics are visible, but no one is accountable for action. | Problems persist despite being detected. | Assign owners, escalation paths, and decision authority. |
| Proxy-metric overconfidence | Input drift or confidence is treated as performance evidence. | Teams misread the system while labels are delayed. | Separate proxy signals from ground-truth metrics. |
| Global-only monitoring | Aggregate metrics hide subgroup or local degradation. | Harm concentrates in slices while dashboards look healthy. | Require slice-level monitoring and targeted review. |
| Alert fatigue | Too many low-value alerts overwhelm teams. | Real incidents are ignored or delayed. | Tune thresholds, add severity levels, and require alert review. |
| Retraining reflex | Teams retrain automatically after drift signals. | New model introduces regressions or new risks. | Use governed retraining review and rollback readiness. |
| Unlogged context | Inputs, prompts, retrieval sources, or tool calls are not preserved. | Incidents cannot be reconstructed or explained. | Improve trace logging, lineage, and audit retention. |
| Privacy-insensitive logging | Monitoring stores sensitive content without controls. | Observability system becomes a privacy risk. | Use minimization, redaction, access control, and retention governance. |
Note: Monitoring failures usually arise when measurement is separated from ownership, interpretation, privacy protection, and operational authority.
These failure modes show why observability must be designed as a governance process. Metrics alone do not keep AI systems safe. The institution must know what the metrics mean, what uncertainty remains, who is responsible, what response is required, and how decisions are documented.
Limits and Open Problems
Model monitoring, drift detection, and AI observability have important limits. Drift is not always failure: a distribution shift may be harmless, expected, seasonal, or caused by growth into a new population. No drift does not guarantee safety: concept drift or policy failure can occur even when input distributions look stable. Labels may arrive late: performance degradation can remain hidden while teams rely on proxy signals. Global metrics can hide local harm: aggregate performance may appear stable while important slices degrade.
Thresholds can be brittle. Fixed alert thresholds may create noise or miss subtle failures. Observability can create privacy risk because logs may contain sensitive inputs, outputs, prompts, documents, or user behavior. Retraining can introduce new failures: fixing drift in one area can degrade safety, fairness, or robustness elsewhere. Dashboards do not create accountability: monitoring only matters when connected to ownership, escalation, and action.
Several open problems remain difficult. How should institutions monitor open-ended generative outputs without reducing quality to simplistic scores? How should observability systems evaluate long-horizon agent behavior? How should RAG systems monitor source freshness, citation support, and permission enforcement at scale? How should labels be interpreted when model-driven interventions change the outcome being measured? How should organizations monitor fairness when legally sensitive attributes are missing, incomplete, or hard to use responsibly?
Another open problem is governance capacity. Monitoring can generate more signals than institutions can interpret. A mature observability system must prioritize what matters: severe harms, vulnerable slices, persistent drift, high-impact decisions, safety incidents, and irreversible actions. Otherwise, observability becomes noise.
The goal is not to reduce AI reliability to a drift score. The goal is to build observable systems where data changes, performance changes, safety signals, incidents, and governance decisions can be seen, investigated, documented, and acted upon. AI observability turns production uncertainty into operational responsibility.
Mathematical Lens
Data drift can be framed as a change in input distribution over time.
P_{train}(X) \neq P_{prod,t}(X)
\]
Interpretation: The production input distribution at time \(t\) differs from the training distribution. This does not prove model failure, but it signals that the model may be operating under changed conditions.
Concept drift occurs when the relationship between inputs and outcomes changes.
P_{train}(Y \mid X) \neq P_{prod,t}(Y \mid X)
\]
Interpretation: The conditional relationship between features \(X\) and target \(Y\) changes. Concept drift is often more serious than input drift because the model’s learned mapping may become invalid.
A common distribution comparison uses population stability index.
\mathrm{PSI}
=
\sum_{i=1}^{B}
(p_i – q_i)
\log\left(\frac{p_i}{q_i}\right)
\]
Interpretation: \(p_i\) and \(q_i\) are proportions in bin \(i\) for reference and current distributions. PSI summarizes distribution shift across bins.
Another drift measure compares cumulative distributions.
D_{KS}
=
\sup_x
\left|
F_{ref}(x) – F_{cur}(x)
\right|
\]
Interpretation: The Kolmogorov-Smirnov statistic measures the maximum distance between reference and current cumulative distributions for a feature.
Production performance can be monitored over time when labels are available.
M_t
=
\frac{1}{n_t}
\sum_{i=1}^{n_t}
\ell\!\left(f_{\theta}(x_i),y_i\right)
\]
Interpretation: \(M_t\) is an average loss or error metric over labeled production examples at time \(t\). It can track model degradation after ground truth arrives.
Alerting can compare a monitored signal with a threshold.
A_t
=
\begin{cases}
1, & S_t > \tau \\
0, & S_t \leq \tau
\end{cases}
\]
Interpretation: Alert \(A_t\) fires when monitoring signal \(S_t\), such as drift score, error rate, latency, or unsupported-output rate, exceeds threshold \(\tau\).
System risk accumulates across performance, drift, safety, and operational signals.
R_{system,t}
=
w_1 D_t
+
w_2 E_t
+
w_3 U_t
+
w_4 O_t
+
w_5 I_t
\]
Interpretation: System risk at time \(t\) can combine drift \(D_t\), error \(E_t\), uncertainty \(U_t\), operational degradation \(O_t\), and incident severity \(I_t\), weighted by governance priorities.
A governance action rule can connect monitoring to intervention.
Action_t =
\begin{cases}
Continue, & R_{system,t} < \tau_1 \\
Investigate, & \tau_1 \leq R_{system,t} < \tau_2 \\
Restrict, & \tau_2 \leq R_{system,t} < \tau_3 \\
Rollback, & R_{system,t} \geq \tau_3
\end{cases}
\]
Interpretation: Monitoring becomes operational when risk levels map to explicit governance responses such as investigation, restriction, rollback, or continued monitoring.
Variables and System Interpretation
| Symbol or Term | Meaning | Monitoring Interpretation | System Relevance |
|---|---|---|---|
| \(X\) | Input features | Data observed by the model. | Monitored for data quality and distribution shift. |
| \(Y\) | Target or outcome | Ground-truth label or measured result. | Needed for performance monitoring. |
| \(P_{train}(X)\) | Training input distribution | Reference distribution from model development. | Baseline for drift comparison. |
| \(P_{prod,t}(X)\) | Production input distribution at time \(t\) | Current operating data. | Signals whether the model environment changed. |
| \(P(Y \mid X)\) | Conditional target relationship | Relationship the model tries to learn. | Changes indicate concept drift. |
| \(f_{\theta}\) | Model | Trained prediction or generation function. | Object being monitored and governed. |
| \(M_t\) | Performance metric | Error, loss, accuracy, F1, calibration, or other metric over time. | Tracks production model quality. |
| \(S_t\) | Monitoring signal | Drift, latency, error, uncertainty, feedback, or incident score. | Used for alerting and escalation. |
| \(\tau\) | Threshold | Warning or action boundary. | Determines when alerts fire. |
| \(R_{system,t}\) | System risk at time \(t\) | Composite operational risk score. | Supports governance decisions. |
Note: Monitoring metrics should be interpreted through deployment context, label delay, data quality, slice behavior, operational consequences, and governance authority.
Worked Example: Monitoring a Production Risk Model
Consider a production model that predicts operational risk for incoming cases. The model is trained on historical data and deployed into a workflow where high-risk cases receive review. After deployment, the organization monitors feature distributions, prediction scores, review outcomes, human overrides, latency, missing data, and eventual ground-truth outcomes.
A responsible monitoring design might include:
- Define reference data from the validated training and predeployment evaluation period.
- Monitor input features for missingness, range violations, categorical novelty, and drift.
- Monitor prediction scores for distribution shift and threshold-crossing changes.
- Track model confidence and uncertainty across risk categories.
- Track human overrides and reviewer disagreement.
- Monitor performance when delayed labels become available.
- Evaluate performance across relevant slices: geography, case type, source system, and user group.
- Alert when drift persists, performance falls below threshold, or override rates spike.
- Investigate before retraining to determine whether drift is harmful, temporary, or caused by pipeline error.
- Document investigation, remediation, retraining decision, rollback readiness, and governance review.
This example shows why monitoring is not only a technical dashboard. It is an operating model for keeping AI systems aligned with reality after deployment.
Suppose the model begins producing more high-risk scores after a new intake form is introduced. A dashboard may show prediction drift, but the cause could be real risk change, form redesign, feature encoding error, user behavior change, or model sensitivity to a newly missing field. A responsible investigation would review the data pipeline, compare slices, inspect missingness, evaluate delayed labels, consult domain experts, and avoid retraining until the cause is understood.
Signal \rightarrow Cause\ Analysis \rightarrow Governance\ Decision
\]
Interpretation: Monitoring signals should lead to investigation before action. The right response depends on the cause of the signal and the consequence of system behavior.
Computational Modeling
Computational modeling can make AI observability more concrete. A monitoring workflow can compare reference and production distributions, compute drift scores, track prediction changes, evaluate performance when labels arrive, score operational risk, and generate governance-ready summaries. A mature version can also support slice monitoring, alert history, incident records, retraining review, and rollback decisions.
The examples below are intentionally educational and dependency-light. They do not replace production monitoring tools, model registries, data contracts, or incident-management systems. Their purpose is to show how drift, performance, missingness, latency, incidents, and governance response can be organized together rather than treated as separate dashboards.
A real production observability system would connect these workflows to model logs, feature stores, data-quality checks, prediction stores, delayed-label pipelines, safety monitors, RAG traces, tool-call logs, incident registers, model cards, risk registers, and governance review records. The goal is not only to detect drift. The goal is to make operational AI behavior visible enough to govern.
Python Workflow: Drift, Performance, and Observability Review
The following Python workflow simulates production monitoring batches. It compares current data with a reference distribution, computes drift and performance signals, scores operational risk, and generates governance-ready summaries.
"""
Model Monitoring, Drift, and AI Observability

Python workflow:
- Simulate production monitoring batches.
- Compute feature drift, prediction drift, performance, latency, and incident signals.
- Score AI observability risk.
- Produce governance-ready summaries.

This example is dependency-light. Production monitoring should connect to real
model logs, data-quality checks, prediction stores, label pipelines, incident
records, and governance review systems.
"""

from __future__ import annotations

from pathlib import Path

import numpy as np
import pandas as pd


RANDOM_SEED = 42
rng = np.random.default_rng(RANDOM_SEED)

OUTPUT_DIR = Path("outputs")
OUTPUT_DIR.mkdir(exist_ok=True)


def population_stability_index(
    reference: np.ndarray,
    current: np.ndarray,
    bins: int = 10,
) -> float:
    """Compute a simple population stability index for one numeric feature."""
    quantiles = np.linspace(0, 1, bins + 1)
    edges = np.quantile(reference, quantiles)
    edges = np.unique(edges)

    if len(edges) < 3:
        return 0.0

    reference_counts, _ = np.histogram(reference, bins=edges)
    current_counts, _ = np.histogram(current, bins=edges)

    reference_prop = np.maximum(
        reference_counts / max(reference_counts.sum(), 1),
        1e-6,
    )

    current_prop = np.maximum(
        current_counts / max(current_counts.sum(), 1),
        1e-6,
    )

    return float(
        np.sum(
            (reference_prop - current_prop)
            * np.log(reference_prop / current_prop)
        )
    )


def simulate_reference_data(n: int = 5000) -> pd.DataFrame:
    """Create synthetic reference data."""
    feature_a = rng.normal(loc=0.0, scale=1.0, size=n)
    feature_b = rng.gamma(shape=2.0, scale=1.0, size=n)
    feature_c = rng.normal(loc=3.0, scale=0.8, size=n)

    logit = 0.7 * feature_a - 0.4 * feature_b + 0.5 * feature_c - 1.2
    probability = 1 / (1 + np.exp(-logit))
    label = rng.binomial(1, probability)

    return pd.DataFrame(
        {
            "feature_a": feature_a,
            "feature_b": feature_b,
            "feature_c": feature_c,
            "prediction_score": probability,
            "label": label,
        }
    )


def simulate_production_batches(
    reference: pd.DataFrame,
    batches: int = 24,
    batch_size: int = 600,
) -> pd.DataFrame:
    """Create synthetic production monitoring records for multiple batches."""
    rows = []

    for batch in range(1, batches + 1):
        drift_pressure = max(0, batch - 8) / batches

        feature_a = rng.normal(
            loc=0.0 + 0.9 * drift_pressure,
            scale=1.0,
            size=batch_size,
        )

        feature_b = rng.gamma(
            shape=2.0 + 1.2 * drift_pressure,
            scale=1.0,
            size=batch_size,
        )

        feature_c = rng.normal(
            loc=3.0 - 0.6 * drift_pressure,
            scale=0.8,
            size=batch_size,
        )

        logit = 0.7 * feature_a - 0.4 * feature_b + 0.5 * feature_c - 1.2
        probability = 1 / (1 + np.exp(-logit))

        # Simulate concept drift after batch 14 by changing label-generation dynamics.
        concept_shift = 0.45 if batch >= 14 else 0.0

        true_probability = 1 / (
            1
            + np.exp(
                -(
                    logit
                    - concept_shift * feature_a
                    + 0.35 * concept_shift
                )
            )
        )

        label = rng.binomial(1, true_probability)
        predicted_label = (probability >= 0.5).astype(int)

        accuracy = float((predicted_label == label).mean())
        positive_rate = float(predicted_label.mean())
        mean_prediction = float(probability.mean())
        latency_ms = float(rng.gamma(shape=2.5, scale=120.0) + 12 * batch)

        missing_rate = float(
            np.clip(
                rng.normal(
                    loc=0.01 + 0.02 * drift_pressure,
                    scale=0.01,
                ),
                0,
                0.2,
            )
        )

        incident_count = int(
            rng.poisson(lam=0.2 + 1.8 * max(0, drift_pressure - 0.3))
        )

        psi_a = population_stability_index(
            reference["feature_a"].to_numpy(),
            feature_a,
        )

        psi_b = population_stability_index(
            reference["feature_b"].to_numpy(),
            feature_b,
        )

        psi_c = population_stability_index(
            reference["feature_c"].to_numpy(),
            feature_c,
        )

        prediction_psi = population_stability_index(
            reference["prediction_score"].to_numpy(),
            probability,
        )

        rows.append(
            {
                "batch": batch,
                "psi_feature_a": psi_a,
                "psi_feature_b": psi_b,
                "psi_feature_c": psi_c,
                "prediction_psi": prediction_psi,
                "max_feature_psi": max(psi_a, psi_b, psi_c),
                "accuracy": accuracy,
                "positive_rate": positive_rate,
                "mean_prediction": mean_prediction,
                "latency_ms": latency_ms,
                "missing_rate": missing_rate,
                "incident_count": incident_count,
                "label_available": int(batch >= 4),
            }
        )

    return pd.DataFrame(rows)


def score_observability_risk(records: pd.DataFrame) -> pd.DataFrame:
    """Score production batches for monitoring and governance risk."""
    scored = records.copy()

    scored["performance_degradation"] = np.clip(
        0.88 - scored["accuracy"],
        0,
        1,
    )

    scored["drift_signal"] = np.clip(
        0.45 * scored["max_feature_psi"]
        + 0.35 * scored["prediction_psi"]
        + 0.20 * scored["missing_rate"] * 5,
        0,
        1.5,
    )

    scored["operational_signal"] = np.clip(
        (scored["latency_ms"] / 1200)
        + (scored["incident_count"] / 8),
        0,
        1.5,
    )

    scored["observability_risk"] = (
        0.35 * scored["drift_signal"]
        + 0.30 * scored["performance_degradation"]
        + 0.20 * scored["operational_signal"]
        + 0.15 * np.clip(scored["missing_rate"] * 5, 0, 1)
    )

    scored["alert_level"] = np.select(
        [
            scored["observability_risk"] > 0.60,
            scored["observability_risk"] > 0.40,
            scored["observability_risk"] > 0.25,
        ],
        [
            "incident_review",
            "action_required",
            "warning",
        ],
        default="normal",
    )

    scored["review_required"] = (
        (scored["alert_level"].isin(["action_required", "incident_review"]))
        | (scored["max_feature_psi"] > 0.25)
        | (scored["prediction_psi"] > 0.25)
        | (scored["accuracy"] < 0.78)
        | (scored["incident_count"] >= 2)
    )

    scored["recommended_action"] = np.select(
        [
            scored["alert_level"].eq("incident_review"),
            scored["max_feature_psi"] > 0.35,
            scored["accuracy"] < 0.78,
            scored["prediction_psi"] > 0.25,
            scored["incident_count"] >= 2,
        ],
        [
            "pause_or_rollback_and_open_incident",
            "investigate_data_pipeline_and_feature_drift",
            "review_performance_and_retraining_candidate",
            "review_thresholds_and_prediction_distribution",
            "open_operational_incident_review",
        ],
        default="continue_monitoring",
    )

    return scored


def main() -> None:
    """Run model monitoring, drift, and observability review."""
    reference = simulate_reference_data()
    production = simulate_production_batches(reference)
    scored = score_observability_risk(production)

    governance_summary = pd.DataFrame(
        [
            {
                "batches_reviewed": len(scored),
                "review_required": int(scored["review_required"].sum()),
                "incident_review_batches": int(
                    scored["alert_level"].eq("incident_review").sum()
                ),
                "max_feature_psi_observed": scored["max_feature_psi"].max(),
                "max_prediction_psi_observed": scored["prediction_psi"].max(),
                "minimum_accuracy_observed": scored["accuracy"].min(),
                "mean_latency_ms": scored["latency_ms"].mean(),
                "total_incidents": int(scored["incident_count"].sum()),
                "mean_observability_risk": scored["observability_risk"].mean(),
            }
        ]
    )

    reference.to_csv(
        OUTPUT_DIR / "python_reference_data.csv",
        index=False,
    )

    production.to_csv(
        OUTPUT_DIR / "python_production_monitoring_records.csv",
        index=False,
    )

    scored.to_csv(
        OUTPUT_DIR / "python_observability_risk_scores.csv",
        index=False,
    )

    governance_summary.to_csv(
        OUTPUT_DIR / "python_observability_governance_summary.csv",
        index=False,
    )

    memo = f"""# Model Monitoring, Drift, and AI Observability Memo

Batches reviewed: {int(governance_summary.loc[0, "batches_reviewed"])}
Review required: {int(governance_summary.loc[0, "review_required"])}
Incident-review batches: {int(governance_summary.loc[0, "incident_review_batches"])}
Maximum feature PSI observed: {governance_summary.loc[0, "max_feature_psi_observed"]:.4f}
Maximum prediction PSI observed: {governance_summary.loc[0, "max_prediction_psi_observed"]:.4f}
Minimum accuracy observed: {governance_summary.loc[0, "minimum_accuracy_observed"]:.4f}
Mean latency ms: {governance_summary.loc[0, "mean_latency_ms"]:.2f}
Total incidents: {int(governance_summary.loc[0, "total_incidents"])}
Mean observability risk: {governance_summary.loc[0, "mean_observability_risk"]:.4f}

Interpretation:
- Drift should be interpreted alongside performance, latency, incidents, and missingness.
- Production monitoring should distinguish warning signals from incident-level signals.
- Retraining should be governed, not automatic.
- Rollback readiness and incident response are part of model observability.
"""

    (OUTPUT_DIR / "python_observability_governance_memo.md").write_text(memo)

    print(governance_summary.T)
    print(scored)
    print(memo)


if __name__ == "__main__":
    main()
This workflow illustrates the difference between a metric and an operating signal. Feature PSI, prediction PSI, accuracy, latency, missingness, and incidents are each incomplete alone. Together, they form a more useful picture of production risk. A mature observability program should interpret them through context, labels, workflow, slice behavior, and governance authority.
R Workflow: Drift and Monitoring Summary
The following R workflow simulates production monitoring batches and summarizes drift, accuracy, latency, incidents, and review status. It is designed as a lightweight statistical review layer for model observability governance.
# Model Monitoring, Drift, and AI Observability
# R workflow: drift and monitoring summary.

set.seed(42)

n_batches <- 24

monitoring <- data.frame(
  batch = 1:n_batches,
  psi_feature_a = pmax(
    0,
    rnorm(
      n_batches,
      mean = seq(0.02, 0.32, length.out = n_batches),
      sd = 0.04
    )
  ),
  psi_feature_b = pmax(
    0,
    rnorm(
      n_batches,
      mean = seq(0.01, 0.26, length.out = n_batches),
      sd = 0.04
    )
  ),
  psi_feature_c = pmax(
    0,
    rnorm(
      n_batches,
      mean = seq(0.02, 0.22, length.out = n_batches),
      sd = 0.03
    )
  ),
  prediction_psi = pmax(
    0,
    rnorm(
      n_batches,
      mean = seq(0.02, 0.28, length.out = n_batches),
      sd = 0.05
    )
  ),
  accuracy = pmin(
    0.92,
    pmax(
      0.65,
      rnorm(
        n_batches,
        mean = seq(0.88, 0.76, length.out = n_batches),
        sd = 0.03
      )
    )
  ),
  latency_ms = rgamma(n_batches, shape = 2.6, scale = 130) +
    seq(0, 240, length.out = n_batches),
  missing_rate = pmax(
    0,
    rnorm(
      n_batches,
      mean = seq(0.01, 0.055, length.out = n_batches),
      sd = 0.01
    )
  ),
  incident_count = rpois(
    n_batches,
    lambda = seq(0.1, 1.7, length.out = n_batches)
  )
)

monitoring$max_feature_psi <- pmax(
  monitoring$psi_feature_a,
  monitoring$psi_feature_b,
  monitoring$psi_feature_c
)

monitoring$performance_degradation <- pmax(
  0,
  0.88 - monitoring$accuracy
)

monitoring$drift_signal <- pmin(
  1.5,
  0.45 * monitoring$max_feature_psi +
    0.35 * monitoring$prediction_psi +
    0.20 * monitoring$missing_rate * 5
)

monitoring$operational_signal <- pmin(
  1.5,
  (monitoring$latency_ms / 1200) + (monitoring$incident_count / 8)
)

monitoring$observability_risk <- 0.35 * monitoring$drift_signal +
  0.30 * monitoring$performance_degradation +
  0.20 * monitoring$operational_signal +
  0.15 * pmin(monitoring$missing_rate * 5, 1)

monitoring$alert_level <- ifelse(
  monitoring$observability_risk > 0.60,
  "incident_review",
  ifelse(
    monitoring$observability_risk > 0.40,
    "action_required",
    ifelse(
      monitoring$observability_risk > 0.25,
      "warning",
      "normal"
    )
  )
)

monitoring$review_required <- monitoring$alert_level %in% c(
  "action_required",
  "incident_review"
) |
  monitoring$max_feature_psi > 0.25 |
  monitoring$prediction_psi > 0.25 |
  monitoring$accuracy < 0.78 |
  monitoring$incident_count >= 2

governance_summary <- data.frame(
  batches_reviewed = nrow(monitoring),
  review_required = sum(monitoring$review_required),
  incident_review_batches = sum(monitoring$alert_level == "incident_review"),
  max_feature_psi_observed = max(monitoring$max_feature_psi),
  max_prediction_psi_observed = max(monitoring$prediction_psi),
  minimum_accuracy_observed = min(monitoring$accuracy),
  mean_latency_ms = mean(monitoring$latency_ms),
  total_incidents = sum(monitoring$incident_count),
  mean_observability_risk = mean(monitoring$observability_risk)
)

alert_summary <- aggregate(
  cbind(
    max_feature_psi,
    prediction_psi,
    accuracy,
    latency_ms,
    incident_count,
    observability_risk,
    review_required
  ) ~ alert_level,
  data = monitoring,
  FUN = mean
)

dir.create("outputs", recursive = TRUE, showWarnings = FALSE)

write.csv(
  monitoring,
  "outputs/r_observability_monitoring_records.csv",
  row.names = FALSE
)

write.csv(
  alert_summary,
  "outputs/r_observability_alert_summary.csv",
  row.names = FALSE
)

write.csv(
  governance_summary,
  "outputs/r_observability_governance_summary.csv",
  row.names = FALSE
)

print("Monitoring records")
print(monitoring)

print("Alert summary")
print(alert_summary)

print("Governance summary")
print(governance_summary)
This R workflow mirrors the production-monitoring logic in a compact form. It summarizes monitoring records by alert level so drift, accuracy, latency, incidents, and review status can be interpreted together rather than as disconnected signals.
GitHub Repository
The article body includes selected computational examples so the conceptual and mathematical argument remains readable. The full repository can hold expanded workflows for feature drift, prediction drift, delayed-label evaluation, slice-level monitoring, LLM/RAG/agent observability, dashboard logic, SQL monitoring tables, incident registers, retraining review, rollback readiness, and governance documentation.
From Dashboards to Operational Accountability
Model monitoring, drift, and AI observability show why trustworthy AI cannot end at deployment. A model can be carefully validated, responsibly approved, and still become unreliable as the world changes around it. Production is not a static test set. It is a living environment of users, data pipelines, workflows, feedback loops, policies, documents, tools, and institutional decisions.
The central lesson is that observability must connect evidence to responsibility. It is not enough to measure feature drift, prediction shift, latency, or errors. The institution must know what those signals mean, who owns them, when they trigger investigation, when they justify retraining, when they require rollback, and how decisions are documented. Monitoring without authority is passive. Observability with governance becomes accountability.
This article also shows why AI observability must expand beyond traditional model metrics. Modern AI systems may include prompts, retrieval indexes, embeddings, tools, agents, human review queues, safety filters, source permissions, and long-running workflows. Each layer can drift, fail, or create harm. Observability must therefore make the whole system visible, not only the model endpoint.
The strongest AI systems will not be those that assume predeployment evaluation is enough. They will be those that continue learning responsibly after deployment: detecting change, investigating uncertainty, protecting vulnerable slices, documenting incidents, governing retraining, preserving rollback options, and making accountability possible over time.
Within the Artificial Intelligence Systems knowledge series, this article belongs near Model Validation, Benchmarking, and Generalization Theory, Calibration, Uncertainty, and Probability in AI Systems, Robustness and Adversarial Resilience in Machine Learning, Data Governance, Provenance, and Lineage in AI Systems, Retrieval-Augmented Generation and AI Knowledge Systems, AI Agents, Tool Use, and Workflow Automation, Artificial Intelligence in Decision Support Systems, and AI Governance and Regulatory Systems. It provides the production-operations layer for understanding how AI systems remain reliable, reviewable, and governable after deployment.
Related Articles
- Artificial Intelligence Systems
- Model Validation, Benchmarking, and Generalization Theory
- Calibration, Uncertainty, and Probability in AI Systems
- Robustness and Adversarial Resilience in Machine Learning
- Data Governance, Provenance, and Lineage in AI Systems
- Explainable AI and Model Interpretability
- Artificial Intelligence in Decision Support Systems
- Retrieval-Augmented Generation and AI Knowledge Systems
- AI Agents, Tool Use, and Workflow Automation
- AI Governance and Regulatory Systems
Further Reading
- Sculley, D. et al. (2015) ‘Hidden Technical Debt in Machine Learning Systems’, Advances in Neural Information Processing Systems. Available at: https://papers.nips.cc/paper/5656-hidden-technical-debt-in-machine-learning-systems
- Breck, E. et al. (2017) ‘The ML Test Score: A Rubric for ML Production Readiness and Technical Debt Reduction’. Available at: https://research.google/pubs/the-ml-test-score-a-rubric-for-ml-production-readiness-and-technical-debt-reduction/
- Google Developers (2025) ‘Production ML Systems: Monitoring Pipelines’. Available at: https://developers.google.com/machine-learning/crash-course/production-ml-systems/monitoring
- NIST (2023) Artificial Intelligence Risk Management Framework (AI RMF 1.0). Available at: https://www.nist.gov/publications/artificial-intelligence-risk-management-framework-ai-rmf-10
- Hinder, F., Vaquet, V. and Hammer, B. (2024) ‘One or Two Things We Know About Concept Drift—a Survey’, Frontiers in Artificial Intelligence. Available at: https://www.frontiersin.org/journals/artificial-intelligence/articles/10.3389/frai.2024.1330257/full
- Evidently AI (2026) Open-source evaluation and observability for ML and LLM systems. Available at: https://github.com/evidentlyai/evidently
References
- Breck, E., Cai, S., Nielsen, E., Salib, M. and Sculley, D. (2017) ‘The ML Test Score: A Rubric for ML Production Readiness and Technical Debt Reduction’. Available at: https://research.google/pubs/the-ml-test-score-a-rubric-for-ml-production-readiness-and-technical-debt-reduction/
- Evidently AI (2026) ‘What is Evidently?’ Available at: https://github.com/evidentlyai/evidently
- Evidently AI (2026) ‘Data Drift’. Available at: https://docs.evidentlyai.com/metrics/preset_data_drift
- Google Cloud (2024) ‘Monitor ML model skew and drift in BigQuery’. Available at: https://cloud.google.com/blog/products/data-analytics/monitor-ml-model-skew-and-drift-in-bigquery/
- Google Developers (2025) ‘Production ML Systems: Monitoring Pipelines’. Available at: https://developers.google.com/machine-learning/crash-course/production-ml-systems/monitoring
- Hinder, F., Vaquet, V. and Hammer, B. (2024) ‘One or Two Things We Know About Concept Drift—a Survey’, Frontiers in Artificial Intelligence. Available at: https://www.frontiersin.org/journals/artificial-intelligence/articles/10.3389/frai.2024.1330257/full
- NIST (2023) Artificial Intelligence Risk Management Framework (AI RMF 1.0). Available at: https://www.nist.gov/publications/artificial-intelligence-risk-management-framework-ai-rmf-10
- Sculley, D. et al. (2015) ‘Hidden Technical Debt in Machine Learning Systems’, Advances in Neural Information Processing Systems. Available at: https://papers.nips.cc/paper/5656-hidden-technical-debt-in-machine-learning-systems