
Last Updated June 4, 2026
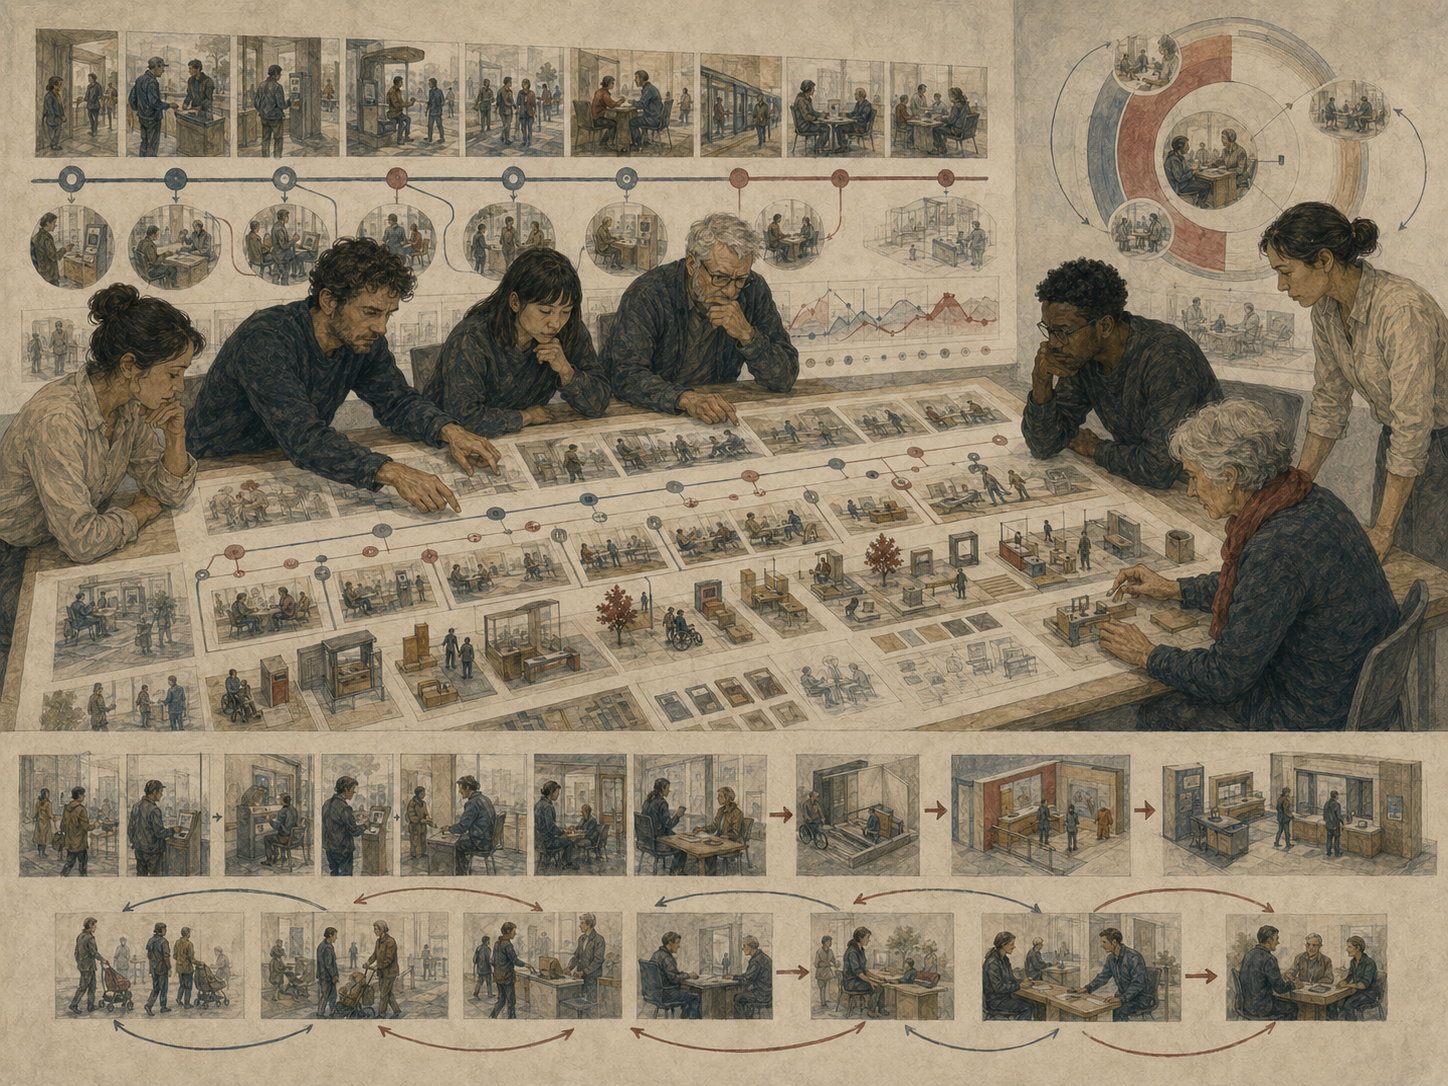
Journey mapping and experience design examine how individuals and stakeholders interact with systems over time, focusing on the sequence of touchpoints, decisions, emotions, constraints, delays, handoffs, feedback, and accumulated burdens that shape real-world experience. In strategic ideation, journey mapping is not merely a visualization tool or customer-experience artifact. It is a disciplined method for understanding how systems are actually encountered, interpreted, and navigated by the people who must move through them.
Experience design builds on that understanding. It translates journey evidence into better sequences, clearer communication, reduced friction, stronger decision support, more coherent touchpoints, and more humane system performance. Where journey mapping makes lived experience visible, experience design asks how the system should be reorganized so that people can act with greater clarity, confidence, dignity, access, and effectiveness.
This matters because organizations often design systems as static architectures: process diagrams, workflows, operating procedures, technical infrastructures, service models, governance routines, and platform requirements. Users do not experience systems as diagrams. They experience them as journeys: fragmented, emotional, time-bound, sometimes confusing, often inconsistent, and shaped by prior expectations, trust, access, memory, context, and constraint. A system may be internally logical and still be externally burdensome. A process may be operationally complete and still feel incoherent in use. A platform may appear intuitive to its designers while remaining opaque to first-time users.
At its deepest level, journey mapping changes how strategy understands performance. It asks not only whether the system technically functions, but whether the sequence through which people encounter it is intelligible, trustworthy, accessible, and actionable. It shows that failure often occurs not at one isolated touchpoint but across transitions: between channels, departments, decisions, documents, interfaces, teams, policies, and moments of uncertainty. Experience design then intervenes in those transitions, reducing the cumulative cost of moving through the system.
This article examines journey mapping and experience design as foundations of strategic ideation. It explains why experiences must be understood as sequences rather than isolated interactions, how journeys are structured, why friction accumulates across time, how journey mapping reframes strategic problems, how multi-channel and multi-stakeholder journeys complicate design, why behavioral decision pathways matter, how measurement and continuous refinement improve experience quality, where journey mapping can mislead, and how ethical and accessibility considerations must shape experience design from the beginning.
Main Library
Publications
Article Map
Strategic Ideation
Related Topic
Systems Thinking
Related Topic
Design Thinking
Related Topic
Futures Thinking
Why Journey Mapping Matters in Strategic Ideation
Journey mapping matters because many strategic failures are sequential failures. The issue is not always that one touchpoint is broken, one interface is confusing, one form is poorly written, or one service agent is unhelpful. More often, the experience deteriorates across a sequence: the entry point is unclear, the next step is ambiguous, the handoff loses context, the user must repeat information, the status is invisible, the support channel does not know the prior interaction, the policy language creates anxiety, and the outcome arrives without explanation. Each element may appear minor in isolation. Together, they create abandonment, mistrust, frustration, error, delay, and disengagement.
Traditional strategy often privileges the internal view of a system. It asks whether the process exists, whether the workflow is documented, whether the platform performs, whether the policy is implemented, or whether the service meets operational requirements. Journey mapping adds another question: what does the system become when lived over time by the person who must navigate it? That question changes strategic ideation because it reveals failure modes that process maps and dashboards often miss.
In strategic ideation, journey mapping is especially valuable when the organization faces low adoption, high abandonment, repeated support requests, weak trust, poor completion, uneven access, service fragmentation, user confusion, or unexplained dissatisfaction. These are rarely solved by adding more features alone. They require understanding how people move through the system, where meaning breaks down, and where the organization’s structure imposes hidden work on the user.
| Strategic problem | Journey-mapping contribution | Risk if ignored |
|---|---|---|
| Low adoption | Reveals entry-point confusion, weak value recognition, or trust barriers. | The organization blames users instead of redesigning the path. |
| High abandonment | Identifies where friction, uncertainty, or effort accumulates. | Teams optimize isolated steps while the journey still fails. |
| Repeated support demand | Shows where instructions, status cues, or transitions are unclear. | Support volume is treated as a staffing issue only. |
| Uneven access | Surfaces barriers that affect some users more than others. | Efficiency gains mask exclusion and burden shifting. |
| Weak trust | Identifies moments where opacity, delay, or inconsistency damages confidence. | The organization invests in messaging while the experience remains mistrusted. |
Journey mapping improves strategic ideation because it shows where systems succeed or fail as lived sequences, not merely as designed structures.
From Systems to Experiences
Traditional strategy often prioritizes system structure: organizational charts, process flows, technical architectures, governance routines, staffing models, and operational efficiency. These perspectives are necessary, but incomplete. They describe how systems are intended to function rather than how they are actually experienced. Journey mapping shifts the analytical lens from internal system design to experiential reality.
This distinction is critical. A process that appears efficient on paper may feel confusing, fragmented, or burdensome in practice. A service that appears comprehensive may create cognitive overload across multiple steps. A platform that appears intuitive to its creators may be opaque to first-time users. A public process may satisfy internal compliance while leaving residents uncertain, anxious, or repeatedly responsible for connecting pieces that the institution itself has failed to connect.
Experience is not a soft add-on to performance. It is a form of system performance. If the experience is unintelligible, inaccessible, emotionally costly, overly fragmented, or burdensome, the system is not functioning well from the standpoint of the person who must use it. Journey mapping helps make that gap visible.
| Internal system view | Journey view | Strategic implication |
|---|---|---|
| The process has defined steps. | The user may not understand the sequence or know where they are. | Design must support orientation, progress, and next action. |
| The workflow is complete. | The journey may require repeated effort, memory, or re-entry. | Continuity matters as much as completion. |
| The platform is functional. | The user may experience uncertainty, anxiety, or lack of trust. | Emotional and interpretive conditions affect use. |
| The policy is available. | The policy may be difficult to understand or act upon. | Information design is part of strategy. |
| The organization has channels. | Channels may not connect from the user’s perspective. | Cross-channel continuity is a strategic design problem. |
Strategy improves when it stops treating experience as a side effect of process and starts treating it as a core dimension of system performance.
The Structure of a Journey
A journey is not a single interaction but a sequence of moments connected over time. These moments typically include entry points, transitions, decision nodes, delays, status checks, feedback loops, support requests, handoffs, breakdowns, and outcomes. Each stage is shaped by context, expectations, prior experience, available information, emotional state, trust, access, and the user’s capacity to act.
Journey mapping makes this structure explicit. It allows teams to trace what a person must do, think, feel, decide, remember, repeat, interpret, and recover from across the full experience. This layered view reveals that performance is not determined solely by individual components but by how those components connect. The overall journey may fail even if each local part appears acceptable in isolation.
| Journey element | What it captures | Strategic use |
|---|---|---|
| Entry point | How a person begins the journey and forms initial expectations. | Improves discoverability, trust, and first-step clarity. |
| Touchpoint | Where the person interacts with a system, person, interface, document, or environment. | Identifies visible moments of experience quality or breakdown. |
| Action | What the person must do at each stage. | Reveals effort, complexity, duplication, and role burden. |
| Thought or interpretation | How the person makes sense of what is happening. | Shows where meaning, confidence, or comprehension fails. |
| Emotion | Confidence, frustration, anxiety, relief, embarrassment, uncertainty, or trust. | Highlights emotional cost and moments of reassurance or harm. |
| Pain point | Friction, delay, failure, confusion, exclusion, or repeated effort. | Identifies priority points for redesign. |
| Transition | Movement between channels, teams, steps, documents, or responsibilities. | Reveals handoff failures and continuity gaps. |
| Moment of truth | A high-consequence point that disproportionately shapes trust or outcome. | Focuses design effort where experience has strategic leverage. |
What matters is not only the quality of each touchpoint, but the coherence of the sequence that connects them.
Temporal Dynamics and Accumulated Friction
One of the most important contributions of journey mapping is its attention to temporal dynamics. Many systems fail not because of a single catastrophic flaw but because of accumulated friction. Small inefficiencies compound across stages. Minor uncertainties become significant barriers when repeated. Cognitive load increases as users must remember, interpret, and reconcile information across multiple steps. Emotional strain grows when people repeatedly feel lost, delayed, judged, or unsure whether they are doing the right thing.
Experience design must therefore account for accumulation. A journey that is manageable in isolation may become overwhelming when experienced as a sequence. A form may be acceptable by itself, but not after three prior forms. A wait may be tolerable if status is clear, but not if the person has no visibility. A repeated explanation may be manageable once, but degrading when required across channels. A small accessibility barrier may become exclusionary when layered with time pressure, unfamiliar language, weak support, or high stakes.
This insight shifts strategic focus from optimizing isolated steps to designing continuity. The question is not simply “Is this touchpoint usable?” but “What burden has the person already carried by the time they arrive here?” Journey mapping makes cumulative burden visible.
| Friction type | How it accumulates | Experience-design response |
|---|---|---|
| Time cost | Repeated waiting, rework, or delays increase fatigue. | Clarify timing, reduce redundant steps, and provide status visibility. |
| Cognitive load | Users must remember requirements, interpret rules, and reconcile information. | Use plain language, progressive disclosure, and decision support. |
| Emotional cost | Uncertainty, fear of error, embarrassment, or mistrust compounds over time. | Design reassurance, transparency, recovery paths, and respectful communication. |
| Administrative burden | Users repeatedly provide information the system should already know. | Improve data continuity, handoffs, and internal coordination. |
| Access burden | Barriers in language, disability, device access, literacy, or availability accumulate. | Build accessibility into the journey rather than adding it later. |
| Trust erosion | Inconsistency and opacity undermine confidence across stages. | Make commitments, status, decisions, and escalation pathways visible. |
Experience breaks down less often through one major rupture than through the cumulative weight of many small burdens.
Experience Design as System Intervention
Experience design translates journey insight into intervention. It focuses on improving how systems are encountered rather than only how they are structured. This may involve simplifying interfaces, clarifying communication, reducing unnecessary steps, aligning expectations with outcomes, restructuring the sequence of interactions, improving support pathways, reducing ambiguity, or strengthening cross-channel continuity.
Importantly, experience design is not limited to aesthetics, interface polish, or customer satisfaction. It includes information architecture, role clarity, decision design, process sequencing, behavioral cues, trust signals, handoff quality, service blueprinting, accessibility, feedback mechanisms, governance connections, and institutional accountability. In complex systems, small changes in experience can produce disproportionate improvements in outcomes. Reducing uncertainty at a key decision point, for example, may increase completion rates, lower abandonment, improve trust, and reduce support demand.
| Experience-design lever | What it changes | Strategic value |
|---|---|---|
| Information architecture | How information is organized, sequenced, and found. | Reduces confusion and improves comprehension. |
| Process simplification | Number, order, and necessity of steps. | Reduces time cost and completion barriers. |
| Decision support | How users choose, compare, interpret, or proceed. | Improves action under uncertainty. |
| Trust signals | Visibility of status, legitimacy, privacy, commitments, and next steps. | Strengthens confidence and reduces avoidance. |
| Feedback mechanisms | How the system responds to user action. | Improves learning, correction, and reassurance. |
| Handoff design | How context travels between teams, channels, or stages. | Prevents repetition, fragmentation, and user-borne coordination labor. |
| Recovery paths | How users recover from error, delay, misunderstanding, or denial. | Protects dignity and reduces abandonment. |
Experience design is strategic because it changes how the system is interpreted at the moment action is required.
Journey Mapping and Problem Reframing
Journey mapping often reveals that the problem an organization believes it is solving is not the problem users are experiencing. A perceived issue of low adoption may actually reflect confusion at entry points. A perceived issue of inefficiency may stem from redundant steps introduced by institutional silos. A perceived issue of user error may reflect unclear instructions, poor sequencing, weak interface cues, or fear of making an irreversible mistake.
This reframing is strategically valuable because it redirects ideation away from symptoms and toward the sources of friction. Many organizations respond to journey breakdown by adding more communication, more training, more reminders, more documentation, or more features. Journey mapping may reveal that the real issue is sequence, trust, timing, handoff, role ambiguity, or hidden burden. In many cases, the most effective solution is not additional complexity but better alignment between system design and lived experience.
| Initial institutional frame | Journey evidence may reveal | Reframed strategic question |
|---|---|---|
| Users need more information. | Information appears too late, in the wrong order, or without context. | How might we sequence information around user decisions? |
| Users are abandoning the process. | They lose confidence after opaque transitions or repeated effort. | How might we reduce uncertainty and visible burden across the journey? |
| Users make errors. | The system creates ambiguous cues and poor recovery paths. | How might we make correct action easier and error recovery safer? |
| Support demand is too high. | The journey fails to provide status, reassurance, or next-step clarity. | How might we design self-explanation into the experience? |
| People do not trust the service. | Trust is damaged by delay, inconsistency, opacity, or repeated explanation. | How might we design for transparency, continuity, and accountability? |
Journey mapping is valuable not only because it visualizes experience, but because it helps reveal where the organization has framed the wrong problem.
Multi-Channel and Multi-Context Journeys
Modern journeys rarely occur within a single channel. Users move across digital platforms, physical environments, human interactions, automated workflows, email, chat, phone, forms, notifications, documentation, support systems, and organizational boundaries. This creates fragmentation. Information may not transfer cleanly between stages. Context may be lost. Users may be required to repeat actions, re-enter data, reconstruct explanations, or reconcile conflicting instructions.
Journey mapping helps identify these discontinuities. It highlights where transitions break down and where integration is needed. Experience design then focuses on continuity, ensuring that users can move across channels without losing progress, understanding, confidence, or agency. In multi-channel systems, the journey often fails not because each channel is poor, but because the transition between channels has not been designed.
| Multi-channel challenge | Journey symptom | Design response |
|---|---|---|
| Context loss | Users repeat their situation across channels. | Improve internal context transfer and case continuity. |
| Conflicting information | Different touchpoints provide different instructions. | Create source-of-truth governance and message consistency. |
| Progress invisibility | Users do not know where they are or what remains. | Provide status, stage indicators, and next-step visibility. |
| Channel mismatch | Users are forced into channels that do not fit their context. | Offer channel choice and accessible alternatives. |
| Handoff failure | Responsibilities shift without user guidance. | Design transition points, ownership cues, and escalation paths. |
| Repeated authentication | Users repeatedly prove identity or eligibility. | Reduce unnecessary repetition while protecting privacy and security. |
In multi-channel systems, the transition between touchpoints is often more decisive than the touchpoint itself.
Stakeholder Complexity and System-Wide Experience
In many strategic contexts, journeys are not limited to individual end users. They involve multiple stakeholders with different roles, incentives, constraints, and vulnerabilities. A healthcare journey may involve patients, providers, administrators, insurers, caregivers, and regulators. A hiring journey may involve candidates, recruiters, hiring managers, legal reviewers, and internal approvers. A civic-service journey may involve residents, agencies, caseworkers, community organizations, contractors, and public systems.
Experience design must therefore operate at multiple levels. It must consider how individual journeys intersect, where coordination fails, and how system design can better align these perspectives. This expands journey mapping from a user-centric tool into a system-wide analytical framework. A user’s experience often depends on whether the workflows of other actors connect effectively behind the scenes.
This matters because improving one journey can worsen another. A self-service portal may reduce institutional cost while increasing user burden. A faster approval process may increase pressure on frontline workers. A compliance requirement may improve auditability while making access harder for vulnerable users. Experience design must therefore account for system-wide consequences.
| Stakeholder group | Journey concern | Strategic design question |
|---|---|---|
| End users | Clarity, access, effort, trust, completion, dignity. | Can people move through the journey with confidence and agency? |
| Frontline staff | Workload, role clarity, handoffs, emotional labor, system constraints. | Does the design make implementation realistic? |
| Administrators | Coordination, documentation, compliance, resource allocation. | Can internal operations support the promised experience? |
| Partners | Information flow, accountability, timing, shared responsibility. | Where do cross-boundary transitions fail? |
| Affected communities | Fairness, access, cultural fit, legitimacy, trust, burden. | Does the journey distribute benefit and burden equitably? |
| Future users | Long-term accessibility, sustainability, resilience, adaptability. | Will the journey remain viable as conditions change? |
The lived quality of one person’s journey is often shaped by how well several other actors’ workflows connect behind the scenes.
Behavioral Insights and Decision Pathways
Journeys are also decision pathways. At each stage, users interpret information, evaluate options, manage uncertainty, and choose actions under constraints. Behavioral factors such as cognitive load, framing effects, default options, perceived risk, trust signals, timing pressure, social norms, loss aversion, ambiguity, and limited attention all influence journey outcomes.
Integrating behavioral insights into journey mapping allows for more precise intervention. Simplifying choice architecture, reducing ambiguity, clarifying next steps, providing timely feedback, sequencing information around decisions, and making consequences visible can significantly improve decision quality and system outcomes. The key is not to treat users as ideal decision-makers, but as human actors navigating limited attention, imperfect information, uncertainty, and time-bound pressures.
| Behavioral factor | Journey effect | Experience-design response |
|---|---|---|
| Cognitive load | Users abandon or make errors when too much must be remembered or inferred. | Reduce memory burden and provide guided next steps. |
| Ambiguity | Unclear consequences make users delay or seek help. | Clarify what happens next and what each choice means. |
| Risk perception | Fear of error, exposure, denial, or loss reduces action. | Provide recovery paths, reassurance, and transparent criteria. |
| Default effects | Users follow the path of least resistance, even when it is not ideal. | Design defaults ethically and make alternatives understandable. |
| Timing pressure | Decisions made under stress become lower quality. | Reduce unnecessary urgency and provide staged support. |
| Trust cues | Users infer legitimacy from consistency, transparency, and responsiveness. | Make commitments, identity, privacy, and status visible. |
Many journey failures are not failures of motivation. They are failures of decision design.
Core Dimensions of Journey Mapping
Journey mapping is strongest when it captures more than a simplified sequence of steps. A useful journey map combines experience, behavior, context, system structure, and decision points in a way that helps teams generate better strategic ideas.
1. Sequence
Journey mapping begins with the order of stages through which a person moves. Sequence matters because earlier experiences shape later interpretation. Confusion, delay, mistrust, or fatigue can carry forward and change how subsequent touchpoints are experienced.
2. Touchpoints
Touchpoints are the visible moments of interaction between a person and a system. They may include interfaces, staff interactions, physical spaces, messages, forms, portals, documents, automated notifications, or support channels.
3. Transitions
Transitions occur when the user moves between channels, teams, stages, responsibilities, or states of understanding. Many experience failures happen at transitions because ownership, context, or expectation becomes unclear.
4. Emotional State
Emotions such as anxiety, relief, confusion, embarrassment, anger, confidence, and trust affect whether people continue, comply, abandon, seek help, or resist. Emotional evidence is not decorative; it is strategic information about the experience.
5. Friction and Burden
Friction includes delay, repeated effort, unclear information, inaccessible design, confusing choices, status opacity, and recovery difficulty. Burden accumulates across the journey and may be unevenly distributed across user groups.
6. Context
Journeys occur in real environments shaped by time, device access, language, literacy, disability, stress, social support, institutional history, trust, privacy concerns, and competing responsibilities.
7. Behavior
Observation of what people actually do can reveal hidden friction that interviews alone may not surface. Workarounds, repeated help-seeking, avoidance, and abandonment should be treated as journey evidence.
8. Backstage Dependencies
The frontstage experience depends on backstage processes: data systems, staffing, governance, rules, handoffs, approvals, and coordination. Journey maps are stronger when they connect visible experience to hidden operational causes.
| Dimension | Diagnostic question | Useful output |
|---|---|---|
| Sequence | What happens before and after each stage? | Journey timeline. |
| Touchpoints | Where does the person interact with the system? | Touchpoint inventory. |
| Transitions | Where does context or responsibility shift? | Handoff map. |
| Emotion | Where does confidence, anxiety, frustration, or trust change? | Emotional journey layer. |
| Friction | Where does effort, uncertainty, delay, or burden accumulate? | Friction and burden register. |
| Context | What conditions shape the person’s ability to act? | Context map. |
| Behavior | What do people actually do, avoid, repeat, or work around? | Behavior and workaround log. |
| Backstage dependencies | What internal structures produce the visible experience? | Service blueprint or operating model overlay. |
A strong journey map does not merely illustrate a path. It explains how experience is produced across time, context, touchpoints, and system structure.
Core Principles of Experience Design
Experience design turns journey insight into strategic intervention. The following principles help teams move from mapping the current experience to redesigning the conditions that shape it.
1. Design for Continuity
Users should not have to reconstruct the system at every stage. Continuity means that progress, context, status, responsibility, and next steps remain visible as people move across channels and touchpoints.
2. Reduce Ambiguity
Ambiguity increases cognitive load and perceived risk. Strong experience design clarifies what is happening, what matters, what action is required, what will happen next, and what users can do if something goes wrong.
3. Minimize User-Borne Burden
Systems often shift coordination, memory, interpretation, repetition, and recovery labor onto users. Experience design should identify and reduce burdens the institution can reasonably absorb or prevent.
4. Build Trust Through the Journey
Trust is not created by messaging alone. It is built through consistency, transparency, responsiveness, privacy protection, respectful language, visible accountability, and reliable follow-through across stages.
5. Design Recovery Paths
Every journey should account for error, delay, misunderstanding, rejection, missing information, and exceptional cases. Recovery paths protect dignity and reduce abandonment.
6. Treat Accessibility as Structural
Accessibility is not a final compliance layer. It shapes entry, comprehension, navigation, timing, channel choice, language, device compatibility, support, and completion across the whole journey.
7. Close Feedback Loops
Users need to know whether an action succeeded, what changed, what remains, and when they should expect response. Feedback loops also help organizations learn from journey breakdowns.
8. Align Frontstage and Backstage
Experience design fails when frontstage promises exceed backstage capacity. The visible journey must be supported by staffing, workflows, data, governance, and operational coordination.
| Principle | Design question | Failure prevented |
|---|---|---|
| Continuity | Can the user move forward without losing context? | Fragmentation and repeated explanation. |
| Clarity | Does the user know what is happening and what to do? | Confusion, delay, and avoidable support demand. |
| Burden reduction | What labor is the system unnecessarily shifting to users? | Administrative exhaustion and abandonment. |
| Trust | Does the journey demonstrate reliability and accountability? | Mistrust and avoidance. |
| Recovery | Can users recover safely from error or breakdown? | Dead ends and dignity loss. |
| Accessibility | Can diverse users complete the journey under real conditions? | Exclusion and unequal burden. |
| Feedback | Does the system respond visibly to user action? | Uncertainty and repeated checking. |
| System fit | Can backstage operations support the desired experience? | Promises that fail in implementation. |
Experience design is strongest when it improves the conditions under which people interpret, decide, act, recover, and complete the journey.
Measurement and Continuous Refinement
Journey mapping is not a one-time exercise. Systems evolve, user expectations change, technology shifts, policies change, and new constraints emerge. Experience design must therefore be iterative. Organizations should continuously collect data, observe behavior, review support signals, and refine journeys based on evidence.
This creates a feedback loop between design and reality. Metrics may include completion rates, abandonment, wait times, error frequency, support volume, satisfaction, trust, accessibility outcomes, cross-channel continuity, complaint patterns, repeat contact, and outcome quality. Qualitative observation remains equally important because aggregate metrics often hide where meaningful friction actually occurs. A dashboard may show an average completion rate while masking disproportionate burden for particular groups.
| Measurement area | Useful indicators | Interpretive caution |
|---|---|---|
| Completion | Completion rate, time to completion, dropoff stage. | Completion may still involve excessive burden. |
| Friction | Repeat contacts, errors, retries, abandoned forms, support tickets. | Some users silently abandon rather than seek help. |
| Trust | Confidence ratings, status-check frequency, complaint themes, return behavior. | Trust may vary significantly by group or history. |
| Accessibility | Device success, language access, assistive technology compatibility, alternative channel use. | Aggregate success may hide excluded users. |
| Continuity | Handoff failures, repeated data entry, lost context, channel switching. | Internal teams may not see user-borne coordination labor. |
| Experience quality | Observation, interviews, diary studies, journey reviews, emotional state mapping. | Stories need synthesis and pattern review. |
| Outcomes | Behavior change, service resolution, adoption, retention, policy result. | Outcome evidence may require causal interpretation. |
A strong journey map is not only descriptive. It becomes an ongoing instrument for learning and redesign.
Limitations and Critical Perspectives
Journey mapping is powerful, but it has limitations. The strongest practice recognizes where journey maps can oversimplify, misrepresent, or distract from deeper structural questions.
1. Linear Simplification
Journey maps often impose a linear sequence on experiences that may be recursive, fragmented, interrupted, multi-channel, or nonlinear. A map should simplify carefully without pretending that the simplification is the whole reality.
2. Representation Gaps
The journey that is easiest to map may not represent the journey that matters most. Non-users, marginalized groups, overwhelmed users, future users, or those who abandon early may be missing from the evidence.
3. Experience Optimization Without Structural Change
A smoother journey is not always a better system. Experience design can mask deeper problems if it improves usability while leaving inequity, harmful incentives, extraction, or institutional fragmentation untouched.
4. Local Improvement and Burden Shifting
Improving one journey can shift burden elsewhere. A user-facing improvement may increase frontline labor, partner complexity, surveillance pressure, or hidden administrative work.
5. Static Artifacts
Journey maps can become decorative artifacts if they are not connected to evidence, decisions, redesign, implementation, and continuous learning.
6. Metric Reduction
Completion rates and satisfaction scores are useful but incomplete. They may miss dignity, trust, hidden burden, accessibility, and unequal experience across groups.
7. Power Blindness
Journey maps may describe friction without asking who created it, who benefits from it, who can remove it, and whose burden remains institutionally acceptable.
8. Insufficient Domain Knowledge
Experience insight must be joined with technical, legal, operational, financial, ethical, and domain expertise. A journey map alone cannot determine what is feasible, lawful, safe, or strategically responsible.
| Limitation | Risk | Corrective practice |
|---|---|---|
| Linearity | Nonlinear experience is forced into a neat sequence. | Use loops, branches, exceptions, and alternative pathways. |
| Representation gaps | Convenient users define the map. | Include non-users, excluded groups, and abandonment evidence. |
| Experience-only focus | Usability improves while structural problems remain. | Combine journey mapping with systems and institutional analysis. |
| Burden shifting | One group’s journey improves at another group’s expense. | Map backstage labor and stakeholder effects. |
| Static artifacts | The map decorates presentations but changes nothing. | Connect journey evidence to decisions, budgets, and redesign. |
| Metric reduction | Important experience dimensions are hidden by aggregate metrics. | Combine quantitative and qualitative evidence. |
| Power blindness | Friction is treated as neutral design failure. | Ask who has authority to create, maintain, or remove burden. |
| Missing domain expertise | Experience improvements ignore constraints or safety. | Integrate domain specialists and implementation owners. |
Journey mapping is most valuable when it clarifies experience without pretending that experience is the only level of analysis that matters.
Ethical and Accessibility Considerations
Experience design always carries ethical implications. Decisions about defaults, visibility, timing, authentication, language, evidence requirements, support availability, information burden, error recovery, and process structure can advantage some users while excluding or exhausting others. Accessibility is not a peripheral concern but a central design condition, especially when systems are public-facing, high-stakes, or used across diverse populations.
Ethical experience design asks not only whether a journey is smooth, but for whom. It examines whether burdens are hidden, whether choice is manipulated, whether vulnerable users are disproportionately strained, whether disabled users can complete the journey, whether language access is adequate, whether privacy is protected, whether users can recover from error, and whether efficiency for the institution has been achieved by shifting cost onto users.
This matters especially in healthcare, education, public benefits, employment, financial services, civic participation, justice systems, technology platforms, sustainability programs, and high-stakes administrative processes. In these settings, a poorly designed journey can affect dignity, rights, access, trust, and life outcomes.
| Ethical design question | Why it matters | Journey-design response |
|---|---|---|
| Who can begin the journey? | Entry barriers exclude people before they appear in metrics. | Map discoverability, eligibility, language, and access conditions. |
| Who bears the burden? | Efficiency may shift cost to users, workers, or communities. | Conduct burden-shift analysis across stakeholders. |
| Who can recover from error? | Dead ends disproportionately harm vulnerable users. | Design clear recovery, escalation, and appeal pathways. |
| Who is missing from the map? | Non-users and excluded users may carry the strongest evidence. | Include abandonment, exclusion, and non-use research. |
| Does the journey protect dignity? | Repeated explanation, suspicion, or opacity can degrade trust. | Use respectful language, continuity, and transparent criteria. |
| Is accessibility built into every stage? | Late accessibility fixes leave structural barriers intact. | Review device, disability, language, literacy, timing, and support needs. |
| Does the design preserve agency? | Choice architecture can manipulate as well as support. | Make defaults ethical, explain consequences, and preserve meaningful choice. |
A well-designed journey should reduce friction without reducing dignity, agency, or equitable access.
A Practical Journey Mapping and Experience Design Audit
A journey mapping and experience design audit helps teams determine whether a system is being understood from the standpoint of lived experience rather than institutional assumption. It can be used before redesign, during product discovery, after a service launch, when support demand rises, when adoption is weak, or when equity and accessibility concerns emerge.
1. Define the Journey Scope
Clarify where the journey begins and ends, which users or stakeholders are included, which channels matter, and what outcome the journey is supposed to support.
2. Map Stakeholders and Contexts
Identify direct users, non-users, implementers, support staff, affected communities, partners, and groups likely to experience hidden burden or exclusion.
3. Gather Journey Evidence
Use interviews, observation, analytics, support logs, diary studies, usability testing, fieldwork, and accessibility review to understand how the journey is actually experienced.
4. Trace the Sequence
Map entry points, stages, touchpoints, transitions, decisions, delays, support moments, handoffs, outcomes, and recovery paths.
5. Identify Friction and Accumulated Burden
Look for time cost, cognitive load, emotional strain, repeated effort, unclear status, accessibility barriers, trust risk, and user-borne coordination labor.
6. Locate Moments of Truth
Identify high-consequence moments that disproportionately shape confidence, trust, completion, perceived fairness, or abandonment.
7. Connect Frontstage and Backstage
Use service blueprinting or operating-model review to identify internal processes, systems, rules, roles, and handoffs that produce the visible experience.
8. Reframe the Strategic Problem
Ask whether journey evidence changes the problem definition. If the frame does not change, test whether the map is confirming assumptions rather than generating insight.
9. Design Interventions
Prioritize interventions that reduce accumulated burden, improve continuity, clarify decisions, strengthen trust, increase accessibility, and improve completion without shifting harm elsewhere.
10. Establish Feedback and Learning Loops
Define metrics, qualitative review routines, support-signal monitoring, revision triggers, and institutional memory records so the journey can be refined over time.
| Audit step | Core question | Useful output |
|---|---|---|
| Scope | Which journey are we mapping and for whom? | Journey scope statement. |
| Stakeholders | Who experiences, supports, or is affected by the journey? | Stakeholder field map. |
| Evidence | How do we know what the journey is like? | Evidence source inventory. |
| Sequence | What happens across time? | Journey timeline. |
| Friction | Where does burden accumulate? | Friction and burden register. |
| Moments of truth | Where is trust or completion won or lost? | High-leverage intervention map. |
| Backstage | What internal structures produce the experience? | Service blueprint or operating-model overlay. |
| Reframing | How did the journey evidence change the problem? | Reframed design challenge. |
| Redesign | What changes reduce burden and improve outcomes? | Experience intervention portfolio. |
| Learning | How will the journey improve over time? | Measurement and revision plan. |
A serious journey-mapping process should leave behind not only a visual map, but a traceable record of evidence, friction, reframing, redesign decisions, ethical review, and learning loops.
Mathematical Lens: Journeys, Friction, and Experience Quality
A stylized journey can be represented as a sequence of stages:
J = \{s_1, s_2, \dots, s_n\}
\]
Interpretation: \(J\) is the full journey and each \(s_i\) is a stage, touchpoint, or transition. Experience quality depends not only on the local quality of each stage but also on the way these stages connect across time.
Accumulated friction can be expressed conceptually as:
F = \sum_{i=1}^{n} f_i
\]
Interpretation: \(F\) is total accumulated friction and \(f_i\) is the friction associated with stage \(i\). This reflects a core journey-mapping insight: small burdens that seem tolerable locally may become highly consequential when they accumulate across a sequence.
Overall experience quality can be represented as:
Q = \sum_{i=1}^{n} q_i – \sum_{i=1}^{n} f_i
\]
Interpretation: \(Q\) is overall experience quality, \(q_i\) represents stage-level value, clarity, support, or confidence, and \(f_i\) represents stage-level friction, uncertainty, or burden. Experience design is not simply about maximizing positive moments. It is also about reducing cumulative breakdown across the journey.
A transition-risk model can be expressed as:
T_r = \sum_{i=1}^{n-1} (c_i + h_i + u_i)
\]
Interpretation: \(T_r\) represents total transition risk across the journey, where \(c_i\) is context loss, \(h_i\) is handoff failure, and \(u_i\) is uncertainty between stages. This highlights why journey breakdown often occurs between touchpoints rather than inside them.
The mathematical lens clarifies the strategic function of journey mapping: make sequence visible, identify accumulated friction, assess transition risk, and redesign the experience so value can actually be realized.
Advanced R Workflow: Comparing Journey Performance Across Stages
The R workflow below compares stylized journeys across clarity, emotional confidence, friction, transition quality, accessibility, trust, and completion support. It is designed as an evergreen illustration of how journeys can be assessed as sequences rather than isolated touchpoints.
# Install packages if needed.
# install.packages(c("tidyverse"))

library(tidyverse)

# ------------------------------------------------------------
# R Workflow: Comparing Journey Performance Across Stages
# Purpose:
#   Build stylized profiles across journeys using clarity,
#   emotional confidence, friction, transition quality,
#   accessibility, trust, and completion support.
# ------------------------------------------------------------

journeys <- tibble(
  journey = c(
    "Fragmented Institutional Journey",
    "Balanced Guided Journey",
    "High-Touch Human-Supported Journey",
    "Efficient but Brittle Digital Journey",
    "Accessible Trust-Centered Journey"
  ),
  clarity = c(0.36, 0.77, 0.72, 0.69, 0.81),
  emotional_confidence = c(0.31, 0.74, 0.83, 0.48, 0.79),
  friction = c(0.82, 0.39, 0.33, 0.61, 0.28),
  transition_quality = c(0.28, 0.79, 0.71, 0.44, 0.82),
  accessibility = c(0.34, 0.70, 0.68, 0.52, 0.88),
  trust = c(0.30, 0.73, 0.78, 0.50, 0.84),
  completion_support = c(0.34, 0.76, 0.82, 0.57, 0.86)
)

journeys <- journeys %>%
  mutate(
    journey_profile =
      0.18 * clarity +
      0.15 * emotional_confidence -
      0.20 * friction +
      0.15 * transition_quality +
      0.12 * accessibility +
      0.10 * trust +
      0.10 * completion_support,
    redesign_priority =
      0.24 * friction +
      0.18 * (1 - transition_quality) +
      0.16 * (1 - accessibility) +
      0.14 * (1 - trust) +
      0.14 * (1 - clarity) +
      0.14 * (1 - completion_support)
  )

print(journeys)

journeys_long <- journeys %>%
  pivot_longer(
    cols = c(
      clarity,
      emotional_confidence,
      friction,
      transition_quality,
      accessibility,
      trust,
      completion_support
    ),
    names_to = "dimension",
    values_to = "value"
  )

ggplot(journeys_long, aes(x = dimension, y = value, fill = journey)) +
  geom_col(position = "dodge") +
  labs(
    title = "Stylized Journey-Performance Dimensions",
    x = "Dimension",
    y = "Value",
    fill = "Journey"
  ) +
  theme_minimal(base_size = 12) +
  coord_flip()

ggplot(journeys, aes(x = reorder(journey, journey_profile), y = journey_profile)) +
  geom_col() +
  coord_flip() +
  labs(
    title = "Stylized Journey Experience Profile",
    x = "Journey",
    y = "Profile Score"
  ) +
  theme_minimal(base_size = 12)

ggplot(journeys, aes(x = reorder(journey, redesign_priority), y = redesign_priority)) +
  geom_col() +
  coord_flip() +
  labs(
    title = "Journey Redesign Priority",
    x = "Journey",
    y = "Priority Score"
  ) +
  theme_minimal(base_size = 12)

write_csv(journeys, "journey_mapping_profiles.csv")
This workflow is not a universal scoring system. Its value is conceptual and methodological: it helps teams compare journeys across dimensions that matter for strategic experience design, including clarity, emotional confidence, accumulated friction, transitions, accessibility, trust, and completion support.
Advanced Python Workflow: Simulating Accumulated Friction
The Python workflow below simulates stylized journeys over multiple stages, showing how small increments of friction can compound and reduce overall journey quality if transitions, accessibility, trust, and support are weak.
# Install packages if needed:
# pip install pandas numpy matplotlib

import numpy as np
import pandas as pd
import matplotlib.pyplot as plt

# ------------------------------------------------------------
# Python Workflow: Simulating Accumulated Friction
# Purpose:
#   Compare journeys whose quality depends on stage clarity,
#   friction, transition support, accessibility, trust,
#   and cumulative burden.
# ------------------------------------------------------------

stages = np.arange(1, 11)

def simulate_journey(
    clarity,
    friction,
    transition,
    support,
    accessibility,
    trust,
    initial_state=0.80
):
    state = np.zeros(len(stages))
    state[0] = initial_state

    for t in range(1, len(stages)):
        gain = (
            0.10 * clarity +
            0.08 * transition +
            0.08 * support +
            0.07 * accessibility +
            0.07 * trust
        )

        burden = 0.12 * friction
        transition_penalty = 0.05 * (1 - transition)
        access_penalty = 0.04 * (1 - accessibility)

        state[t] = state[t - 1] + gain / 5 - burden / 5 - transition_penalty / 5 - access_penalty / 5
        state[t] = np.clip(state[t], 0, 1.5)

    return state

fragmented = simulate_journey(
    clarity=0.36,
    friction=0.82,
    transition=0.28,
    support=0.34,
    accessibility=0.34,
    trust=0.30
)

balanced = simulate_journey(
    clarity=0.77,
    friction=0.39,
    transition=0.79,
    support=0.76,
    accessibility=0.70,
    trust=0.73
)

human_supported = simulate_journey(
    clarity=0.72,
    friction=0.33,
    transition=0.71,
    support=0.82,
    accessibility=0.68,
    trust=0.78
)

brittle_digital = simulate_journey(
    clarity=0.69,
    friction=0.61,
    transition=0.44,
    support=0.57,
    accessibility=0.52,
    trust=0.50
)

accessible_trust_centered = simulate_journey(
    clarity=0.81,
    friction=0.28,
    transition=0.82,
    support=0.86,
    accessibility=0.88,
    trust=0.84
)

df = pd.DataFrame({
    "stage": stages,
    "Fragmented Institutional Journey": fragmented,
    "Balanced Guided Journey": balanced,
    "High-Touch Human-Supported Journey": human_supported,
    "Efficient but Brittle Digital Journey": brittle_digital,
    "Accessible Trust-Centered Journey": accessible_trust_centered
})

print(df.head())

plt.figure(figsize=(10, 6))
for col in df.columns[1:]:
    plt.plot(df["stage"], df[col], marker="o", label=col)

plt.xlabel("Journey Stage")
plt.ylabel("Experience Quality")
plt.title("Accumulated Friction Across Journey Stages")
plt.legend()
plt.tight_layout()
plt.show()

final_scores = df.drop(columns=["stage"]).iloc[-1].sort_values(ascending=False)
print(final_scores)

df.to_csv("journey_mapping_simulation.csv", index=False)
This simulation is intentionally stylized. Its value is conceptual: journey quality is shaped by how clarity, friction, transition quality, accessibility, trust, and completion support interact over time. Experience design should therefore focus not only on improving individual stages, but on preventing cumulative breakdown across the sequence.
GitHub Repository
The companion repository for this article will provide advanced strategist-facing workflows for journey mapping diagnostics, accumulated-friction scoring, touchpoint analysis, transition-risk review, service blueprinting, multi-channel continuity assessment, stakeholder journey comparison, accessibility and dignity review, behavioral decision-pathway modeling, journey redesign prioritization, measurement design, and institutional experience-learning records.
Complete Code Repository
The companion code includes Python, R, Julia, SQL, Rust, Go, C++, Fortran, C, documentation, synthetic datasets, outputs, and notebook placeholders for applied journey mapping and experience design analysis in strategic workflows.
The repository structure is designed to support professional strategic analysis rather than generic coding demonstrations. The python/ folder can model accumulated friction, transition risk, stage-level burden, journey quality, accessibility risk, trust signals, behavioral decision points, support demand, and redesign priorities. The r/ folder can compare journey-performance profiles and visualize experience-design patterns across contexts. The julia/ folder can support sensitivity analysis for friction accumulation and transition quality. The sql/ folder can define schemas for journeys, stages, touchpoints, transitions, actors, pain points, friction signals, accessibility issues, emotional states, backstage dependencies, interventions, metrics, and learning records.
Additional folders can support command-line diagnostics, lower-level scoring utilities, and reproducible documentation. The rust/ folder can provide a command-line journey diagnostics scaffold. The go/ folder can provide experience-quality evaluation utilities. The cpp, fortran, and c folders can provide efficient scoring examples and low-level utilities. The docs, data, outputs, and notebooks folders can support article notes, modeling principles, synthetic datasets, generated outputs, and notebook placeholders.
This code should be understood as a transparent learning and modeling scaffold. It is intended for synthetic-data research, methods demonstration, institutional learning, strategic analysis, and reproducible workflow development. It is not a substitute for user research, accessibility testing, ethical review, domain expertise, accountable governance, service design practice, or participatory judgment.
Conclusion
Journey mapping and experience design provide a critical bridge between system structure and human experience. They help strategists understand not only what a system is supposed to do, but how it is actually lived, navigated, interpreted, and endured over time. By making the temporal and experiential dimensions of systems visible, journey mapping enables more accurate problem framing and more effective ideation.
In strategic work, this perspective is indispensable. It reveals how friction accumulates, how transitions fail, how trust is built or damaged, how accessibility barriers compound, how users absorb hidden labor, and how internal structures produce external experience. It also shows why many strategic problems cannot be solved through isolated touchpoint improvement. They require redesigning the sequence, handoffs, information architecture, decision pathways, feedback loops, and backstage dependencies that shape the journey as a whole.
Used superficially, journey mapping becomes a decorative diagram: a neat sequence of stages that confirms what the organization already believes. Used rigorously, it becomes a method of strategic intelligence. It helps institutions see where their internal logic diverges from lived reality, where the real problem has been misframed, and where experience design can reduce burden without reducing dignity, agency, or equitable access.
Better strategies emerge not from designing systems in isolation, but from understanding how those systems are lived, navigated, and experienced over time.
Related Articles
- Strategic Ideation
- Design Thinking Foundations
- Empathy and User-Centered Ideation
- Prototyping and Rapid Experimentation
- Feedback Loops in Design Thinking
- Participatory Ideation and Co-Design
- Prototype Evidence and Strategic Learning
- Problem Framing and Problem Definition
- Systems Thinking in Ideation
- Second-Order Effects and Unintended Consequences
Further Reading
- Kalbach, J. (2016) Mapping Experiences: A Complete Guide to Creating Value Through Journeys, Blueprints, and Diagrams. Sebastopol, CA: O’Reilly Media.
- Nielsen Norman Group (2016) ‘When and how to create customer journey maps’. Available at: https://www.nngroup.com/articles/customer-journey-mapping/
- Nielsen Norman Group (2017) ‘Journey mapping 101’. Available at: https://www.nngroup.com/articles/journey-mapping-101/
- Nielsen Norman Group (2018) ‘Service blueprints: Definition’. Available at: https://www.nngroup.com/articles/service-blueprints-definition/
- Norman, D.A. (2013) The Design of Everyday Things. Revised and expanded edn. New York: Basic Books.
- Stickdorn, M. and Schneider, J. (2011) This Is Service Design Thinking. Amsterdam: BIS Publishers.
- Stickdorn, M., Hormess, M., Lawrence, A. and Schneider, J. (2018) This Is Service Design Doing. Sebastopol, CA: O’Reilly Media.
- Interaction Design Foundation (no date) Customer Journey Maps. Available at: https://www.interaction-design.org/literature/topics/customer-journey-map
References
- Kalbach, J. (2016) Mapping Experiences: A Complete Guide to Creating Value Through Journeys, Blueprints, and Diagrams. Sebastopol, CA: O’Reilly Media.
- Nielsen Norman Group (2016) ‘When and how to create customer journey maps’. Available at: https://www.nngroup.com/articles/customer-journey-mapping/
- Nielsen Norman Group (2017) ‘Journey mapping 101’. Available at: https://www.nngroup.com/articles/journey-mapping-101/
- Nielsen Norman Group (2018) ‘Service blueprints: Definition’. Available at: https://www.nngroup.com/articles/service-blueprints-definition/
- Norman, D.A. (2013) The Design of Everyday Things. Revised and expanded edn. New York: Basic Books.
- Stickdorn, M. and Schneider, J. (2011) This Is Service Design Thinking. Amsterdam: BIS Publishers.
- Stickdorn, M., Hormess, M., Lawrence, A. and Schneider, J. (2018) This Is Service Design Doing. Sebastopol, CA: O’Reilly Media.
- Interaction Design Foundation (no date) Customer Journey Maps. Available at: https://www.interaction-design.org/literature/topics/customer-journey-map