
Last Updated August 6, 2026
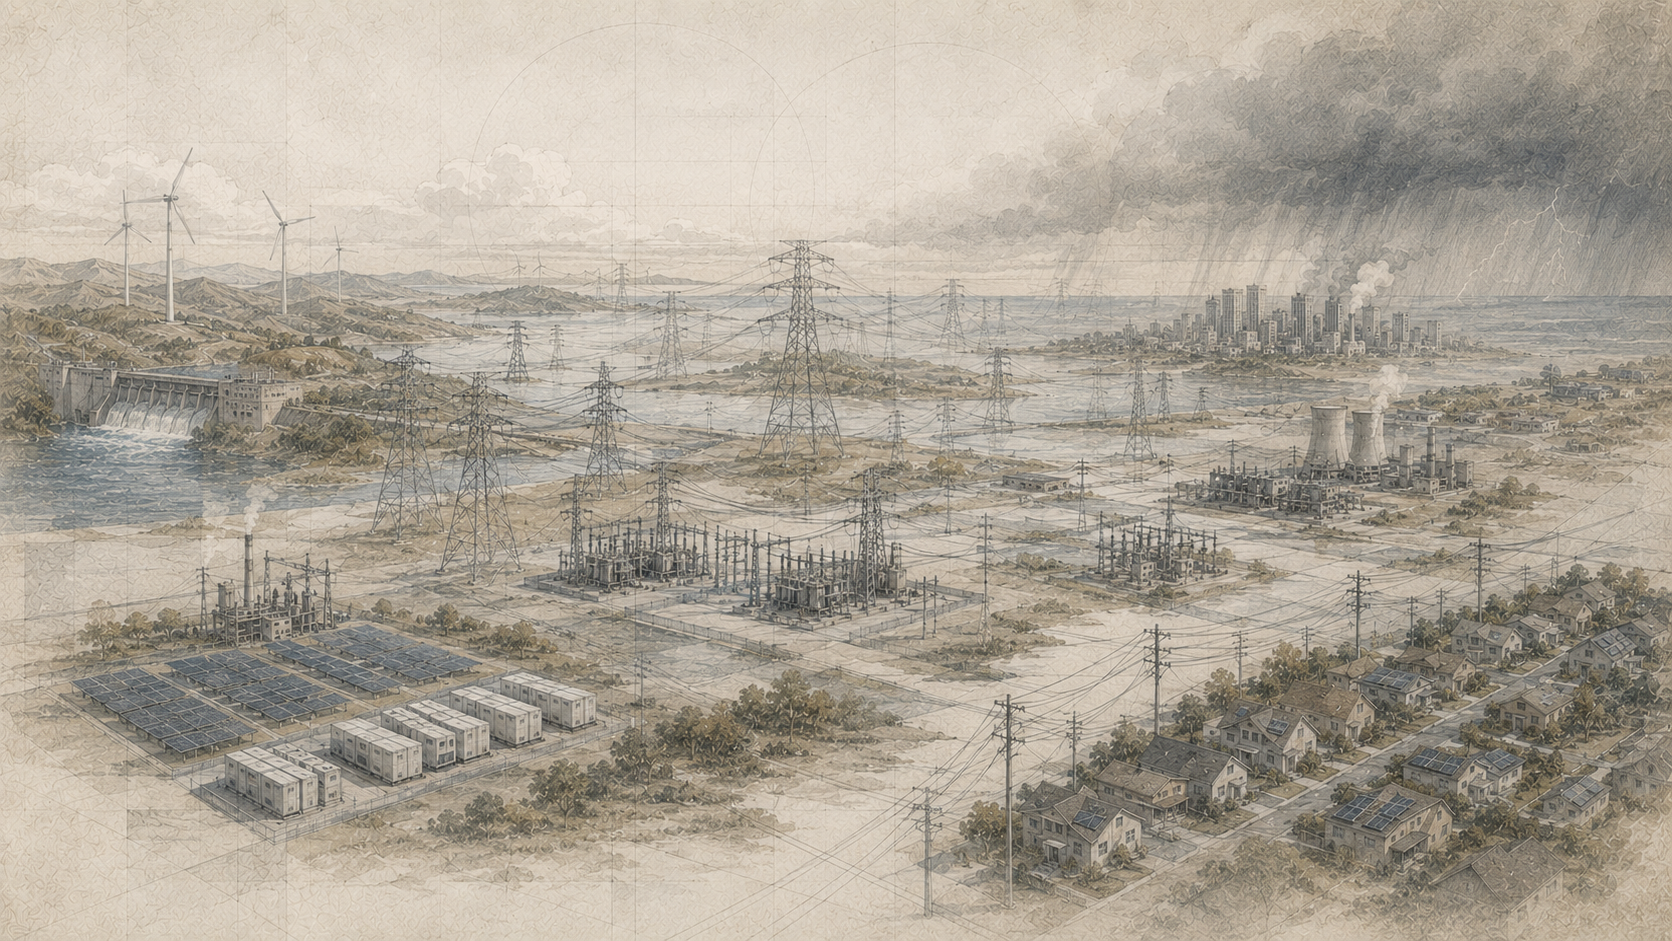
Electricity systems are expected to work almost continuously. Lights, refrigeration, communications, hospitals, water systems, transit, data centers, industrial processes, public safety, and household life all depend on reliable power. Yet the grid operates under continual uncertainty: generators trip, transmission lines fail, demand changes unexpectedly, storms damage infrastructure, fuel supplies are disrupted, equipment ages, cyber systems are attacked, and extreme heat or cold can affect both supply and demand at the same time.
Grid reliability is the ability of the power system to provide electricity with acceptable continuity and quality under expected operating conditions. Grid resilience is the ability to anticipate, withstand, adapt to, and recover from high-impact disturbances, including events that may exceed ordinary planning assumptions.
The two concepts overlap, but they are not identical.
A system can be highly reliable in normal operation and still be vulnerable to an extreme event. A system can also experience an outage but recover rapidly because it has strong resilience capabilities. Reliability focuses heavily on the frequency and duration of service interruptions, adequacy of resources, secure operations, and compliance with system limits. Resilience focuses more strongly on disruption, adaptation, restoration, flexibility, redundancy, and recovery.
Modern grid planning needs both.
Reliability and Resilience Are Different
Reliability and resilience are often used interchangeably, but they answer different questions.
Reliability asks whether the system can provide service consistently under expected conditions. It includes resource adequacy, operating security, equipment performance, and interruption frequency and duration.
Resilience asks how the system behaves when conditions become unusually severe. It includes preparation, absorption of shock, adaptation during disruption, restoration, and learning afterward.
A useful distinction is:
| Reliability | Resilience |
|---|---|
| Routine and expected disturbances | High-impact and potentially exceptional disturbances |
| Frequency and duration of outages | Ability to withstand, adapt, and recover |
| Resource adequacy | Continuity of critical functions |
| Contingency security | Damage limitation and restoration |
| Operational standards | Adaptive capacity under stress |
| Historical performance metrics | Scenario, vulnerability, and consequence analysis |
The distinction matters because a grid can score well on average reliability while remaining exposed to rare but catastrophic events.
Dimensions of Grid Reliability
Grid reliability can be divided into several overlapping dimensions.
Adequacy asks whether enough generation, storage, transmission, and demand-side capability exist to serve expected demand.
Security asks whether the system can withstand credible disturbances without uncontrolled cascading failure.
Continuity describes how often customers lose service and how long interruptions last.
Power quality addresses voltage, frequency, waveform, and disturbance conditions that affect equipment even when service is not completely interrupted.
Restorability concerns the ability to return equipment and customers to service after failure.
No single metric captures all of these dimensions. A utility may have excellent generation adequacy but poor local distribution reliability. A region may have sufficient installed capacity but inadequate transmission to deliver it. A system may have strong annual reliability statistics but weak restoration capability after a major storm.
Reliability must therefore be assessed across the full delivery chain.
Resource Adequacy
Resource adequacy asks whether enough dependable capacity exists to meet electricity demand while accounting for outages, weather, variability, maintenance, and uncertainty.
Installed capacity alone is not enough.
A 1,000 MW power plant cannot be assumed to provide 1,000 MW at every moment. It may be unavailable for maintenance, experience forced outages, face fuel constraints, or operate below nameplate capability because of temperature or hydrological conditions.
Variable renewable resources are also evaluated based on how much they contribute during periods of system risk, not merely nameplate capacity.
A simplified adequacy balance is:
C_{\mathrm{available}} + I + D + S \geq L_{\mathrm{peak}} + R
\]
Available capacity, imports, demand response, and storage must be sufficient to serve peak load plus an appropriate reliability requirement.
The challenge is that each term is uncertain.
Adequacy analysis therefore increasingly uses probabilistic rather than purely deterministic methods.
Operating Reliability and Security
A system can have enough capacity for the season and still fail operationally.
Operating reliability requires the grid to stay within acceptable limits in real time. System operators monitor:
- frequency;
- voltage;
- line and transformer loading;
- generator status;
- available reserves;
- interchange schedules;
- weather;
- fuel constraints;
- equipment outages;
- contingency conditions.
A secure operating state can withstand defined disturbances without violating critical limits.
Security is dynamic. A transmission outage, rising load, or generator trip can move the system from secure to insecure within minutes or seconds.
Operators therefore continuously reassess contingency exposure.
Contingencies and the N-1 Principle
A contingency is the unexpected loss or failure of a grid component.
Examples include:
- a generator trip;
- a transmission-line outage;
- a transformer failure;
- a bus fault;
- a major load loss;
- a communication failure.
A common planning concept is N-1 security: the system should remain within acceptable operating limits after the loss of any single credible component.
If the system has \(N\) important components, it should tolerate the loss of one without uncontrolled consequences.
This does not mean every customer remains unaffected under every event. It means the system is planned so that a single credible failure does not trigger instability or cascading collapse.
More severe events may involve N-1-1, multiple contingencies, common-mode failures, or extreme scenarios that go beyond ordinary design criteria.
Reserve Margin
A simple resource-adequacy indicator is reserve margin:
\mathrm{Reserve\ Margin}
=
\frac{C_{\mathrm{available}}-L_{\mathrm{peak}}}
{L_{\mathrm{peak}}}
\]
If available capacity is 35,000 MW and expected peak demand is 30,000 MW:
\mathrm{Reserve\ Margin}
=
\frac{35000-30000}{30000}
=
0.1667
=
16.7\%
\]
Reserve margin is intuitive but incomplete.
Two systems can have the same reserve margin and different reliability because their resource outage rates, weather exposure, import dependence, storage duration, renewable profiles, fuel constraints, and demand uncertainty differ.
Reserve margin should therefore be treated as a screening indicator, not a complete adequacy model.
Probabilistic Adequacy Metrics
Probabilistic resource-adequacy methods account explicitly for uncertainty.
Common metrics include:
- LOLP — Loss of Load Probability: probability that available resources are insufficient in a given period.
- LOLE — Loss of Load Expectation: expected number of periods in which demand exceeds available supply.
- LOLH — Loss of Load Hours: expected hours of shortfall.
- EUE — Expected Unserved Energy: expected quantity of demand that cannot be served.
A simple expected-unserved-energy formulation is:
\mathrm{EUE}
=
\sum_t
\Pr(S_t < L_t)
\,
\mathbb{E}\left[L_t-S_t \mid S_t < L_t\right]
\Delta t
\]
where \(S_t\) is available supply and \(L_t\) is load.
Probabilistic metrics are especially useful when many uncertain resources interact. They can represent generator outages, correlated weather, storage state of charge, imports, demand response, and renewable availability.
Distribution Reliability Metrics
Most customer interruptions occur on distribution systems rather than bulk transmission networks.
Distribution reliability is affected by:
- overhead line exposure;
- vegetation;
- animals;
- vehicle collisions;
- lightning;
- ice;
- wind;
- equipment age;
- protection coordination;
- automation;
- crew availability;
- spare equipment;
- network topology.
Utilities often use standardized interruption indices to describe average customer experience.
These indices are useful for benchmarking, but averages can hide large differences between neighborhoods, circuits, and customer classes.
SAIDI, SAIFI, and CAIDI
Three widely used reliability indicators are SAIDI, SAIFI, and CAIDI.
SAIDI, the System Average Interruption Duration Index, measures average interruption duration per customer:
\mathrm{SAIDI}
=
\frac{\sum_i U_i N_i}
{N_T}
\]
where \(U_i\) is outage duration, \(N_i\) is customers affected, and \(N_T\) is total customers served.
SAIFI, the System Average Interruption Frequency Index, measures average sustained interruption frequency:
\mathrm{SAIFI}
=
\frac{\sum_i N_i}
{N_T}
\]
CAIDI, the Customer Average Interruption Duration Index, measures average restoration time for customers who experience an interruption:
\mathrm{CAIDI}
=
\frac{\mathrm{SAIDI}}
{\mathrm{SAIFI}}
\]
These metrics are helpful but should be interpreted carefully. A systemwide average may conceal persistent poor performance on specific feeders.
Momentary Interruptions and Power Quality
Not all reliability events are sustained outages.
Momentary interruptions may last only seconds but can disrupt sensitive equipment, manufacturing lines, computers, and digital systems. Voltage sags, swells, harmonics, and frequency excursions can also create economic consequences without a complete loss of service.
Modern loads may be more sensitive to power quality even as grid automation improves outage restoration.
This is especially important for:
- semiconductor manufacturing;
- data centers;
- medical facilities;
- industrial automation;
- telecommunications;
- laboratories.
Reliability evaluation should therefore match the service requirements of the customer.
Operating Reserves
Operating reserves provide capacity that can respond when actual conditions differ from schedules.
Reserve categories may include:
- frequency response;
- regulation;
- spinning reserve;
- non-spinning reserve;
- replacement reserve;
- ramping capability.
A system with insufficient reserve may be unable to respond to a large generator trip or unexpected load increase.
The amount and type of reserve needed depends on the size of credible contingencies, forecast uncertainty, system inertia, resource mix, transmission constraints, and response speed.
Fast-acting batteries, responsive loads, hydroelectric units, thermal plants, and inverter-based resources can all provide some reserve services when technically configured and available.
Frequency Stability
Grid frequency reflects the balance between electrical demand and active-power supply.
A sudden generator loss creates a deficit. Frequency begins to fall until physical and control responses arrest the decline.
A simplified steady response can be represented as:
\Delta f
\approx
-\frac{\Delta P}
{\beta}
\]
The frequency deviation depends on the size of the power imbalance and the aggregate frequency-response characteristic \(\beta\).
Real frequency behavior is dynamic. Inertia influences the initial rate of change, governors and fast frequency response act after the event, and slower reserves restore balance.
Reliability requires the frequency trajectory to remain within acceptable limits while reserves recover the system.
Voltage Stability
Voltage reliability depends on reactive power, network impedance, load characteristics, and equipment controls.
A system can have adequate active-power generation but still face voltage problems if reactive support is insufficient or transmission paths are heavily loaded.
Voltage stability concerns the ability to maintain acceptable voltages following disturbances.
Tools include:
- generator excitation systems;
- capacitor banks;
- reactors;
- synchronous condensers;
- STATCOMs;
- transformer tap changers;
- inverter reactive-power control.
Voltage collapse is a system-level phenomenon and can occur even when total generation capacity appears sufficient.
Transmission Security and Congestion
Transmission reliability depends on network topology as well as total capacity.
If power cannot reach load because a line is overloaded or unavailable, generation elsewhere may not prevent local scarcity.
Security analysis therefore evaluates line and transformer flows under normal and contingency conditions.
A line that operates at 80 percent of its rating in normal conditions may exceed its limit after a nearby line trips because power redistributes through the network.
This is why grid planning often considers contingency flows rather than only base-case utilization.
Transmission redundancy can improve reliability, but redundancy is not free. It requires additional corridors, equipment, maintenance, land, and capital.
Common-Mode and Correlated Failures
Reliability models often assume failures are statistically independent. Extreme events can violate that assumption.
A hurricane may damage many lines simultaneously. Extreme cold can affect generators, gas infrastructure, and load at the same time. Drought can reduce several hydroelectric resources across a region. Wildfire can threaten multiple transmission corridors. Cyber compromise can affect many digital systems with a common vulnerability.
These are correlated failures.
A common-mode failure occurs when multiple components fail because they share a cause.
Examples include:
- equipment from the same defective production batch;
- multiple substations exposed to the same floodplain;
- generators dependent on one pipeline;
- control systems using the same vulnerable software;
- transmission lines sharing one corridor.
Resilience analysis must therefore look beyond independent component failure rates.
Extreme Weather and Climate Stress
Weather is one of the largest drivers of electricity-system disruption.
Extreme heat can:
- increase cooling demand;
- reduce thermal-plant efficiency;
- reduce transmission capacity;
- stress transformers;
- increase wildfire risk.
Extreme cold can:
- increase heating demand;
- freeze equipment;
- constrain fuel supply;
- reduce generator availability;
- create simultaneous infrastructure stress.
Storms can damage poles, substations, transmission lines, vegetation, communications, and roads needed by repair crews.
Climate adaptation requires reliability planning to consider how the frequency, severity, and spatial correlation of extreme events may change over asset lifetimes.
Fuel Supply and Energy Security
A generator is reliable only if its energy source is available.
Fuel-security considerations include:
- pipeline capacity;
- on-site fuel inventories;
- rail and marine logistics;
- gas-electric coordination;
- fuel quality;
- hydrological conditions;
- reservoir inventory;
- weather-dependent renewable availability;
- uranium and fuel-cycle logistics;
- storage duration.
Fuel diversity can reduce exposure to one type of disruption, but diversity alone does not guarantee resilience. Multiple resources may still share transmission, cooling water, communications, or weather exposure.
Reliability analysis should examine the full dependency chain.
Cyber-Physical Reliability
Modern power systems depend on digital control.
Supervisory control and data acquisition, energy management systems, protection relays, advanced meters, inverter controls, communications networks, and market platforms all increase observability and flexibility.
They also create cyber-physical dependencies.
A cyber event can affect physical grid operations by:
- disrupting visibility;
- altering control commands;
- blocking operator access;
- corrupting data;
- disabling communications;
- compromising distributed devices.
Resilience therefore includes segmentation, authentication, monitoring, manual fallback, backup communications, secure recovery, and tested incident response.
Digitalization can improve reliability only when cyber resilience is designed alongside functionality.
The Resilience Cycle
Resilience is often better understood as a cycle than a single score.
The cycle includes:
- Anticipate. Identify hazards, vulnerabilities, critical dependencies, and plausible extreme scenarios.
- Prepare. Harden systems, pre-position resources, train personnel, maintain spares, and coordinate plans.
- Withstand. Limit the scale of service loss when disruption occurs.
- Adapt. Reconfigure networks, island microgrids, reroute power, change operating procedures, and prioritize critical loads.
- Restore. Return generation, transmission, substations, feeders, communications, and customers to service.
- Learn. Update standards, investment, procedures, and risk models based on the event.
Resilience is therefore organizational as well as technical.
Hardening and Redundancy
Grid hardening reduces the probability that infrastructure fails under stress.
Measures can include:
- stronger poles;
- flood barriers;
- elevated substations;
- fire-resistant equipment;
- vegetation management;
- ice-resistant design;
- improved lightning protection;
- weatherization;
- enhanced cooling;
- physical security.
Redundancy provides alternate paths or backup resources.
Examples include parallel lines, looped distribution feeders, spare transformers, multiple communications paths, backup generation, diverse fuel sources, and redundant control centers.
Hardening reduces failure probability. Redundancy reduces consequence when failure occurs.
The two strategies complement each other.
Undergrounding and Infrastructure Tradeoffs
Underground distribution can reduce exposure to wind, falling trees, ice, and some wildfire risks.
But undergrounding has tradeoffs:
- higher construction cost;
- longer repair time when faults occur;
- flood exposure;
- thermal constraints;
- complex locating and excavation;
- difficulty retrofitting dense existing systems.
The reliability value of undergrounding is therefore location-specific.
Selective undergrounding of high-risk or high-value circuits may be more effective than universal conversion.
Systems planning should compare lifecycle risk reduction rather than assuming one design is always superior.
Distributed Energy, Microgrids, and Islanding
Distributed energy resources can support resilience when they are designed to operate during grid disturbances.
Solar panels alone do not necessarily provide backup power. Most grid-connected systems disconnect during outages unless paired with appropriate inverter controls, storage, islanding equipment, and protection.
A resilient microgrid may combine:
- solar;
- batteries;
- dispatchable generation;
- critical-load controls;
- islanding protection;
- local communications;
- black-start capability.
Microgrids can preserve service at hospitals, shelters, campuses, military facilities, water plants, and community resilience hubs.
Their value depends on duration. A battery sized for four hours may not sustain a critical facility through a multi-day outage without additional generation or load management.
Black Start and System Restoration
After a widespread blackout, the grid cannot always restart as if power were already available.
Many generators require external electricity for pumps, controls, fans, fuel systems, or excitation. Black-start resources can start without relying on an energized transmission system.
Restoration may proceed by:
- starting black-start units;
- energizing selected transmission paths;
- starting additional generators;
- forming stable electrical islands;
- reconnecting islands;
- restoring load gradually.
Restoration must manage frequency, voltage, synchronization, cold-load pickup, protection, and communication.
A resilient system therefore needs restoration capability before the blackout occurs.
Critical Loads and Prioritized Restoration
Not all loads have equal consequences when interrupted.
Critical loads can include:
- hospitals;
- emergency communications;
- water and wastewater systems;
- emergency shelters;
- fuel terminals;
- traffic control;
- public safety facilities;
- data centers supporting essential services;
- food and medicine refrigeration.
Resilience planning should identify dependencies among these facilities.
A hospital with backup generation may still depend on fuel delivery, water, telecommunications, staffing, and transportation. A water plant may have backup power but rely on remote pumps that do not.
Critical-load planning should therefore map service chains rather than individual buildings.
Climate Adaptation
Grid assets are long-lived. Transmission lines, substations, transformers, dams, power plants, and underground cables may remain in service for decades.
Climate adaptation asks whether design assumptions remain appropriate throughout asset life.
Adaptation strategies can include:
- updated temperature ratings;
- revised flood elevations;
- storm-hardening standards;
- wildfire mitigation;
- vegetation management;
- cooling-system redesign;
- hydrological scenario analysis;
- higher-temperature equipment;
- relocation of vulnerable facilities;
- regional resource diversification.
The objective is not to predict one exact future climate. It is to ensure infrastructure remains functional across a credible range of future conditions.
Risk, Consequence, and Vulnerability
A practical resilience framework separates hazard, exposure, vulnerability, and consequence.
A simplified risk expression is:
\mathrm{Risk}
\approx
\mathrm{Probability}
\times
\mathrm{Consequence}
\]
For infrastructure planning, a richer representation may be:
R
=
f(H,E,V,C)
\]
where:
- \(H\) = hazard intensity and probability;
- \(E\) = exposure of assets and populations;
- \(V\) = vulnerability to damage or service loss;
- \(C\) = consequence if the system fails.
This structure helps distinguish between strengthening an asset, moving it out of harm’s way, adding redundancy, or reducing consequences through backup service.
The best resilience investment is not always the strongest physical asset. It may be the intervention that most effectively reduces overall risk.
Worked Examples
Example 1: Reserve Margin
A system has 42,000 MW of dependable capacity and expects a 36,000 MW peak.
RM
=
\frac{42000-36000}{36000}
=
0.1667
=
16.7\%
\]
The result indicates a 16.7 percent deterministic reserve margin. It does not yet account for correlated outages or weather-dependent availability.
Example 2: SAIDI
A utility serves 100,000 customers.
Three sustained outages occur:
- 10,000 customers for 2 hours;
- 5,000 customers for 4 hours;
- 20,000 customers for 1 hour.
Customer interruption-hours are:
(10000)(2)+(5000)(4)+(20000)(1)=60000
\]
SAIDI is:
\mathrm{SAIDI}
=
\frac{60000}{100000}
=
0.6\ \mathrm{hours/customer}
\]
or 36 minutes per customer.
Example 3: SAIFI and CAIDI
The same outages affect 35,000 customer-interruption events.
\mathrm{SAIFI}
=
\frac{35000}{100000}
=
0.35
\]
CAIDI is:
\mathrm{CAIDI}
=
\frac{0.6}{0.35}
=
1.714\ \mathrm{hours}
\]
The average sustained interruption lasts about 103 minutes for an affected customer.
Example 4: Frequency Response
A 600 MW generator trips. Aggregate frequency response is 10,000 MW/Hz.
\Delta f
=
-\frac{600}{10000}
=
-0.06\ \mathrm{Hz}
\]
This simplified value represents an indicative equilibrium response, not the transient frequency nadir.
Example 5: Resilience Investment
A substation has a 2 percent annual probability of severe flood damage. The expected economic and public-service consequence is estimated at $80 million.
Simplified annualized risk is:
R=0.02\times 80\ \mathrm{million}
=
1.6\ \mathrm{million/year}
\]
A resilience project should be evaluated against the amount of risk it actually reduces, not merely its construction cost.
Common Misconceptions
Misconception 1: Reliability and resilience are the same.
Reliability focuses heavily on expected operating performance. Resilience focuses on the ability to withstand and recover from severe disruption.
Misconception 2: More installed capacity automatically means a reliable grid.
Capacity must be available, deliverable, fuel-secure, and sufficient under the conditions that create system risk.
Misconception 3: A high reserve margin guarantees adequacy.
Reserve margin does not capture outage probabilities, storage duration, correlated weather, transmission constraints, or import risk.
Misconception 4: Underground lines never fail.
Underground systems can be affected by flooding, excavation, insulation failure, and long repair times.
Misconception 5: Solar panels automatically provide outage backup.
Most require storage, appropriate inverter controls, islanding, and protection to operate independently.
Misconception 6: Resilience means eliminating all outages.
Some events cannot be prevented economically. Resilience includes limiting consequences and restoring service quickly.
Misconception 7: Average reliability metrics describe every customer’s experience.
System averages can conceal persistent geographic and socioeconomic disparities.
Python Workflow: Reliability and Resilience Metrics
A reproducible reliability workflow can calculate standard outage metrics and scenario-based risk.
from dataclasses import dataclass

@dataclass
class Outage:
    customers_affected: int
    duration_hours: float

def saidi(outages, total_customers):
    customer_hours = sum(
        o.customers_affected * o.duration_hours
        for o in outages
    )
    return customer_hours / total_customers

def saifi(outages, total_customers):
    customer_interruptions = sum(
        o.customers_affected
        for o in outages
    )
    return customer_interruptions / total_customers

def caidi(outages, total_customers):
    frequency = saifi(outages, total_customers)
    if frequency == 0:
        return 0.0
    return saidi(outages, total_customers) / frequency

events = [
    Outage(10_000, 2.0),
    Outage(5_000, 4.0),
    Outage(20_000, 1.0),
]

customers = 100_000

print("SAIDI:", saidi(events, customers))
print("SAIFI:", saifi(events, customers))
print("CAIDI:", caidi(events, customers))
A more advanced workflow can add:
- weather categories;
- circuit-level performance;
- critical customers;
- major-event-day treatment;
- restoration curves;
- asset failure probabilities;
- correlated outage scenarios;
- expected unserved energy;
- resilience investment benefits.
The most important modeling decision is to define which events and customers are included.
R Workflow: Outage and Scenario Analysis
R can compare reliability performance across feeders or scenarios.
feeders <- data.frame(
  feeder = c("A", "B", "C", "D"),
  customers = c(12000, 8000, 15000, 10000),
  customer_interruptions = c(2400, 3200, 1800, 2500),
  customer_hours = c(3600, 7200, 2100, 5000)
)

feeders$saifi <-
  feeders$customer_interruptions /
  feeders$customers

feeders$saidi <-
  feeders$customer_hours /
  feeders$customers

feeders$caidi <-
  feeders$saidi /
  feeders$saifi

print(feeders)
This type of feeder-level analysis can reveal reliability disparities hidden by a systemwide average.
Scenario analysis can also compare:
- baseline conditions;
- vegetation-management improvements;
- selective undergrounding;
- automated switching;
- microgrid support;
- flood hardening;
- higher spare-transformer inventory.
GitHub Repository
Complete Code Repository
The full Energy Systems repository contains reproducible article workflows, reliability metrics, outage analysis, resource-adequacy examples, resilience scenarios, restoration models, uncertainty methods, datasets, documentation, and multi-language computational assets.
A Practical Reliability and Resilience Assessment Method
A rigorous grid reliability and resilience assessment can follow a repeatable sequence:
- Define the service objective. Identify which customers, regions, facilities, and time periods matter.
- Separate reliability from resilience. Distinguish routine performance from extreme-event capability.
- Map the system. Include generation, fuel, transmission, substations, distribution, communications, and critical loads.
- Measure historical reliability. Calculate interruption frequency, duration, restoration, and power-quality indicators.
- Assess adequacy. Compare dependable resources with demand under uncertainty.
- Test contingencies. Evaluate credible generator, line, transformer, and communication failures.
- Identify common-mode risks. Look for shared corridors, fuels, software, floodplains, weather exposure, and supply chains.
- Map extreme hazards. Include heat, cold, flood, wildfire, wind, ice, drought, cyber events, and fuel disruption.
- Identify critical dependencies. Map water, telecommunications, transportation, emergency services, and fuel logistics.
- Model restoration. Estimate repair, switching, black-start, crew, and spare-equipment requirements.
- Evaluate resilience options. Compare hardening, redundancy, storage, microgrids, undergrounding, automation, and operational changes.
- Quantify consequences. Include unserved energy, economic loss, public health, critical-service interruption, and community exposure.
- Test uncertainty. Vary hazard frequency, equipment failure, restoration time, demand, and resource availability.
- Prioritize investments. Select interventions based on risk reduction and public value rather than one metric alone.
The strongest assessment connects historical performance with forward-looking scenario analysis.
Policy, Equity, and Public Value
Reliability is not distributed evenly.
Some communities experience more frequent outages, longer restoration times, older infrastructure, greater heat exposure, fewer backup options, and higher energy burdens.
A systemwide reliability average can therefore hide unequal service.
Equity analysis should ask:
- Which neighborhoods experience the highest SAIDI and SAIFI?
- Where are medically vulnerable customers concentrated?
- Which communities face simultaneous flood, heat, wildfire, or storm risk?
- Who can afford private backup generation or batteries?
- Where are resilience hubs or public shelters located?
- Which feeders serve essential public facilities?
- How are hardening costs allocated?
- Who benefits from resilience investment?
Reliability is a technical performance measure, but resilience is also a question of public service.
Limits, Uncertainty, and Responsible Interpretation
Reliability metrics simplify complex system behavior.
SAIDI and SAIFI summarize customer interruptions but do not describe voltage quality, critical-load consequences, or geographic disparity. Reserve margin does not measure probabilistic adequacy. LOLE does not describe the magnitude of every shortfall. Historical outage data may not represent future climate or infrastructure conditions.
Resilience is even harder to compress into one number.
Major uncertainties include:
- future load growth;
- weather extremes;
- climate trends;
- generator outage rates;
- fuel availability;
- storage duration;
- transmission expansion;
- cyber threats;
- restoration time;
- spare-equipment availability;
- workforce constraints;
- customer behavior.
Responsible analysis should report multiple metrics, document assumptions, test correlated failures, and distinguish observed reliability from modeled future resilience.
The goal is not to promise that failure will never occur. It is to build systems that fail less often, fail more safely, preserve essential service, and recover faster.
Reliable Under Normal Conditions, Resilient Under Stress
Grid reliability and resilience describe two complementary requirements of modern electricity systems.
Reliability ensures that enough resources exist, operating conditions remain secure, equipment performs within limits, and customer interruptions are acceptably infrequent and short. Resilience extends the analysis to severe disturbances: extreme weather, correlated failures, cyber events, fuel disruption, infrastructure damage, and cascading impacts across critical services.
A reliable grid is not defined only by installed capacity. Resources must be dependable, deliverable, fuel-secure, and available when risk is highest. Transmission and distribution must remain within physical limits. Operators need reserves, situational awareness, protection, and contingency capability. Utilities need maintenance, automation, crews, spare equipment, and restoration plans.
A resilient grid goes further. It anticipates hazards, reduces vulnerability, protects critical loads, limits damage, adapts during disruption, restores service, and learns after events.
The central lesson is that reliability should be measured under normal conditions and tested under stress.
The next article, Transmission and Distribution Systems, examines the infrastructure that physically carries electricity from bulk generation through high-voltage networks, substations, feeders, transformers, and local distribution systems.
Related Articles
- Energy Systems Thinking
- Electricity Grids
- Transmission and Distribution Systems
- Smart Grids
- Microgrids and Distributed Energy Systems
- Power-System Operations and Dispatch
Further Reading
- North American Electric Reliability Corporation. Reliability standards, assessments, and bulk power system reliability reports.
- U.S. Department of Energy. Grid resilience, emergency response, transmission, and infrastructure modernization resources.
- National Renewable Energy Laboratory. Power-system reliability, resilience, storage, and grid-integration research.
- Lawrence Berkeley National Laboratory. Electricity reliability, outage cost, resilience, and distribution-system research.
- Institute of Electrical and Electronics Engineers. Distribution reliability and power-quality standards and guidance.
- Federal Energy Regulatory Commission. Bulk-power reliability and transmission oversight resources.
References
- North American Electric Reliability Corporation. Reliability Standards and reliability-assessment resources. Available at: NERC.
- U.S. Department of Energy. Grid resilience and electricity-system resources. Available at: DOE.
- Federal Energy Regulatory Commission. Electric reliability and transmission resources. Available at: FERC.
- National Renewable Energy Laboratory. Grid reliability and resilience research. Available at: NREL.
- Lawrence Berkeley National Laboratory. Electricity reliability and resilience research. Available at: Berkeley Lab.
- IEEE. Distribution reliability and power-quality standards and technical literature. Available at: IEEE.