
Table of Contents
- Abstract
- Prototype Repository
- SDG Alignment
- Why an Arduino Water Quality Monitoring Station Matters
- System Overview
- Bill of Materials
- Engineering Specifications
- System Architecture
- Key Water Quality Indicators
- Wiring the Monitoring Station
- Firmware Design Goals
- Advanced Arduino Code
- Engineering Notes
- Power Management Considerations
- Validation and Testing
- Suggested Performance Metrics
- Applications
- Supporting SDG 6: Clean Water and Sanitation
- Reproducibility
- Conclusion
Abstract
This project presents a prototype Arduino water quality monitoring station built around a microcontroller, a pH sensor, a total dissolved solids (TDS) sensor, and a waterproof temperature sensor. The system reads environmental signals, converts them into interpretable water-quality indicators, and outputs measurements for real-time review or future storage.
From an engineering perspective, the platform demonstrates a compact embedded sensing station for freshwater monitoring. From a sustainability perspective, it illustrates how distributed, low-cost measurement systems can support more transparent water management and earlier detection of environmental deterioration.
Prototype Repository
This project is published as an open prototype so that engineers, researchers, students, and advanced makers can reproduce and extend the design. All firmware, documentation, wiring notes, and example monitoring data are available in the project repository.
GitHub Repository:
Arduino Water Quality Monitoring Station – Source Files and Documentation
The repository contains the complete prototype build materials:
- Arduino monitoring firmware (.ino)
- bill of materials
- setup guide
- calibration notes
- deployment notes
- example water-quality readings
Engineers can clone the repository, fork the design, or download the complete project using GitHub’s Download ZIP feature.
All materials are released under the MIT License to support reuse in research, education, and prototype engineering work.
Repository Structure
arduino-water-quality-monitoring-station/

README.md
LICENSE

BOM.csv

firmware/
  water_quality_monitor.ino

docs/
  setup_guide.md
  calibration.md
  deployment_notes.md

data/
  example_water_quality_readings.csv

hardware/
SDG Alignment
This project connects most directly to SDG 6: Clean Water and Sanitation, which focuses on ensuring access to safe water and improving sustainable water management.
It also relates to:
- SDG 9: Industry, Innovation and Infrastructure — through distributed sensing and environmental instrumentation
- SDG 11: Sustainable Cities and Communities — through stronger local monitoring and public infrastructure awareness
- SDG 14: Life Below Water — because freshwater monitoring influences downstream aquatic systems and watershed health
Water-quality measurement is foundational to environmental governance. Without monitoring, it becomes difficult to detect contamination, understand ecological stress, or evaluate whether interventions are actually improving water systems.
Why an Arduino Water Quality Monitoring Station Matters
Water systems are often managed through large institutions, laboratories, and centralized infrastructure. But measurement can also happen closer to the source. Low-cost monitoring stations make it possible to collect useful data at the edge of the network — near rivers, lakes, wells, farms, or local treatment systems.
A prototype like this demonstrates several important principles:
- environmental systems become easier to manage when they can be measured consistently
- distributed sensing can complement centralized laboratory monitoring
- water quality is not a single variable, but a combination of interacting indicators
- embedded systems can make environmental stewardship more practical and accessible
The platform is not a replacement for certified laboratory analysis. Its value is that it translates the logic of water-quality sensing into a deployable, testable embedded system.
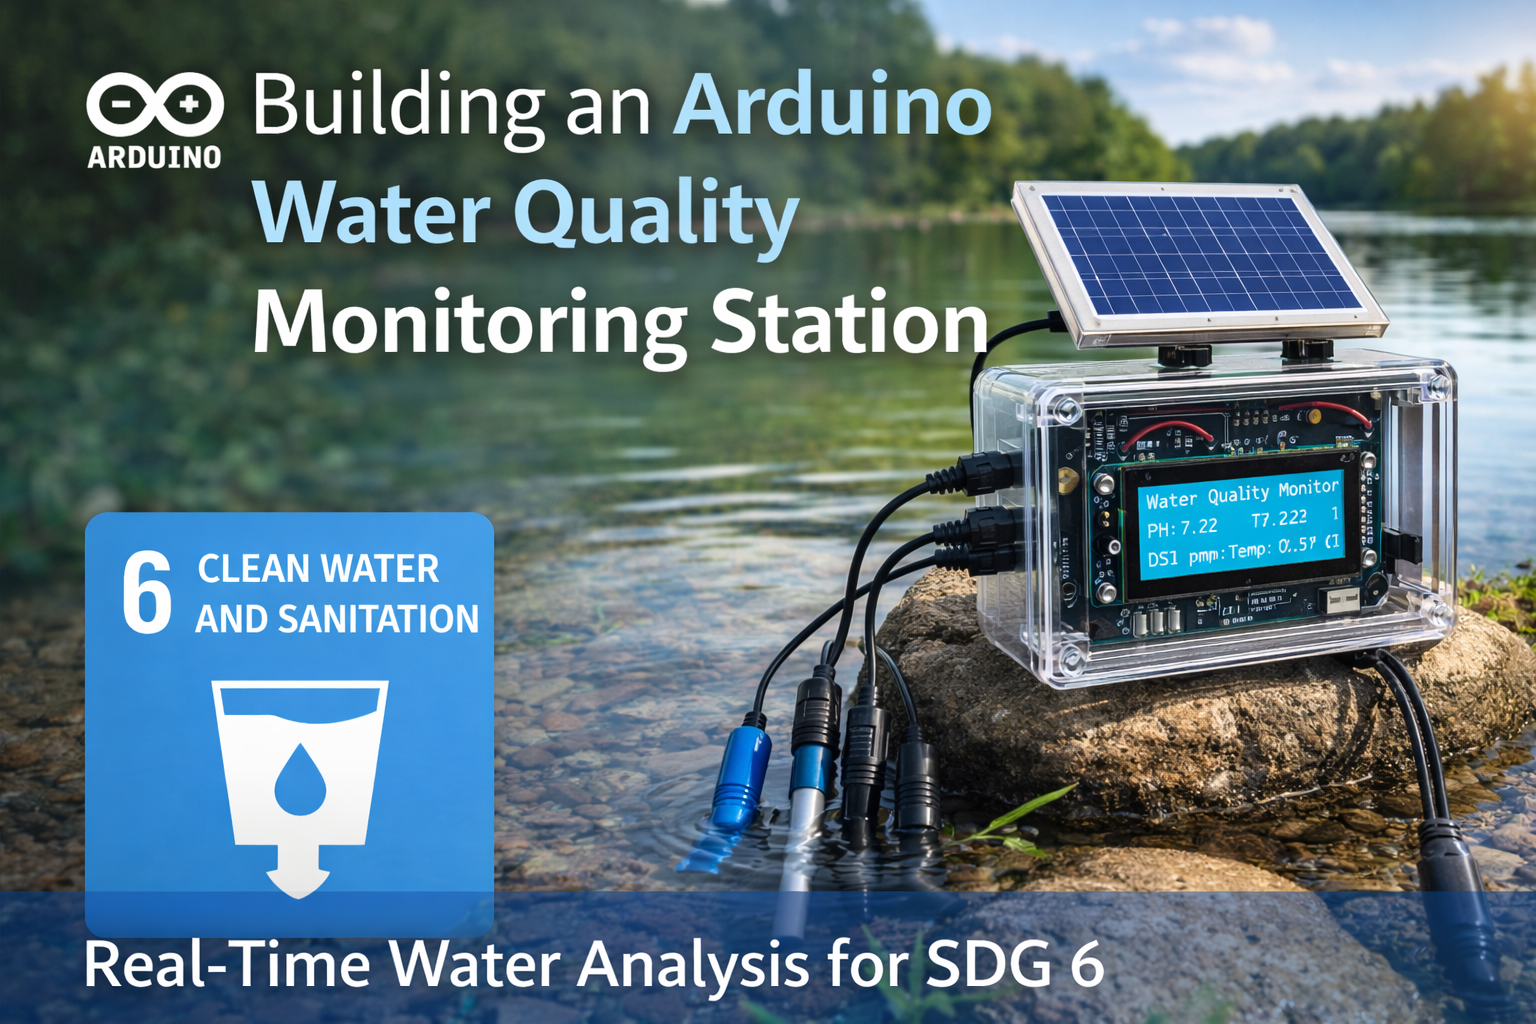
System Overview
The monitoring station uses a combination of sensors to measure water-related conditions and report them through an Arduino-based data pipeline.
The system includes:
- Arduino microcontroller for control and data processing
- analog pH sensor for acidity and alkalinity
- TDS or conductivity-based sensor for dissolved solids
- DS18B20 waterproof temperature sensor
- serial or optional display output for telemetry review
The station continuously samples sensor values, converts them into engineering estimates, and outputs the resulting measurements for observation, logging, or later analysis.
Bill of Materials
- Arduino Uno or Arduino Nano
- analog pH sensor module
- TDS or conductivity sensor
- DS18B20 waterproof temperature sensor
- 4.7k resistor (for the temperature sensor pull-up)
- breadboard
- jumper wires
- power supply (USB or battery)
These components form a compact embedded sensing platform capable of monitoring several important water-quality indicators.
Engineering Specifications
| Parameter | Specification |
|---|---|
| Microcontroller | Arduino Uno (ATmega328P) or equivalent |
| Measured variables | pH, temperature, total dissolved solids (TDS) |
| Temperature sensor | DS18B20 waterproof probe |
| pH interface | Analog voltage output to Arduino ADC |
| TDS interface | Analog voltage output to Arduino ADC |
| Telemetry output | Serial monitor, optional future logging/display layer |
| Power system | USB or battery, optional future solar support |
| Deployment scope | Educational, prototype, and experimental environmental monitoring |
System Architecture
The monitoring station consists of four major functional layers:
- Sensor layer: measures physical and chemical properties of water
- Microcontroller layer: reads sensor values and applies conversion logic
- Data layer: outputs results to the serial monitor or future storage interfaces
- Power layer: provides stable electrical supply for sensing and telemetry
The architecture follows a typical embedded sensing pipeline:
Sensors → Arduino Microcontroller → Data Output
Each sensor produces an electrical signal representing a physical property of the water. The Arduino reads these signals through analog or digital inputs and converts them into calibrated or semi-calibrated measurements.
Key Water Quality Indicators
pH
pH measures the acidity or alkalinity of water on a scale from 0 to 14. Natural freshwater systems typically range between pH 6.5 and 8.5. Deviations from this range can indicate pollution, runoff, biological changes, or chemical imbalance.
Temperature
Water temperature influences dissolved oxygen levels, biological activity, and chemical behavior. Many aquatic organisms are sensitive to temperature fluctuations, making thermal measurement a critical environmental indicator.
Total Dissolved Solids (TDS)
Total dissolved solids represent the concentration of dissolved minerals, salts, and metals in water. High TDS levels may indicate contamination, salinity shifts, runoff, or industrial influence.
Wiring the Monitoring Station
The sensors connect directly to the Arduino using analog and digital input pins.
- pH sensor output → Arduino A0
- TDS sensor output → Arduino A1
- DS18B20 data → Arduino digital pin 2
- All sensor VCC → Arduino 5V
- All sensor GND → Arduino GND
The DS18B20 temperature sensor requires a 4.7k pull-up resistor between the data line and the 5V supply.
In practical deployments, stable grounding and clean wiring matter because water-sensing systems can be sensitive to analog noise, poor reference stability, and sensor-placement variability.
Firmware Design Goals
The firmware in this project is designed to do more than print raw sensor values. It attempts to provide a usable monitoring framework by:
- reading multiple sensors in a repeatable cycle
- converting analog signals into interpretable engineering estimates
- keeping telemetry readable for debugging and observation
- creating a base for future data logging and remote reporting
- illustrating how different water-quality indicators can be measured together in one platform
These goals make the system more useful as a prototype environmental station rather than just a collection of disconnected sensors.
Advanced Arduino Code
The code below provides a compact but useful starting point for temperature, pH, and TDS monitoring using Arduino-compatible sensors.
#include <OneWire.h>
#include <DallasTemperature.h>

#define ONE_WIRE_BUS 2

OneWire oneWire(ONE_WIRE_BUS);
DallasTemperature sensors(&oneWire);

const int phPin = A0;
const int tdsPin = A1;

void setup() {

  Serial.begin(9600);
  sensors.begin();
}

void loop() {

  sensors.requestTemperatures();
  float temperature = sensors.getTempCByIndex(0);
  int phRaw = analogRead(phPin);
  float voltage = phRaw * (5.0 / 1023.0);
  float phValue = 7 + ((2.5 - voltage) / 0.18);

  int tdsRaw = analogRead(tdsPin);
  float tdsVoltage = tdsRaw * (5.0 / 1023.0);
  float tdsValue = (133.42 * tdsVoltage * tdsVoltage * tdsVoltage
                  - 255.86 * tdsVoltage * tdsVoltage
                  + 857.39 * tdsVoltage) * 0.5;

  Serial.print("Temperature: ");
  Serial.print(temperature);
  Serial.println(" C");

  Serial.print("pH: ");
  Serial.println(phValue);

  Serial.print("TDS: ");
  Serial.print(tdsValue);
  Serial.println(" ppm");

  Serial.println("-----------------------");

  delay(2000);
}
Engineering Notes
A few technical points are important in this build:
- Analog interpretation: pH and TDS values are derived from analog voltage, so measurement quality depends on sensor calibration and signal stability.
- Temperature as context: thermal conditions influence water chemistry and can also affect sensor behavior.
- TDS as proxy: TDS readings offer a useful indicator, but they do not identify which specific dissolved substances are present.
- Field variation: water movement, probe placement, and contamination on the sensor surface can all affect readings.
- Calibration dependence: the station is only as useful as the care taken in validating the sensors.
These constraints do not reduce the value of the build. They clarify its role as a prototype environmental monitoring system rather than a laboratory-certified instrument.
Power Management Considerations
Environmental monitoring stations often operate in remote locations where power availability is limited. In practical deployments, systems like this can be paired with:
- solar panels
- lithium battery storage
- low-power microcontrollers
- duty cycling to reduce energy consumption
Reducing measurement frequency and placing the microcontroller into sleep mode between readings can significantly extend battery life. For longer-term field use, energy management becomes an important engineering layer in its own right.
Validation and Testing
To bring this project closer to engineering-grade documentation, validation should include:
- verify that the DS18B20 temperature probe reports stable readings in water
- compare pH readings against a reference solution or calibrated meter
- compare TDS readings against a known solution or reference meter
- observe how measurements change under different water conditions
- repeat measurements over time to evaluate consistency
- check for analog drift, noisy output, or unstable sensor baselines
If results appear inconsistent, the problem may be related to sensor calibration, signal noise, water chemistry variation, or probe condition rather than to the measurement logic alone.
Suggested Performance Metrics
For a more rigorous evaluation, the station can be assessed using a few simple metrics:
- temperature stability: consistency of repeated thermal readings under unchanged conditions
- pH agreement: alignment between the station and a reference pH instrument
- TDS agreement: alignment between the station and a reference TDS instrument
- telemetry repeatability: whether repeated outputs remain interpretable and stable
- sensor drift: whether measurements shift noticeably over time without a real change in the water sample
Even simple tracking of these metrics improves the credibility and usefulness of the prototype.
Applications
Water-monitoring stations like this support a wide range of environmental and engineering applications:
- river and lake monitoring
- agricultural water management
- environmental education programs
- citizen science initiatives
- early detection of contamination events
Distributed monitoring networks can provide continuous environmental data that improves both scientific understanding and policy decision-making.
Supporting SDG 6: Clean Water and Sanitation
The United Nations Sustainable Development Goal 6 focuses on ensuring the availability and sustainable management of water and sanitation for all. Achieving this objective requires not only infrastructure investment but also reliable environmental monitoring systems.
Low-cost embedded technologies allow communities and researchers to build distributed water monitoring networks capable of identifying pollution, measuring ecosystem conditions, and supporting responsible water governance.
Projects like this Arduino water quality monitoring station illustrate how accessible engineering tools can contribute to more transparent and resilient water systems.
Reproducibility
All firmware, documentation, and supporting build materials necessary to reproduce the prototype are included in the project repository. The design intentionally relies on widely available educational and hobbyist hardware so that it can be rebuilt in classrooms, labs, and independent environmental monitoring projects.
The system is intended as a reference implementation rather than a certified analytical instrument. Engineers adapting it for real monitoring deployments should validate sensor calibration, probe maintenance, enclosure design, power stability, and long-term reliability under local environmental conditions.
Conclusion
Building an Arduino water quality monitoring station demonstrates how embedded systems can support environmental stewardship. By integrating sensors for pH, temperature, and dissolved solids, the system provides real-time insight into water conditions and illustrates the core principles used in modern environmental monitoring infrastructure.
While this prototype is relatively simple, the underlying concept is powerful: when environmental conditions can be measured clearly, they can also be managed more effectively. Distributed sensor networks will play an increasingly important role in protecting freshwater resources and advancing sustainable development.