
Last Updated August 6, 2026
Electricity does not move directly from a power plant to a wall outlet. Between generation and end use lies an extensive physical network of conductors, towers, poles, cables, substations, transformers, protection systems, switches, sensors, control equipment, rights-of-way, and interconnections.
Transmission systems move large quantities of electrical power over long distances at high voltage. Distribution systems deliver that power from substations through local feeders and transformers to homes, businesses, industry, transportation, communications, and other end uses.
The distinction is functional rather than absolute. Transmission networks form the high-capacity backbone of interconnected power systems. Distribution networks form the final delivery infrastructure. Between them are substations that transform voltage, switch circuits, protect equipment, measure conditions, and connect different parts of the grid.
These systems determine more than where electricity travels. They influence which generators can connect, how much power can move between regions, where congestion occurs, how losses accumulate, how reliably customers are served, how quickly new demand can be added, and how easily electrification and renewable generation can scale.
A low-cost generator has limited value if transmission cannot deliver its output. A neighborhood can face a capacity constraint even when the regional system has abundant generation. A new data center, factory, solar project, battery, charging depot, or housing development may require substantial network upgrades before it can operate.
Transmission and distribution are therefore not passive wires. They are active constraints on the structure and evolution of energy systems.
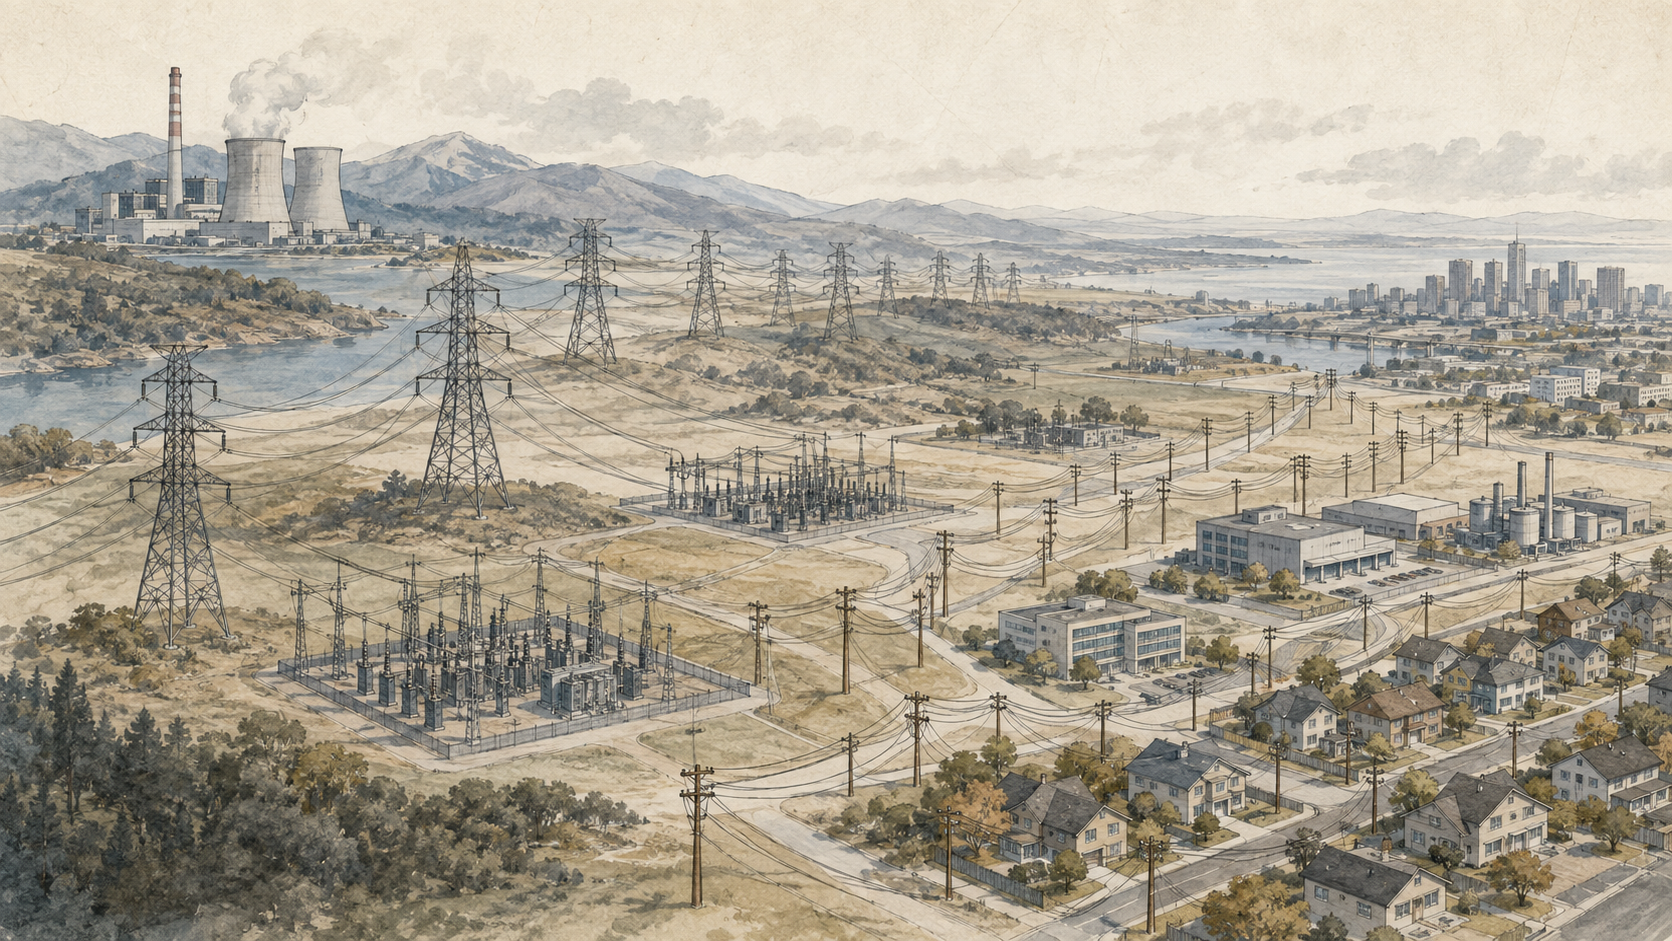
The Grid as a Network Hierarchy
Power systems use multiple voltage levels because the requirements of long-distance transport and local delivery are different.
A simplified path is:
\text{Generation}
\rightarrow
\text{Step-Up Transformer}
\rightarrow
\text{High-Voltage Transmission}
\rightarrow
\text{Substation}
\rightarrow
\text{Distribution Feeder}
\rightarrow
\text{Distribution Transformer}
\rightarrow
\text{Customer}
\]
Large generators commonly connect through transformers that raise voltage for transmission. Regional substations reduce voltage for subtransmission or distribution. Local transformers reduce it again to levels suitable for customer equipment.
This hierarchy allows bulk power to move efficiently while making local service practical.
But the hierarchy is becoming less one-directional. Rooftop solar, community solar, batteries, electric vehicles, flexible loads, and distributed generation can inject or shift power within distribution systems. Power can move from customer-side resources toward substations rather than only from substations toward customers.
The physical network remains hierarchical, but its flows are increasingly bidirectional.
Why Transmission Uses High Voltage
For a given amount of power, increasing voltage reduces current.
For a three-phase system:
P
=
\sqrt{3}\,V I \cos\phi
\]
where \(P\) is real power, \(V\) is line-to-line voltage, \(I\) is current, and \(\cos\phi\) is power factor.
Resistive losses scale approximately with the square of current:
P_{\mathrm{loss}}
=
3I^2R
\]
If current is cut in half, resistive loss falls by roughly a factor of four, assuming resistance is unchanged.
This is the fundamental reason bulk electricity is transmitted at high voltage.
Higher voltage also requires greater insulation, clearances, tower dimensions, substation equipment, protection design, and construction cost. Transmission design therefore balances electrical efficiency against equipment and infrastructure requirements.
Three-Phase Power and AC Networks
Most large power systems use three-phase alternating current.
Three-phase systems provide several advantages:
- efficient use of conductors;
- relatively constant aggregate power transfer;
- compatibility with rotating machines;
- convenient voltage transformation;
- mature protection and control technology.
Transmission engineers analyze the magnitude and phase angle of voltage at network buses. Differences in voltage angle help determine active-power transfer, while voltage magnitude and reactive power are closely connected.
The grid is therefore not simply a network carrying electrons from specific plants to specific customers. It is an interconnected electromagnetic system in which power flow is governed by impedance, voltage, phase angle, and network topology.
Transformers and Voltage Conversion
Transformers make the multi-voltage grid possible.
For an ideal transformer:
\frac{V_1}{V_2}
=
\frac{N_1}{N_2}
\]
where \(V\) is voltage and \(N\) is the number of turns.
Ignoring losses:
V_1 I_1
\approx
V_2 I_2
\]
A transformer can increase voltage while reducing current or reduce voltage while increasing current.
Real transformers experience:
- copper losses;
- core losses;
- leakage reactance;
- thermal limits;
- insulation aging;
- magnetizing current.
Large power transformers are critical infrastructure. They can be expensive, heavy, specialized, and slow to replace. Transformer availability can therefore become a planning and resilience constraint.
Transmission Lines
Transmission lines move bulk electricity between generation, load centers, substations, and neighboring regions.
Common forms include:
- overhead alternating-current lines;
- underground AC cables;
- submarine cables;
- high-voltage direct-current links.
Overhead AC transmission remains common because it is relatively economical over long terrestrial distances and integrates naturally with existing AC networks.
HVDC can be advantageous for:
- very long-distance bulk transfer;
- submarine links;
- connecting asynchronous grids;
- controllable power transfer;
- some congested corridors.
Transmission choice depends on distance, power level, terrain, right-of-way, system topology, converter cost, reliability requirements, and interconnection needs.
Resistance, Reactance, and Capacitance
A transmission line is characterized by electrical parameters distributed along its length.
Resistance causes real-power loss and heating.
Inductive reactance influences voltage drop and active-power transfer.
Capacitance becomes increasingly important for long lines and cables.
A simplified series impedance is:
Z=R+jX
\]
where \(R\) is resistance and \(X\) is reactance.
In high-voltage AC systems, reactance is often more influential than resistance in determining steady-state active-power flow.
Detailed models may represent line shunt capacitance, conductor geometry, transposition, sequence impedances, corona, and frequency-dependent effects.
The appropriate model depends on the planning or operating question.
Thermal Limits and Line Ratings
Conductors heat as current flows through them.
A line rating limits current so conductor temperature, clearance, sag, connectors, and other components remain within acceptable ranges.
Line capability depends on:
- ambient temperature;
- wind speed;
- solar heating;
- conductor type;
- conductor temperature limit;
- clearance requirements;
- terminal equipment;
- contingency duration.
Traditional ratings may use conservative seasonal assumptions. Dynamic line ratings use weather and monitoring data to estimate real-time or near-real-time capability.
A line may sometimes carry more power safely under cool, windy conditions than under hot, still conditions.
Thermal capability is therefore not always a fixed number.
Voltage and Stability Limits
Transmission capacity is not determined only by conductor heating.
Power transfer can also be limited by:
- voltage stability;
- transient stability;
- small-signal stability;
- reactive-power availability;
- contingency performance;
- protection requirements.
A corridor might be thermally capable of carrying more power but still be operated below that level because a disturbance could produce unacceptable voltage or stability consequences.
This is one reason line nameplate or thermal rating cannot be interpreted as guaranteed transfer capability.
The secure limit is a system property.
Power Flow and Network Physics
Power follows electrical impedance and network conditions rather than commercial contract paths.
For a simplified lossless AC line, active-power transfer can be approximated as:
P_{12}
\approx
\frac{V_1V_2}{X}
\sin(\delta_1-\delta_2)
\]
Under the DC power-flow approximation:
P_{12}
\approx
\frac{\theta_1-\theta_2}{X}
\]
in per-unit form.
This means an injection at one location can alter flows on many lines.
When a transmission line trips, power does not simply stop moving between its endpoints. It redistributes across remaining paths. Those paths may become overloaded.
Grid planning therefore requires network analysis rather than simple point-to-point accounting.
Transmission and Distribution Losses
Some electrical energy is lost as heat and through other physical mechanisms before reaching customers.
A basic resistive-loss relationship is:
P_{\mathrm{loss}}
=
I^2R
\]
for a single conductor.
Losses occur in:
- transmission conductors;
- distribution feeders;
- transformers;
- substations;
- connections;
- auxiliary systems.
Distribution losses can be significant because local networks operate at lower voltage and may carry relatively high current.
Losses are nonlinear. A heavily loaded feeder can experience much greater incremental loss than a lightly loaded feeder because loss increases with current squared.
Network planning therefore considers both capacity and loss.
Congestion and Bottlenecks
Congestion occurs when desired power transfers exceed one or more network limits.
The constraint may be caused by:
- line thermal limits;
- transformer limits;
- voltage requirements;
- stability limits;
- contingency requirements;
- outages;
- local distribution capacity.
Congestion can force operators to dispatch a more expensive generator near load instead of a lower-cost generator located behind a constrained interface.
It can also curtail renewable generation.
Congestion is therefore both a physical and economic phenomenon.
Persistent congestion can signal the value of:
- new transmission;
- reconductoring;
- storage;
- demand response;
- generation relocation;
- topology optimization;
- grid-enhancing technologies.
Substations
Substations connect and control network segments.
Their functions can include:
- voltage transformation;
- circuit switching;
- fault isolation;
- measurement;
- protection;
- voltage regulation;
- reactive-power support;
- interconnection of lines and feeders.
A transmission substation may connect multiple high-voltage lines and transformers. A distribution substation typically reduces voltage and feeds several local circuits.
Substation design affects reliability. Bus arrangements can determine whether maintenance or a fault removes one circuit or many.
Substations are also important nodes for digital monitoring and automation.
Switchgear and Protection
Electrical faults must be detected and isolated quickly.
Protection systems use:
- current transformers;
- voltage transformers;
- protective relays;
- circuit breakers;
- reclosers;
- fuses;
- sectionalizers;
- communications-assisted schemes.
Protection attempts to remove the smallest practical portion of the system while preserving service elsewhere.
Coordination is essential. A downstream fault should ideally be cleared by the closest protective device rather than disconnecting an entire substation or transmission corridor.
Distributed generation can complicate traditional protection because fault current and power flow may become bidirectional.
Protection settings must evolve with network topology and resource mix.
Distribution Feeders
Distribution feeders carry power from substations into communities.
A feeder can serve:
- residential neighborhoods;
- commercial districts;
- industrial facilities;
- schools;
- hospitals;
- transportation infrastructure;
- distributed generation;
- electric-vehicle charging.
Feeder capacity depends on conductor size, length, voltage, transformer ratings, protection, voltage drop, and thermal constraints.
Peak demand can occur at different times on different feeders.
A residential feeder may peak on a hot evening. A commercial feeder may peak during business hours. An industrial feeder may have a relatively constant profile.
Local load shape therefore matters for distribution planning.
Radial, Looped, and Meshed Networks
Distribution networks can use different topologies.
Radial networks have one primary path from the substation to a customer. They are simple and economical but can expose customers downstream of a fault.
Looped networks provide alternate paths that can be switched into service.
Meshed networks provide multiple energized paths and are common in dense urban areas or applications with high reliability requirements.
Topology influences:
- cost;
- protection complexity;
- restoration capability;
- fault current;
- automation options;
- reliability.
More interconnection can improve flexibility, but it also requires more sophisticated protection and control.
Distribution Transformers
Distribution transformers reduce feeder voltage to customer utilization voltage.
They may serve:
- one building;
- several homes;
- a commercial facility;
- an industrial load;
- part of a secondary network.
Transformer loading is affected by:
- customer diversity;
- ambient temperature;
- load growth;
- electric-vehicle charging;
- heat pumps;
- rooftop solar;
- battery operation.
Electrification can therefore create localized transformer constraints before a feeder or substation reaches its aggregate limit.
Distribution planning increasingly needs granular load forecasts rather than systemwide averages.
Voltage Regulation
Customer voltage must remain within acceptable ranges.
Voltage can vary because of:
- feeder impedance;
- load level;
- reactive power;
- distributed generation;
- transformer tap position;
- capacitor operation.
Distribution utilities may use:
- load-tap-changing transformers;
- line voltage regulators;
- capacitor banks;
- smart inverter controls;
- advanced distribution management systems.
Traditional feeders were designed for voltage to decline gradually away from the substation.
High distributed solar can alter that pattern. Midday export may raise voltage near the end of a feeder.
This creates a need for more adaptive voltage control.
Phase Balance and Power Quality
Distribution systems often contain many single-phase loads connected across a three-phase network.
Unequal loading can create phase imbalance.
Consequences can include:
- higher neutral current;
- additional losses;
- voltage imbalance;
- motor heating;
- reduced equipment performance.
Utilities manage phase balance by distributing customer connections and sometimes reconfiguring circuits.
Power quality also includes:
- voltage sags;
- swells;
- harmonics;
- flicker;
- momentary interruptions;
- frequency deviations.
As electronic loads and inverter-based resources increase, power-quality monitoring becomes more important.
Overhead and Underground Systems
Both overhead and underground networks have advantages and disadvantages.
| Characteristic | Overhead | Underground |
|---|---|---|
| Initial cost | Generally lower | Generally higher |
| Wind/tree exposure | Higher | Lower |
| Flood exposure | Variable | Potentially significant |
| Fault location | Often easier | Often harder |
| Repair | Often faster | Can require excavation |
| Visual impact | Higher | Lower |
| Thermal behavior | Air cooling | Soil and duct thermal limits |
Undergrounding can improve resilience in some environments but should not be treated as universally superior.
Lifecycle cost and hazard exposure matter.
Distributed Generation and Reverse Power Flow
Traditional distribution systems were designed primarily for one-way power flow from substations to customers.
Distributed generation changes this.
If local solar generation exceeds local demand, net power can flow toward the substation.
Reverse flow can affect:
- voltage regulation;
- protection coordination;
- transformer loading;
- regulator operation;
- feeder thermal limits;
- substation power flow.
The impact depends on location.
Two solar installations with the same capacity can have different network effects depending on feeder impedance, local demand, phase connection, existing generation, and distance from the substation.
Distribution hosting decisions therefore require spatial analysis.
Hosting Capacity
Hosting capacity is the amount of new generation or load that can be connected without causing unacceptable violations under defined assumptions.
Potential limiting factors include:
- thermal loading;
- voltage rise or drop;
- protection;
- fault current;
- power quality;
- transformer capacity;
- reverse flow;
- operational limits.
Hosting capacity is not one permanent number.
It depends on:
- time of day;
- load level;
- generation profile;
- control settings;
- network upgrades;
- storage behavior;
- smart inverter functions.
Flexible interconnection can sometimes increase usable hosting capacity by allowing limited curtailment or active control during rare constrained periods.
Electric Vehicles and New Distribution Loads
Electric vehicles can increase electricity demand without necessarily creating a systemwide generation problem.
The first constraint may appear locally.
A cluster of high-power chargers can stress:
- service transformers;
- distribution transformers;
- feeders;
- substations;
- local voltage.
Charging timing matters.
If charging occurs during the system peak, infrastructure requirements can be larger. Managed charging can shift demand to periods with greater network and generation availability.
Fleet depots create particularly concentrated load.
Electrification planning therefore needs both energy forecasts and location-specific power forecasts.
Data Centers, Industry, and Large Loads
Large new loads can transform transmission and distribution planning.
Data centers, semiconductor facilities, hydrogen production, manufacturing, electrified industrial heat, and transportation hubs may require hundreds of megawatts or more.
These projects can require:
- new substations;
- higher-voltage service;
- new transmission lines;
- transformer procurement;
- reactive-power support;
- redundant feeds;
- network reinforcement.
Lead times for grid infrastructure can be longer than the customer’s desired construction schedule.
This creates a coordination challenge between economic development and network planning.
Large-load interconnection is increasingly a central grid-planning issue.
Asset Management and Maintenance
Transmission and distribution systems are capital-intensive and long-lived.
Asset management includes:
- inspection;
- condition monitoring;
- vegetation management;
- preventive maintenance;
- failure analysis;
- replacement planning;
- spare-equipment strategy;
- risk-based prioritization.
Age alone does not determine condition.
A well-maintained older transformer may remain serviceable while a younger asset exposed to overload, moisture, contamination, or thermal stress may deteriorate faster.
Utilities increasingly combine age, condition, criticality, failure probability, and consequence to prioritize investment.
The objective is not to replace everything old. It is to manage risk.
Expansion Planning
Transmission and distribution expansion planning asks what infrastructure should be built, upgraded, retired, or reconfigured to meet future needs.
Drivers include:
- load growth;
- generator interconnection;
- renewable development;
- electrification;
- reliability requirements;
- aging assets;
- congestion;
- resilience;
- economic development;
- policy targets.
Planning is difficult because assets are long-lived while future conditions are uncertain.
A line built today may shape power flows for half a century.
Good planning therefore compares multiple futures rather than optimizing one forecast.
Potential investments should be evaluated not only for base-case demand but also for flexibility under alternative generation, load, climate, and technology pathways.
Rights-of-Way, Siting, and Permitting
Transmission expansion is not solely an engineering problem.
New lines require:
- rights-of-way;
- land acquisition;
- environmental review;
- community engagement;
- permitting;
- coordination across jurisdictions;
- cost allocation;
- construction access.
Siting can become the dominant project constraint.
A technically optimal route may be socially, environmentally, or politically unacceptable.
Projects also create uneven benefits and burdens. A transmission line may provide regional reliability or enable distant renewable generation while crossing communities that receive limited direct benefit.
Planning legitimacy therefore matters to project viability.
Grid-Enhancing Technologies
Some transmission capability can be increased without constructing an entirely new corridor.
Grid-enhancing technologies can include:
- dynamic line ratings;
- advanced power-flow control;
- topology optimization;
- high-performance conductors;
- advanced monitoring;
- optimized dispatch coordination.
These technologies can increase utilization of existing infrastructure or reduce congestion.
They do not eliminate the need for new transmission where underlying transfer needs are large.
Their value is highest when the limiting mechanism can actually be changed by the technology.
A thermally constrained line may benefit from reconductoring or dynamic ratings. A voltage-constrained corridor may require reactive support. A stability constraint may require a different solution.
The constraint must be diagnosed before the remedy is selected.
Worked Examples
Example 1: High Voltage Reduces Current
Suppose 500 MW is transferred at unity power factor through a three-phase line.
At 115 kV:
I
=
\frac{500\times10^6}
{\sqrt{3}(115\times10^3)}
\approx
2510\ \mathrm{A}
\]
At 345 kV:
I
=
\frac{500\times10^6}
{\sqrt{3}(345\times10^3)}
\approx
837\ \mathrm{A}
\]
The current is roughly one-third as large at the higher voltage.
Example 2: Resistive Loss
A three-phase line carries 800 A and has an effective resistance of 0.08 ohm per phase.
P_{\mathrm{loss}}
=
3I^2R
=
3(800)^2(0.08)
=
153{,}600\ \mathrm{W}
\]
The resistive loss is about 154 kW.
Example 3: Feeder Utilization
A feeder is rated for 12 MVA and carries 9.6 MVA at peak.
U
=
\frac{9.6}{12}
=
0.80
=
80\%
\]
The remaining nominal headroom is 20 percent, but voltage and contingency criteria may reduce usable capacity.
Example 4: Transformer Loading After Electrification
A neighborhood transformer normally peaks at 420 kVA on a 500 kVA rating.
New electric-vehicle charging adds 90 kVA coincident with the peak.
S_{\mathrm{new}}
=
420+90
=
510\ \mathrm{kVA}
\]
The new loading is:
\frac{510}{500}
=
102\%
\]
Whether this is acceptable depends on transformer thermal capability, duration, ambient temperature, and planning criteria.
Example 5: Congestion Cost
A low-cost generator behind a transmission constraint could produce an additional 200 MWh at $30/MWh, but a local generator must instead serve the load at $85/MWh.
The incremental production cost is:
(85-30)(200)
=
\$11{,}000
\]
This simplified example shows why recurring congestion can create economic value for network expansion or other congestion-relief measures.
Common Misconceptions
Misconception 1: Electricity follows the path specified by a contract.
Physical power flows according to network impedance, voltages, phase angles, and topology.
Misconception 2: A transmission line’s thermal rating is its complete transfer capability.
Voltage, stability, contingency, and system constraints can be more restrictive.
Misconception 3: Distribution is simply a smaller version of transmission.
Distribution systems have different topology, protection, voltage regulation, customer interfaces, and increasingly large amounts of distributed generation and flexible load.
Misconception 4: Underground networks eliminate reliability problems.
They reduce some hazards while introducing different cost, repair, flood, and thermal considerations.
Misconception 5: Spare substation capacity means a new load can always connect.
Feeders, transformers, transmission interfaces, voltage limits, protection, and upstream constraints can still bind.
Misconception 6: Distributed solar only reduces feeder load.
At high penetration it can create reverse flow, voltage rise, and new operational requirements.
Misconception 7: Grid expansion is only about building more lines.
Reconductoring, storage, demand flexibility, topology, automation, power-flow control, and dynamic ratings can sometimes relieve constraints.
Python Workflow: Network Capacity and Losses
A compact workflow can calculate three-phase current, feeder utilization, and resistive loss.
from math import sqrt

def three_phase_current(
    power_mw,
    voltage_kv,
    power_factor=1.0,
):
    return (
        power_mw * 1_000_000
        /
        (
            sqrt(3)
            * voltage_kv
            * 1_000
            * power_factor
        )
    )

def three_phase_loss_kw(
    current_a,
    resistance_ohm_per_phase,
):
    watts = (
        3
        * current_a**2
        * resistance_ohm_per_phase
    )
    return watts / 1000

def utilization(load_mva, rating_mva):
    return load_mva / rating_mva

current = three_phase_current(
    power_mw=500,
    voltage_kv=345,
)

loss_kw = three_phase_loss_kw(
    current_a=800,
    resistance_ohm_per_phase=0.08,
)

print("Current:", round(current, 1), "A")
print("Loss:", round(loss_kw, 1), "kW")
print("Feeder utilization:", utilization(9.6, 12))
A more advanced network model could add:
- bus admittance matrices;
- AC power flow;
- contingency analysis;
- transformer taps;
- reactive power;
- time-series feeder loads;
- distributed solar;
- batteries;
- electric-vehicle charging;
- hosting-capacity analysis.
The level of model detail should match the question.
R Workflow: Feeder Loading Analysis
R can rank feeders by peak utilization and estimate headroom.
feeders <- data.frame(
  feeder = c("North", "Central", "East", "South"),
  rating_mva = c(15, 18, 12, 10),
  peak_mva = c(11.2, 16.5, 9.6, 8.7)
)

feeders$utilization <-
  feeders$peak_mva /
  feeders$rating_mva

feeders$headroom_mva <-
  feeders$rating_mva -
  feeders$peak_mva

feeders <-
  feeders[
    order(-feeders$utilization),
  ]

print(feeders)
This type of screening can identify circuits that deserve deeper engineering analysis.
It should not substitute for detailed voltage, protection, thermal, and contingency studies.
GitHub Repository
Complete Code Repository
The full Energy Systems repository contains reproducible article workflows, transmission and feeder models, loss calculations, capacity analysis, congestion examples, planning scenarios, datasets, documentation, and multi-language computational assets.
A Practical T&D Assessment Method
A transmission or distribution assessment can follow a repeatable sequence:
- Define the question. Determine whether the issue is capacity, reliability, voltage, congestion, interconnection, load growth, resilience, or asset condition.
- Map the network. Identify buses, lines, feeders, substations, transformers, switches, and major loads and generators.
- Establish voltage levels. Document where voltage transformation occurs and which equipment defines each network layer.
- Collect ratings. Record conductor, transformer, breaker, regulator, and substation limits.
- Characterize load. Use time-series demand rather than annual energy alone.
- Characterize generation. Include location, variability, dispatchability, and reverse-flow potential.
- Calculate base-case flows. Identify heavily loaded interfaces and voltage issues.
- Estimate losses. Identify where high current produces material efficiency penalties.
- Test contingencies. Recalculate flows after credible equipment outages.
- Assess local constraints. Examine feeder, transformer, and substation limits.
- Test future scenarios. Add electrification, distributed resources, industry, data centers, and generation projects.
- Identify expansion options. Compare new lines, reconductoring, storage, demand flexibility, automation, and grid-enhancing technologies.
- Evaluate siting and permitting. Include land, community, environmental, and jurisdictional constraints.
- Prioritize by risk and value. Select projects that improve capacity, reliability, flexibility, and long-term system usefulness.
The purpose is to connect network physics with investment decisions.
Policy, Equity, and Public Value
Transmission and distribution infrastructure shapes who can connect, how much customers pay, where reliability investment occurs, and which regions host the physical footprint of the power system.
Important public questions include:
- Who pays for network upgrades?
- Who benefits from lower congestion?
- Which communities host new transmission corridors?
- Which neighborhoods receive distribution modernization first?
- Where are outage rates highest?
- How are distributed-resource interconnection costs allocated?
- How are large-load upgrades financed?
- Which projects improve access to low-cost generation?
Network investment can create broad public benefits, but those benefits and burdens are not automatically distributed fairly.
Planning therefore requires both engineering and governance.
Limits, Uncertainty, and Responsible Interpretation
Transmission and distribution studies can create false confidence if model assumptions are hidden.
Important uncertainties include:
- future load growth;
- location of new demand;
- renewable development;
- generator retirements;
- weather;
- equipment condition;
- interconnection timing;
- technology cost;
- project permitting;
- customer adoption of electric vehicles and heat pumps;
- distributed generation;
- storage operation.
The modeling method also matters.
A peak-load screening model cannot determine detailed protection requirements. A DC power-flow model cannot fully represent voltage and reactive power. A static distribution model can miss time-dependent solar export and charging peaks.
Responsible analysis should state the model boundary and the decisions it can support.
The network is too important for precision that exceeds the underlying evidence.
The Infrastructure Between Generation and Use
Transmission and distribution systems form the physical bridge between electricity generation and electricity use.
Transmission moves bulk power over long distances. Substations transform voltage, switch circuits, protect equipment, and connect network layers. Distribution feeders carry electricity through communities. Local transformers reduce voltage for customer use. Protection systems isolate faults. Voltage-control equipment keeps service within acceptable ranges.
The network also determines what the wider energy transition can physically accomplish.
Renewable generation may require new transmission. Distributed solar changes feeder flows. Electric vehicles and heat pumps increase local demand. Data centers and industrial electrification create concentrated loads. Batteries can relieve or intensify constraints depending on when and where they operate.
Congestion, losses, transformer loading, voltage, thermal ratings, protection, siting, and permitting can all become binding constraints.
The central planning challenge is therefore not merely to build more infrastructure. It is to build and operate the right network in the right places, with enough flexibility to serve futures that remain uncertain.
The next article, Smart Grids, examines the digital layer increasingly superimposed on this physical network: sensing, advanced metering, automation, distributed resources, demand response, communications, and intelligent grid management.
Related Articles
- Electricity Grids
- Grid Reliability and Resilience
- Smart Grids
- Microgrids and Distributed Energy Systems
- Power-System Operations and Dispatch
- Grid Interconnection and Transmission Planning
Further Reading
- Grainger, John J., and William D. Stevenson Jr. Power System Analysis.
- Glover, J. Duncan, Thomas Overbye, and Mulukutla S. Sarma. Power System Analysis and Design.
- Kersting, William H. Distribution System Modeling and Analysis.
- North American Electric Reliability Corporation. Transmission planning and reliability resources.
- U.S. Department of Energy. Transmission, distribution, grid deployment, and modernization resources.
- National Renewable Energy Laboratory. Transmission planning, distribution integration, and grid modernization research.
- Lawrence Berkeley National Laboratory. Transmission, interconnection, distribution, and electricity-market research.
References
- Grainger, John J., and William D. Stevenson Jr. Power System Analysis. McGraw-Hill.
- Glover, J. Duncan, Thomas Overbye, and Mulukutla S. Sarma. Power System Analysis and Design. Cengage.
- Kersting, William H. Distribution System Modeling and Analysis. CRC Press.
- North American Electric Reliability Corporation. Reliability and transmission resources. Available at: NERC.
- U.S. Department of Energy. Grid Deployment Office. Available at: DOE Grid Deployment Office.
- National Renewable Energy Laboratory. Grid modernization and power-system research. Available at: NREL.
- Lawrence Berkeley National Laboratory. Electricity Markets and Policy research. Available at: Berkeley Lab.
- IEEE. Power and Energy Society standards and technical resources. Available at: IEEE Power & Energy Society.