
Table of Contents
- Abstract
- Prototype Repository
- SDG Alignment
- Why an Arduino Energy Monitoring System Matters
- System Overview
- Bill of Materials
- Engineering Specifications
- System Architecture
- Wiring the Arduino Energy Monitoring System
- Firmware Design Goals
- Advanced Arduino Code
- Engineering Notes
- Validation and Testing
- Suggested Performance Metrics
- Applications
- Supporting SDG 7: Affordable and Clean Energy
- Reproducibility
- Conclusion
Abstract
This project presents a prototype Arduino energy monitoring system built around a microcontroller and an INA219 current and voltage sensor. The system measures bus voltage and current, calculates instantaneous power, and estimates cumulative energy consumption over time.
From an engineering perspective, the build demonstrates a compact embedded metering system for low-voltage DC monitoring. From a sustainability perspective, it illustrates how real-time visibility into energy use can support efficiency, better design decisions, and more responsible infrastructure management.
Prototype Repository
This project is published as an open prototype so that engineers, researchers, students, and advanced makers can reproduce and extend the design. All firmware, documentation, wiring notes, and example monitoring data are available in the project repository.
GitHub Repository:
Arduino Energy Monitor – Source Files and Documentation
The repository contains the complete prototype build materials:
- Arduino monitoring firmware (.ino)
- bill of materials
- setup guide
- calibration notes
- deployment notes
- example energy readings
Engineers can clone the repository, fork the design, or download the complete project using GitHub’s Download ZIP feature.
All materials are released under the MIT License to support reuse in research, education, and prototype engineering work.
Repository Structure
arduino-energy-monitor/

README.md
LICENSE

BOM.csv

firmware/
  energy_monitor.ino

docs/
  setup_guide.md
  calibration.md
  deployment_notes.md

data/
  example_energy_readings.csv

hardware/
SDG Alignment
This project connects most directly to SDG 7: Affordable and Clean Energy, which emphasizes access to reliable, sustainable, and modern energy systems.
It also connects to several related themes:
- SDG 9: Industry, Innovation and Infrastructure — through embedded monitoring and infrastructure visibility
- SDG 11: Sustainable Cities and Communities — through more transparent energy use in built environments
- SDG 12: Responsible Consumption and Production — by supporting more informed electricity use and efficiency analysis
Monitoring is a foundational requirement for energy management. Without measurement, it becomes difficult to evaluate system performance, identify inefficiencies, or validate the benefits of energy-saving interventions.
Why an Arduino Energy Monitoring System Matters
Energy systems are often discussed in terms of generation capacity, infrastructure investment, or renewable transition. But efficiency also depends on something more basic: knowing how electricity is actually being used.
An embedded monitoring system makes electrical behavior visible. That visibility matters for several reasons:
- it helps engineers understand how loads behave in real time
- it makes inefficiencies easier to identify
- it provides data for evaluating design changes
- it supports more responsible energy use at small scales
At a prototype level, the value of the system is not that it replaces commercial metering equipment. Its value is that it demonstrates the logic of measurement, analysis, and energy awareness in a form that can be built, tested, and extended.
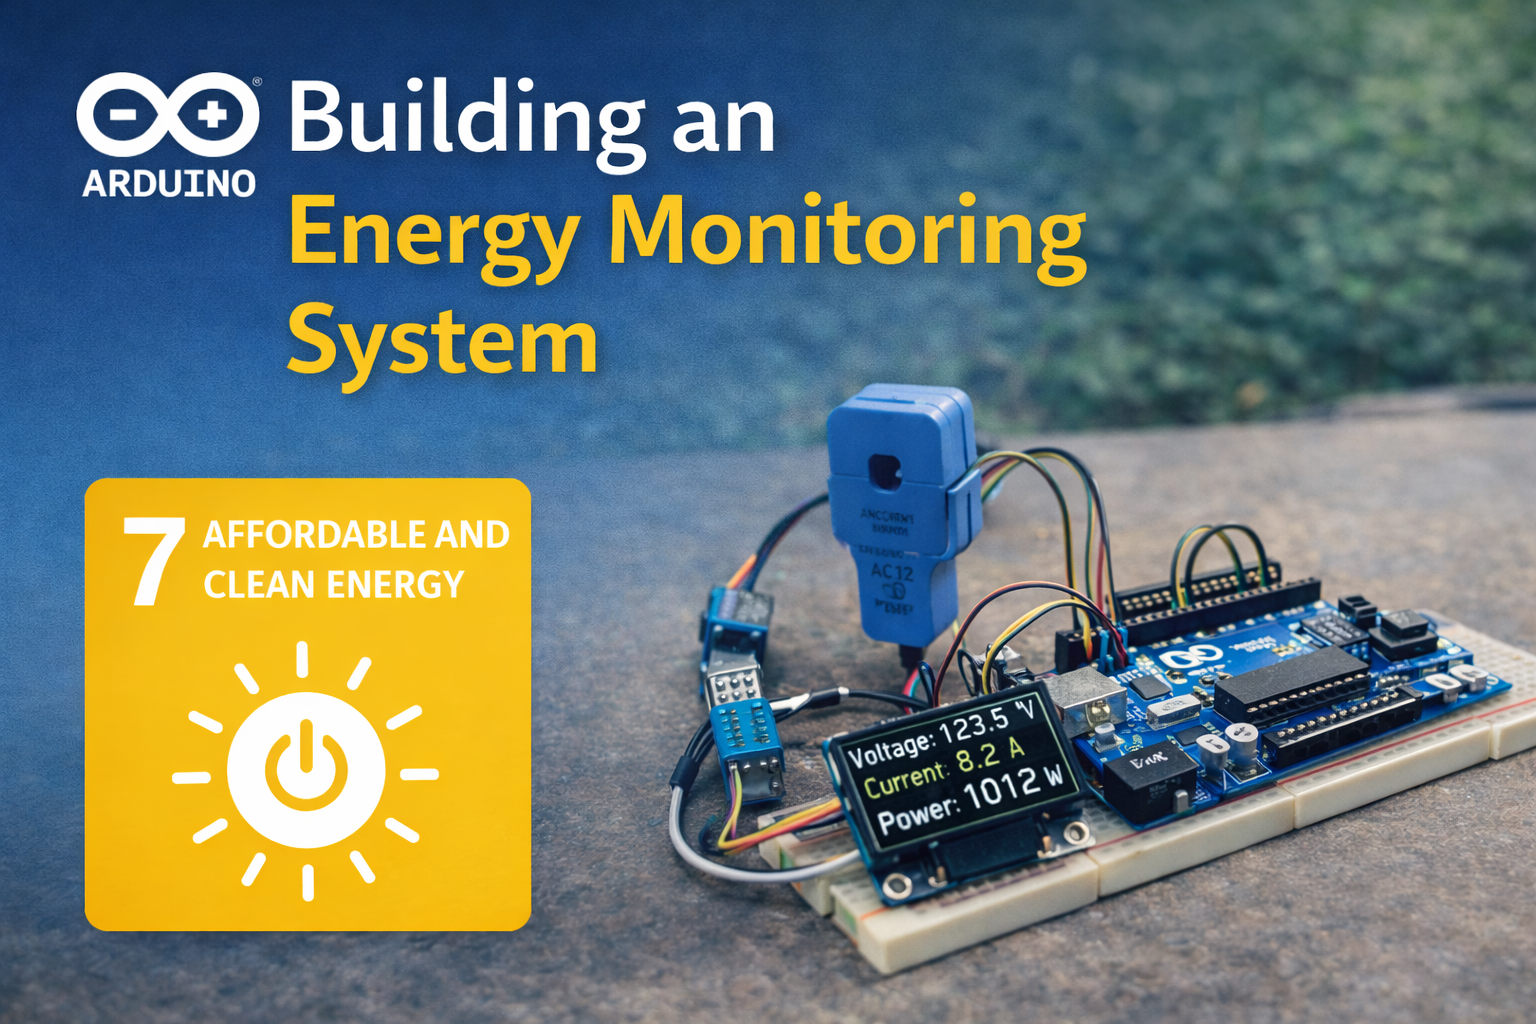
System Overview
The monitoring system uses an INA219 current and voltage sensor connected to an Arduino microcontroller through the I2C interface. The INA219 measures bus voltage and current flowing through a low-voltage DC circuit.
Using these measurements, the Arduino calculates:
- Voltage (V)
- Current (A or mA)
- Power (W or mW)
- Total energy consumption (Wh)
The system continuously samples electrical values and reports the results through the serial monitor or an optional display module. In this form, it functions as a compact embedded energy meter for experimental monitoring and education.
Bill of Materials
- Arduino Uno or compatible microcontroller
- INA219 current and voltage sensor module
- SSD1306 OLED display (optional)
- Breadboard
- Jumper wires
- Low-voltage DC power supply
- Electrical load (LEDs, fan, or motor)
These components form a compact embedded system capable of monitoring electrical performance in real time.
Engineering Specifications
| Parameter | Specification |
|---|---|
| Microcontroller | Arduino Uno (ATmega328P) or equivalent |
| Sensor | INA219 current and voltage sensor |
| Communication protocol | I2C |
| Measured values | Voltage, current, power, cumulative energy |
| Energy calculation basis | Power integrated over elapsed time |
| Display output | Serial monitor, optional OLED |
| Typical use case | Low-voltage DC monitoring |
| Deployment scope | Educational, prototype, and experimental energy monitoring |
System Architecture
The INA219 sensor measures current by detecting the voltage drop across an internal shunt resistor. Because it operates as a high-side sensor, it measures current without disturbing the ground reference of the circuit.
The Arduino reads sensor data using the I2C protocol and calculates power using the standard electrical relationship:
Power (W) = Voltage (V) × Current (A)
Energy consumption is then estimated by integrating power measurements over time:
Energy (Wh) = Power × Time
At a systems level, the architecture can be summarized as:
DC Source / Load → INA219 Sensor → Arduino → Power / Energy Calculations → Serial Output / Logging
This simple architecture mirrors the core logic used in larger energy metering systems: sense, calculate, record, and interpret.
Wiring the Arduino Energy Monitoring System
The INA219 and OLED display communicate through the Arduino’s I2C interface.
- Arduino 5V → INA219 VCC
- Arduino GND → INA219 GND
- Arduino A4 → SDA
- Arduino A5 → SCL
The sensor must be placed in series with the positive supply line:
- Power supply positive → INA219 VIN+
- INA219 VIN- → Load positive
- Power supply ground → Load ground
This configuration allows the sensor to measure current flowing into the load. Confirm polarity before powering the circuit, since incorrect wiring can affect both measurement accuracy and component safety.
Firmware Design Goals
The firmware in this project is designed to do more than read a single sensor value. It attempts to create a basic but meaningful metering system by:
- reading voltage and current consistently
- calculating instantaneous power
- estimating cumulative energy over time
- providing serial telemetry for observation and debugging
- creating a foundation for future displays, logging, or dashboards
These design goals make the build more useful as an educational and engineering tool, since the system produces not just raw measurements but interpretable operating data.
Advanced Arduino Code
The firmware below improves on the simplest possible readout by separating telemetry into a dedicated function and explicitly tracking elapsed time for cumulative energy estimation.
#include <Wire.h>
#include <Adafruit_INA219.h>

Adafruit_INA219 ina219;

const unsigned long SAMPLE_INTERVAL_MS = 5000UL;

unsigned long lastSampleTime = 0;
unsigned long previousMillis = 0;

float cumulativeEnergyWh = 0.0;

void printTelemetry(float busVoltage, float currentmA, float powermW, float energyWh) {
  Serial.print("Bus Voltage: ");
  Serial.print(busVoltage, 2);
  Serial.print(" V | Current: ");
  Serial.print(currentmA, 2);
  Serial.print(" mA | Power: ");
  Serial.print(powermW, 2);
  Serial.print(" mW | Energy: ");
  Serial.print(energyWh, 6);
  Serial.println(" Wh");
}

void setup() {
  Serial.begin(9600);

  if (!ina219.begin()) {
    Serial.println("INA219 not found. Check wiring.");
    while (1) {
      delay(10);
    }
  }

  previousMillis = millis();

  Serial.println("Arduino Energy Monitor Starting");
  Serial.println("--------------------------------");
}

void loop() {
  unsigned long now = millis();

  if (now - lastSampleTime >= SAMPLE_INTERVAL_MS) {
    lastSampleTime = now;

    float busVoltage = ina219.getBusVoltage_V();
    float currentmA = ina219.getCurrent_mA();
    float powermW = ina219.getPower_mW();

    float elapsedHours = (now - previousMillis) / 3600000.0;
    cumulativeEnergyWh += (powermW / 1000.0) * elapsedHours;
    previousMillis = now;

    printTelemetry(busVoltage, currentmA, powermW, cumulativeEnergyWh);
  }
}
Engineering Notes
A few technical details are worth emphasizing:
- High-side current sensing: the INA219 measures current without shifting the system ground reference.
- Energy estimation: cumulative energy is not measured directly; it is estimated by integrating power over elapsed time.
- Sampling interval: longer or shorter intervals will affect the granularity of energy accumulation and telemetry output.
- Sensor limits: the INA219 is suitable for low-voltage DC monitoring, but it is not a universal metering solution for all electrical environments.
- Serial telemetry: structured output makes it easier to compare readings, log values externally, or extend the system later.
In more advanced implementations, the system could be extended with OLED display output, SD card logging, wireless telemetry, or event-based alerts when loads exceed expected thresholds.
Validation and Testing
To bring this project closer to engineering-grade documentation, validation should include:
- compare INA219 voltage readings against a multimeter
- compare current readings against a known load or reference meter
- verify that calculated power is consistent with voltage × current
- run the system for a fixed interval under a stable load and evaluate cumulative energy estimates
- confirm that readings remain stable across repeated samples
- verify polarity and wiring integrity before each test condition
If results appear inconsistent, the problem may be related to wiring, unstable loads, sensor limits, or time-step assumptions in the energy calculation rather than an error in the basic monitoring concept.
Suggested Performance Metrics
For a more rigorous evaluation, the system can be assessed using a few simple metrics:
- voltage accuracy: agreement between sensor reading and multimeter reading
- current accuracy: consistency of measured current under known load
- power calculation consistency: whether reported power aligns with the product of voltage and current
- energy accumulation drift: whether cumulative Wh estimates remain reasonable over longer runs
- telemetry stability: whether repeated output remains readable and consistent across samples
Even informal measurement of these metrics improves the usefulness and credibility of the prototype.
Applications
Energy monitoring systems can support a wide range of engineering and sustainability applications.
- monitoring energy use in battery-powered devices
- analyzing energy efficiency of embedded systems
- evaluating small solar power installations
- supporting engineering education
- prototyping IoT energy analytics
These measurements provide the data needed to understand how electrical systems behave in real-world conditions.
Supporting SDG 7: Affordable and Clean Energy
Sustainable energy systems depend on both generation and efficiency. While renewable energy technologies receive significant attention, improving how energy is used is equally important.
Monitoring technologies help engineers identify inefficiencies and optimize system performance. When energy consumption becomes visible, it becomes easier to reduce waste and design more efficient systems.
Embedded monitoring projects like this one help demonstrate how measurement tools can support responsible energy management.
Reproducibility
All firmware, documentation, and supporting build materials necessary to reproduce the prototype are included in the project repository. The design intentionally relies on widely available educational and hobbyist hardware so that it can be rebuilt in classrooms, labs, and independent engineering environments.
The system is intended as a reference implementation rather than a certified metering instrument. Engineers adapting it for more demanding or longer-term use should validate sensor accuracy, load range, thermal conditions, and long-duration energy accumulation behavior under real operating conditions.
Conclusion
Building an Arduino energy monitoring system demonstrates how accessible electronics can contribute to a deeper understanding of energy infrastructure. By measuring voltage, current, power, and cumulative energy consumption, the system provides real-time insight into how electrical devices consume electricity.
While simple, the design reflects an important principle of sustainable infrastructure: measurement is the first step toward optimization. Monitoring technologies make energy systems visible, and visibility makes them easier to improve.