
Last Updated August 7, 2026
Electricity grids were built long before digital networks became pervasive. For most of the twentieth century, grid operation depended on centralized generation, one-way power flow, electromechanical equipment, scheduled meter reading, limited distribution visibility, and control systems concentrated at utilities and system operators.
That architecture is changing.
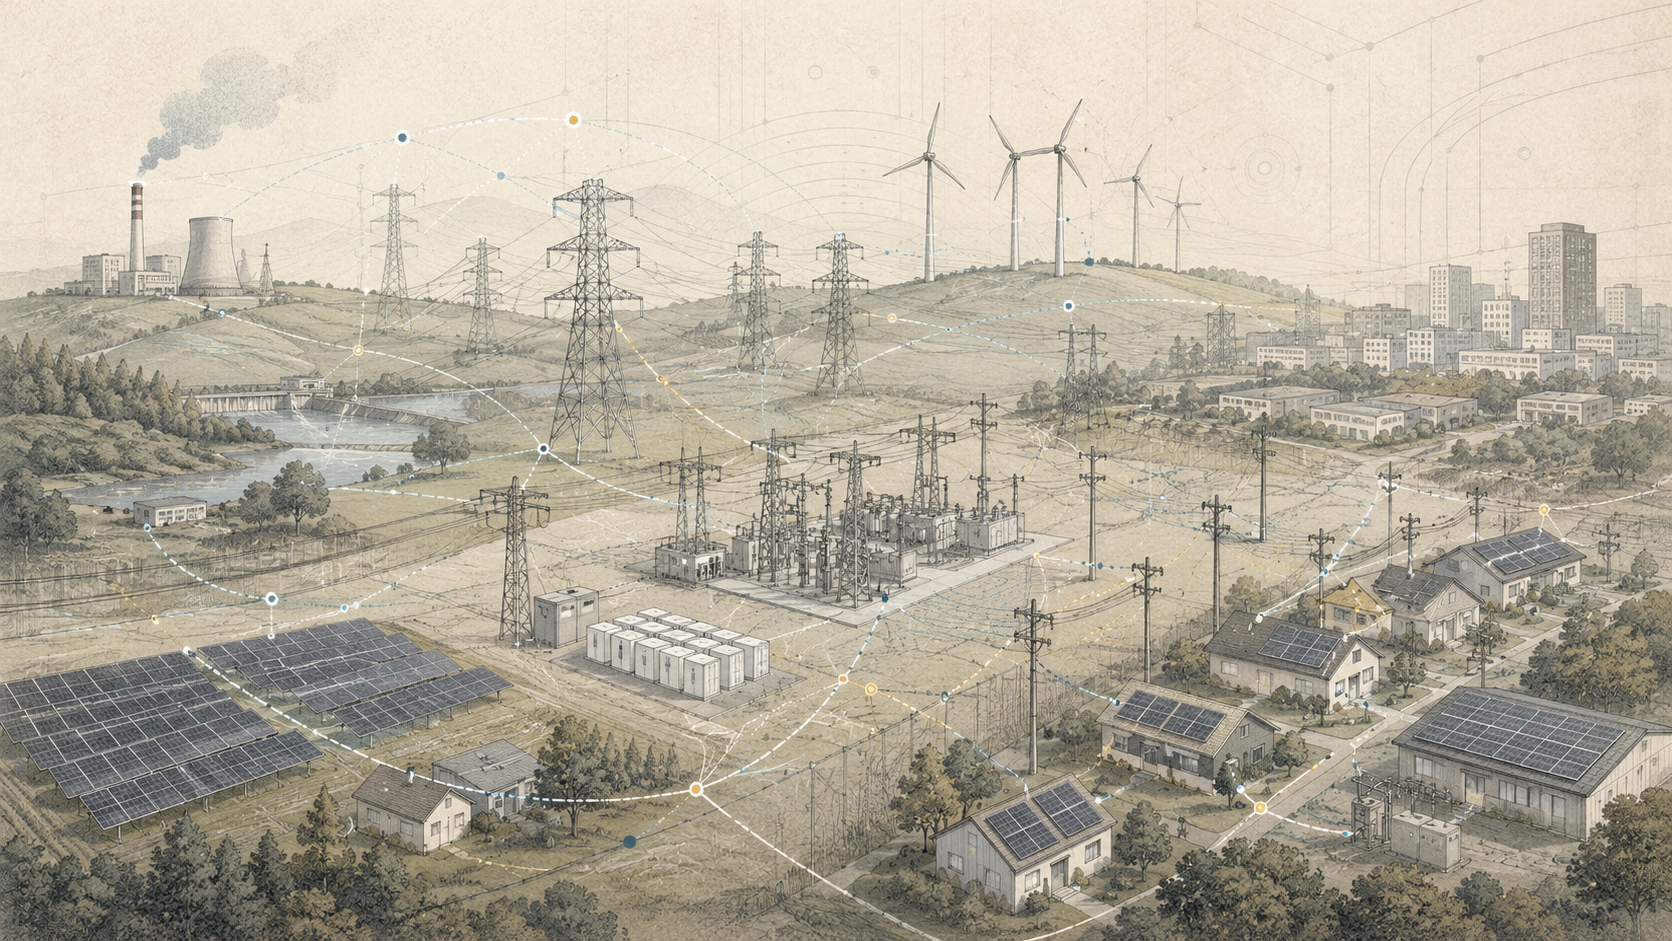
A smart grid combines the physical electricity network with digital sensing, communications, automation, computation, forecasting, advanced metering, distributed energy resources, and increasingly adaptive control. The objective is not simply to add software to the grid. It is to make the power system more observable, responsive, flexible, efficient, resilient, and capable of coordinating millions of devices.
Smart-grid technologies can help utilities:
- detect outages faster;
- locate faults more precisely;
- restore service automatically;
- manage voltage more dynamically;
- integrate rooftop solar and batteries;
- coordinate electric-vehicle charging;
- use demand response as a grid resource;
- improve load forecasting;
- reduce technical losses;
- monitor equipment condition;
- increase distribution visibility;
- support flexible interconnection.
But digitalization also creates new dependencies.
Communications can fail. Sensors can be inaccurate. Software can contain defects. Cybersecurity becomes a physical reliability issue. Data volume can exceed an organization’s ability to use it. Algorithms can automate poor assumptions as easily as good ones.
A smart grid is therefore not defined by the number of connected devices. It is defined by how effectively information, control, infrastructure, institutions, and human judgment work together.
What Makes a Grid Smart?
The term smart grid can sound more precise than it is.
There is no single device that turns a conventional grid into a smart grid. Instead, intelligence emerges from a collection of capabilities:
- measurement;
- communication;
- computation;
- automation;
- forecasting;
- coordination;
- control;
- feedback.
A grid becomes more intelligent when information about its condition can be converted into decisions quickly enough to improve operation.
The general pattern is:
\text{Sense}
\rightarrow
\text{Communicate}
\rightarrow
\text{Estimate}
\rightarrow
\text{Decide}
\rightarrow
\text{Act}
\rightarrow
\text{Verify}
\]
This is a closed-loop control concept.
The value comes not from measurement alone but from connecting measurement to action.
The Physical Grid and the Digital Layer
Every smart-grid function still depends on physical infrastructure.
Software cannot transmit electricity through a line that does not exist. Analytics cannot make an overloaded transformer larger. A sensor cannot eliminate a weak transmission corridor. Automation cannot compensate indefinitely for insufficient generation or inadequate distribution capacity.
The digital layer works on top of:
- power plants;
- transmission lines;
- substations;
- distribution feeders;
- transformers;
- switchgear;
- protective devices;
- customer equipment.
Smart-grid technologies improve how these assets are monitored and coordinated.
This distinction is essential because some problems are informational while others are physical.
A utility may reduce outage duration through automated switching. It cannot automate its way out of a feeder that is chronically undersized for future electrification.
Observability and Measurement
A system cannot be controlled well if its state is poorly known.
Observability means that enough measurements are available to estimate the important electrical condition of the system.
Measurements may include:
- voltage;
- current;
- real power;
- reactive power;
- frequency;
- breaker status;
- transformer temperature;
- weather;
- power quality;
- customer demand;
- distributed generation output.
Transmission systems have historically had much greater observability than distribution systems.
Smart-grid investment is narrowing that gap.
Distribution sensors, smart meters, line monitors, inverter telemetry, and digital substations can provide much finer-grained visibility.
But measurement quantity is not the same as measurement quality.
Bad timestamps, calibration errors, communication delays, missing data, and incompatible systems can create false confidence.
Advanced Metering Infrastructure
Advanced Metering Infrastructure, commonly abbreviated AMI, connects digital meters with utility communication and data systems.
A typical AMI architecture includes:
- smart meters;
- local communication networks;
- backhaul communications;
- head-end systems;
- meter data management systems;
- billing and customer systems;
- analytics platforms.
AMI can provide interval consumption data rather than one monthly meter reading.
It can also support:
- remote meter reading;
- outage notification;
- service connection and disconnection;
- voltage monitoring;
- tamper detection;
- time-varying rates;
- distributed-resource programs.
AMI is one of the most visible smart-grid technologies because it reaches directly into customer premises.
It also raises some of the most important questions about data governance and privacy.
Smart Meters and Interval Data
A traditional meter answers a simple question:
How much electricity was consumed over the billing period?
A smart meter can answer a more detailed question:
How much electricity was consumed during each interval?
If a customer uses 900 kWh in a month, monthly energy alone does not reveal whether demand was flat or concentrated in a few high-power periods.
For grid planning, the difference matters.
A simplified load factor is:
\mathrm{Load\ Factor}
=
\frac{P_{\mathrm{average}}}
{P_{\mathrm{peak}}}
\]
Two customers can use the same monthly energy and impose different peak demands on transformers and feeders.
Interval data therefore improves the ability to understand coincidence, diversity, charging patterns, solar export, and local peaks.
Grid Communications
Smart-grid functions depend on communications.
Networks may use:
- fiber optics;
- radio;
- cellular networks;
- microwave;
- power-line communication;
- mesh networks;
- private utility networks.
Different applications require different performance.
Protection can require very low latency and high reliability. Meter reading can tolerate much slower communication. Wide-area monitoring requires precise timing. Distributed-resource coordination may need secure two-way messaging to many endpoints.
Communication architecture must therefore be matched to function.
Redundancy also matters.
A digital grid that depends on one vulnerable communication path may become less resilient rather than more.
SCADA and Supervisory Control
Supervisory Control and Data Acquisition systems provide remote monitoring and control of grid equipment.
SCADA can display:
- breaker status;
- line flows;
- substation voltage;
- transformer loading;
- alarms;
- equipment conditions.
Operators can use SCADA to issue control commands, open or close breakers, adjust equipment, and respond to abnormal conditions.
SCADA is not new.
What is changing is the scale, resolution, integration, and number of devices connected to supervisory control.
Traditional SCADA might monitor a substation. Modern digital distribution systems may coordinate substations, automated switches, distributed batteries, smart inverters, voltage regulators, and customer-side flexibility.
The control perimeter has expanded.
Distribution Automation
Distribution automation brings sensing and control deeper into local networks.
Automated devices can:
- detect faults;
- isolate damaged sections;
- reconfigure feeders;
- restore unaffected customers;
- manage voltage;
- coordinate capacitors;
- monitor transformer loading.
The major benefit is speed.
Manual outage response may require calls, patrols, switching orders, and field crews before service can be restored.
Automated systems can sometimes identify the faulted section and restore alternative paths within seconds or minutes.
This can reduce outage duration substantially even when the original fault still requires physical repair.
Fault Location, Isolation, and Service Restoration
Fault Location, Isolation, and Service Restoration is often abbreviated FLISR.
The logic is straightforward:
- Detect abnormal current or voltage.
- Identify the likely faulted section.
- Open devices around that section.
- Determine whether alternate feeder capacity exists.
- Close tie switches to restore unaffected customers.
- Verify the new configuration remains within limits.
Suppose a feeder serves 8,000 customers and a fault affects one section containing 1,500 customers.
Without automation, all 8,000 may remain without power until crews isolate the fault.
With FLISR, 6,500 customers may be restored through switching while only the faulted section remains out.
Automation does not eliminate the outage. It limits its scope and duration.
Advanced Distribution Management Systems
An Advanced Distribution Management System, or ADMS, integrates multiple distribution functions into one operational platform.
Capabilities can include:
- network modeling;
- outage management;
- SCADA integration;
- distribution power flow;
- fault analysis;
- voltage optimization;
- switching plans;
- distributed-resource awareness;
- operator visualization.
The value of an ADMS depends on the quality of the underlying network model.
If feeder topology, switch status, phase connectivity, or equipment data are wrong, sophisticated software can produce wrong conclusions.
Digital transformation therefore often begins with basic data governance.
The model must reflect the system that actually exists.
Volt/VAR Optimization
Voltage and reactive power can be managed more actively when the network is observable.
Volt/VAR optimization coordinates devices such as:
- voltage regulators;
- transformer taps;
- capacitor banks;
- smart inverters;
- reactive-power resources.
Objectives can include:
- keeping voltage within limits;
- reducing losses;
- reducing peak demand;
- improving power factor;
- accommodating distributed generation.
One strategy is conservation voltage reduction.
If voltage can be operated toward the lower end of an acceptable range without harming service, some loads may consume slightly less power.
The savings depend on load type.
This illustrates a broader smart-grid principle: small improvements across millions of devices can create system-level value.
Distributed Energy Resource Management Systems
As distributed energy resources increase, utilities may need dedicated coordination platforms.
A Distributed Energy Resource Management System, or DERMS, can manage or coordinate:
- rooftop solar;
- community solar;
- batteries;
- electric vehicles;
- flexible building loads;
- backup generation;
- smart inverters;
- aggregated demand response.
A DERMS can help answer:
- Which resources are available?
- Where are they located?
- What constraints apply?
- How quickly can they respond?
- Can they support voltage or capacity?
- Can they be dispatched without creating another local problem?
Distributed flexibility is valuable only when its location and network effects are understood.
Distributed Energy Resources
Distributed Energy Resources, commonly called DERs, are resources connected close to customers rather than exclusively at central generating stations.
Examples include:
- rooftop solar;
- batteries;
- small generators;
- thermal storage;
- electric vehicles;
- controllable loads;
- building energy systems.
DERs can reduce net load, shift demand, provide backup power, and sometimes support voltage or frequency.
But they also change distribution flows.
A feeder may move from:
P_{\mathrm{substation}}
\rightarrow
P_{\mathrm{customer}}
\]
to periods where:
P_{\mathrm{customer\ generation}}
\rightarrow
P_{\mathrm{substation}}
\]
This bidirectionality is one of the most important drivers of smart-grid development.
Demand Response
Demand response changes electricity consumption in response to grid conditions, prices, or control signals.
Examples include:
- temporarily reducing industrial load;
- adjusting building cooling;
- shifting water heating;
- delaying electric-vehicle charging;
- cycling selected equipment;
- discharging customer batteries.
A simplified flexible-load relationship is:
P_{\mathrm{net}}(t)
=
P_{\mathrm{baseline}}(t)
–
P_{\mathrm{response}}(t)
\]
Demand response can reduce peaks and provide operating flexibility.
But the response must be measurable, predictable enough to rely on, and compatible with customer needs.
A theoretical megawatt that does not respond when called is not a dependable grid resource.
Dynamic Pricing and Flexible Demand
Electricity costs and grid stress vary over time.
Dynamic pricing attempts to expose some of that variation to customers.
Structures can include:
- time-of-use rates;
- critical-peak pricing;
- real-time pricing;
- peak-time rebates.
The theory is simple.
If high-demand periods are more expensive, customers may shift flexible consumption.
But customer response depends on:
- automation;
- price sensitivity;
- understanding;
- appliance flexibility;
- housing conditions;
- work schedules;
- access to enabling technology.
Pricing without automation may produce limited flexibility.
Automation without fair customer protections can create equity concerns.
Smart demand therefore requires both technology and program design.
Electric Vehicles as Grid Resources
Electric vehicles are mobile electrical loads.
A vehicle connected to a charger can potentially provide flexibility by changing when it charges.
Suppose 50,000 vehicles each charge at 7 kW.
If all charge simultaneously:
P
=
50{,}000
\times
7\ \mathrm{kW}
=
350\ \mathrm{MW}
\]
If smart charging spreads the same energy over more hours, the peak can be reduced significantly.
Future vehicle-grid interaction can include:
- managed charging;
- price-responsive charging;
- charger curtailment;
- vehicle-to-home;
- vehicle-to-building;
- vehicle-to-grid.
Vehicle-to-grid adds complexity because mobility must remain the vehicle’s primary function.
A grid service is useful only if the driver still has enough energy when needed.
Battery Storage and Grid Flexibility
Battery storage is particularly compatible with smart-grid control because it can respond quickly and operate bidirectionally.
A battery can:
- charge during low-demand periods;
- discharge during peaks;
- support frequency;
- manage local feeder constraints;
- reduce solar export;
- provide backup power;
- participate in markets.
The control challenge is to use limited stored energy where it creates the most value.
A battery cannot simultaneously devote its entire state of charge to every service.
Optimization must respect:
- power rating;
- energy capacity;
- state of charge;
- efficiency;
- degradation;
- reserve requirements;
- local network limits.
Smart control increases flexibility, but physical constraints remain binding.
Forecasting and Predictive Operations
Modern grid operations depend increasingly on forecasts.
Utilities and system operators forecast:
- load;
- solar production;
- wind generation;
- temperature;
- storms;
- equipment stress;
- electric-vehicle demand;
- distributed generation;
- market conditions.
Forecast value depends on the decision horizon.
A day-ahead forecast supports scheduling. A five-minute forecast supports real-time balancing. A ten-year load scenario supports infrastructure planning.
Forecast errors cannot be eliminated.
They can be managed through reserves, flexibility, uncertainty ranges, and adaptive operation.
A smart grid should therefore use forecasts as probabilistic decision inputs, not as certainties.
State Estimation and Network Awareness
Not every electrical quantity is measured directly.
State estimation combines available measurements with a network model to estimate system conditions.
The estimated state can include:
- bus voltages;
- voltage angles;
- line flows;
- injections;
- network topology.
State estimation can also identify bad or inconsistent data.
Transmission state estimation is mature.
Distribution state estimation is more difficult because:
- measurements are sparser;
- networks are unbalanced;
- topology changes;
- distributed generation is variable;
- customer loads are less directly observed.
Smart meters and distribution sensors can improve distribution state awareness.
Synchrophasors and Wide-Area Monitoring
Phasor Measurement Units, or PMUs, measure synchronized electrical quantities using precise timing.
Unlike conventional measurements collected at slower or unsynchronized intervals, synchrophasors allow system conditions at distant locations to be compared in time.
Applications include:
- oscillation monitoring;
- angle stability;
- disturbance detection;
- model validation;
- wide-area situational awareness.
PMUs are especially useful for understanding dynamic behavior across large interconnected networks.
Their value depends on:
- placement;
- time synchronization;
- communication reliability;
- data quality;
- operator integration.
More measurements help only when operators and algorithms can interpret them.
Digital Substations
A digital substation replaces some traditional analog signaling and hardwired control with digital communication.
Digital substations may use:
- intelligent electronic devices;
- digital protection relays;
- process buses;
- digital measurement;
- networked control;
- condition monitoring.
Benefits can include:
- reduced wiring;
- improved diagnostics;
- greater configuration flexibility;
- better data access;
- faster automation.
The tradeoff is increased dependence on digital communications and cybersecurity.
A digital substation therefore requires strong architecture, testing, change control, and recovery procedures.
Asset Health and Predictive Maintenance
Smart-grid sensing can shift maintenance from calendar-based schedules toward condition-based decisions.
Assets can be monitored for:
- temperature;
- vibration;
- partial discharge;
- oil condition;
- breaker operations;
- load history;
- thermal cycling;
- environmental exposure.
A simple risk-priority concept is:
\mathrm{Risk\ Priority}
=
\Pr(\mathrm{Failure})
\times
\mathrm{Consequence}
\]
Condition data can improve the estimate of failure probability.
Predictive maintenance should not be confused with certainty.
Sensors may indicate increasing risk, not the exact date an asset will fail.
The objective is better prioritization.
Data Architecture and Interoperability
A smart grid can generate large quantities of data from many systems.
Potential sources include:
- SCADA;
- AMI;
- weather services;
- outage management;
- geographic information systems;
- asset management;
- DERMS;
- ADMS;
- market systems;
- customer platforms.
If these systems use inconsistent identifiers, timestamps, equipment models, or data structures, integration becomes difficult.
Interoperability therefore depends on:
- common models;
- stable interfaces;
- metadata;
- version control;
- time synchronization;
- data-quality rules;
- governance.
The hardest smart-grid problem is often not advanced analytics. It is knowing that two systems are talking about the same transformer.
Cybersecurity and Operational Technology
Digital control creates cyber-physical risk.
A compromise of operational technology can affect physical electricity service.
Threats can include:
- unauthorized access;
- malware;
- credential theft;
- ransomware;
- supply-chain compromise;
- denial of service;
- data manipulation;
- malicious control commands.
Smart-grid cybersecurity therefore includes:
- network segmentation;
- least privilege;
- strong authentication;
- secure remote access;
- asset inventory;
- patch governance;
- monitoring;
- backup communications;
- incident response;
- manual fallback procedures.
The objective is not simply to prevent intrusion. It is to preserve safe operation even when digital systems are degraded.
Privacy and Customer Data
Interval electricity data can reveal patterns about household activity.
Depending on granularity, it may indicate:
- occupancy;
- daily schedules;
- electric-vehicle charging;
- large appliance use;
- distributed generation;
- changes in household behavior.
Utilities therefore need clear rules governing:
- data collection;
- retention;
- access;
- sharing;
- customer consent;
- security;
- third-party use.
Smart-grid value does not require unlimited data access.
Data minimization and purpose limitation can reduce risk while preserving operational usefulness.
Smart Grids and Resilience
Digitalization can improve resilience by enabling faster detection, isolation, reconfiguration, and restoration.
Potential resilience functions include:
- automated switching;
- remote fault detection;
- microgrid islanding;
- distributed battery dispatch;
- critical-load prioritization;
- real-time damage assessment;
- mobile workforce coordination;
- adaptive restoration.
But smart-grid technologies can also create dependencies on:
- communications;
- cloud or data-center services;
- software vendors;
- time synchronization;
- remote credentials;
- firmware supply chains.
A resilient smart grid therefore needs graceful degradation.
When advanced systems fail, the grid should still have a safe operating mode.
When Smart Technology Does Not Solve the Constraint
Smart-grid technology is powerful, but it cannot solve every infrastructure problem.
Automation cannot create unlimited thermal capacity.
Forecasting cannot eliminate a transmission bottleneck.
Smart meters cannot replace a failed transformer.
Demand response cannot indefinitely defer every network upgrade.
DER coordination cannot compensate for inadequate protection design.
A useful decision rule is:
\text{Diagnose the binding constraint before selecting the technology}
\]
If the problem is lack of visibility, sensing may help.
If the problem is switching speed, automation may help.
If the problem is peak demand, flexibility may help.
If the problem is a chronically overloaded conductor, physical reinforcement may still be necessary.
The smartest grid is one that knows when software is sufficient and when infrastructure must change.
Worked Examples
Example 1: Load Factor from Smart-Meter Data
A customer uses 720 kWh over a 30-day month.
Average power is:
P_{\mathrm{avg}}
=
\frac{720}{30\times24}
=
1.0\ \mathrm{kW}
\]
If the measured peak is 5 kW:
\mathrm{Load\ Factor}
=
\frac{1}{5}
=
20\%
\]
The customer uses modest monthly energy but creates a relatively concentrated peak.
Example 2: Managed Electric-Vehicle Charging
Ten thousand vehicles each require 14 kWh overnight.
Total energy is:
E
=
10{,}000
\times
14
=
140\ \mathrm{MWh}
\]
If all charging occurs in two hours:
P_{\mathrm{avg}}
=
\frac{140}{2}
=
70\ \mathrm{MW}
\]
If managed over seven hours:
P_{\mathrm{avg}}
=
\frac{140}{7}
=
20\ \mathrm{MW}
\]
The same energy can create very different peak demand.
Example 3: Automated Restoration
A feeder serves 12,000 customers.
A fault isolates one section with 2,200 customers. Automated switching restores the remaining 9,800 customers after two minutes rather than requiring all customers to wait 90 minutes for manual switching.
Customer interruption-hours avoided are approximately:
9{,}800
\times
\left(
\frac{90-2}{60}
\right)
\approx
14{,}373
\ \mathrm{customer\ hours}
\]
Automation does not repair the fault. It reduces the outage consequence.
Example 4: Demand Response
A commercial portfolio has a baseline peak of 85 MW.
A demand-response program reliably reduces 12 MW.
P_{\mathrm{net}}
=
85-12
=
73\ \mathrm{MW}
\]
If a feeder or substation constraint is 78 MW, the response can prevent overload during the event.
Example 5: Voltage-Control Savings
A feeder averages 10 MW for 4,000 hours per year.
Suppose improved voltage control reduces average demand by 1.2 percent during those hours.
E_{\mathrm{saved}}
=
10
\times
0.012
\times
4{,}000
=
480\ \mathrm{MWh/year}
\]
The actual effect depends on load composition and operating limits.
Common Misconceptions
Misconception 1: A smart grid is simply a grid with smart meters.
AMI is one component. Smart grids also involve sensing, automation, communications, analytics, distributed resources, control, and operational integration.
Misconception 2: More data automatically improves decisions.
Poor data architecture can make additional data a burden rather than an asset.
Misconception 3: Automation eliminates the need for operators.
Automation changes operator work. It does not eliminate the need for supervision, engineering judgment, emergency response, or governance.
Misconception 4: Smart grids remove physical constraints.
Digital tools can reveal and manage constraints but cannot make equipment infinitely capable.
Misconception 5: Distributed resources are always beneficial to the local grid.
Their value depends on location, timing, controls, and network conditions.
Misconception 6: Customer flexibility is unlimited.
Comfort, mobility, production schedules, health, equipment constraints, and social conditions limit flexibility.
Misconception 7: Digitalization always improves resilience.
It can improve resilience while also creating new cyber, communication, and software dependencies.
Python Workflow: Flexible Load and Voltage Control
A simple workflow can compare unmanaged and managed charging and estimate flexible-load effects.
def charging_power_mw(
    vehicles,
    energy_kwh_each,
    charging_hours,
):
    total_mwh = (
        vehicles
        * energy_kwh_each
        / 1000
    )
    return total_mwh / charging_hours

def demand_response(
    baseline_mw,
    response_mw,
):
    return max(
        0.0,
        baseline_mw - response_mw,
    )

def annual_energy_reduction_mwh(
    average_load_mw,
    reduction_fraction,
    operating_hours,
):
    return (
        average_load_mw
        * reduction_fraction
        * operating_hours
    )

unmanaged = charging_power_mw(
    vehicles=10_000,
    energy_kwh_each=14,
    charging_hours=2,
)

managed = charging_power_mw(
    vehicles=10_000,
    energy_kwh_each=14,
    charging_hours=7,
)

print("Unmanaged:", unmanaged, "MW")
print("Managed:", managed, "MW")
print(
    "DR net load:",
    demand_response(85, 12),
    "MW",
)
A production smart-grid model would also require:
- device availability;
- communications latency;
- customer participation;
- feeder constraints;
- state of charge;
- voltage;
- forecast uncertainty;
- control priorities.
The workflow should represent the actual operational boundary.
R Workflow: Interval Demand Analysis
R can summarize interval demand and identify peak periods.
load <- data.frame(
  hour = 0:23,
  demand_mw = c(
    42, 40, 39, 38, 39, 43,
    50, 57, 61, 64, 66, 67,
    68, 69, 71, 74, 79, 85,
    88, 84, 77, 68, 58, 49
  )
)

peak_row <-
  load[
    which.max(load$demand_mw),
  ]

load$above_75_mw <-
  load$demand_mw > 75

print(peak_row)
print(load)
This simple analysis can be extended to:
- smart-meter intervals;
- weather normalization;
- solar export;
- EV charging;
- feeder clustering;
- demand-response events;
- flexibility estimation.
Interval data becomes valuable when it supports a defined decision.
GitHub Repository
Complete Code Repository
The full Energy Systems repository contains reproducible article workflows, smart-grid interval-data analysis, flexible-load models, automation examples, distributed-resource coordination, voltage-control calculations, synthetic datasets, documentation, and multi-language computational assets.
A Practical Smart-Grid Assessment Method
A rigorous smart-grid assessment can follow a repeatable sequence:
- Define the operational problem. Identify whether the need is visibility, outage restoration, voltage control, capacity, DER integration, forecasting, or flexibility.
- Map the physical constraint. Determine whether the problem is fundamentally digital, electrical, or both.
- Inventory measurements. Identify what is measured, where, at what frequency, and with what accuracy.
- Map communications. Document latency, redundancy, bandwidth, ownership, and failure modes.
- Validate the network model. Confirm topology, equipment, phase connectivity, switch status, and ratings.
- Define the control loop. Specify what information produces what decision and what device acts.
- Quantify the baseline. Measure current outage duration, losses, peaks, voltage violations, or operational cost.
- Model flexible resources. Include batteries, EVs, demand response, solar, and controllable loads.
- Test communications failure. Determine how the system behaves if data or control links are lost.
- Test cyber compromise. Identify which controls could create physical consequences.
- Assess customer impacts. Include privacy, affordability, accessibility, and program participation.
- Compare physical alternatives. Determine whether automation can defer or complement infrastructure reinforcement.
- Measure performance. Track whether the deployed technology actually improves the target outcome.
- Design for graceful degradation. Ensure the grid retains a safe mode when advanced functions fail.
The objective is not digitalization for its own sake.
It is better infrastructure performance.
Policy, Equity, and Public Value
Smart-grid investments affect customers differently.
Benefits can include:
- faster outage restoration;
- better usage information;
- new rate options;
- easier DER integration;
- improved reliability;
- lower operating cost.
Potential burdens can include:
- technology costs;
- privacy concerns;
- complex tariffs;
- unequal access to automation;
- digital exclusion;
- cyber risk;
- uneven reliability investment.
A customer with a battery, smart thermostat, EV, and home automation may be able to respond to dynamic prices.
A renter in an inefficient building may have little flexibility.
Programs should therefore distinguish between technical flexibility and practical customer choice.
Public value should be measured in improved service, affordability, resilience, and access—not merely the number of connected devices.
Limits, Uncertainty, and Responsible Interpretation
Smart-grid analysis can overstate what digital systems know.
Important uncertainties include:
- device availability;
- communication latency;
- forecast error;
- customer participation;
- equipment telemetry quality;
- network model accuracy;
- DER behavior;
- software failure;
- cybersecurity events;
- vendor dependencies.
Automation should also distinguish recommendations from actions.
Some controls can operate automatically within tightly defined limits. Others require operator review because the consequence of an error is larger.
Artificial intelligence and machine learning can support:
- forecasting;
- anomaly detection;
- asset-health analysis;
- load classification;
- decision support.
But opaque models should not automatically control critical infrastructure without appropriate validation, safeguards, fallback modes, and human oversight.
A smart grid should increase transparency about system state, not replace uncertainty with false certainty.
From Electrified Infrastructure to Coordinated Infrastructure
Smart grids extend the electricity system beyond wires, transformers, generators, and substations.
They add sensing, communications, computation, forecasting, automation, digital control, and coordination.
This changes what the grid can do.
Faults can be detected faster. Unaffected customers can be restored automatically. Voltage can be managed dynamically. Distributed batteries and solar can be coordinated. Electric vehicles can shift charging. Customer demand can respond to grid conditions. Asset health can be monitored continuously. Operators can work from more detailed system information.
But the digital layer does not replace the physical grid.
A smart grid still depends on sufficient conductors, transformers, substations, generation, storage, protection, and communications. The technology is valuable when it helps those resources work more effectively.
The central challenge is therefore integration.
Sensors must connect to trustworthy data. Data must connect to models. Models must connect to decisions. Decisions must connect to safe control. Control must respect physical constraints. And all of it must remain secure, understandable, and recoverable.
The next article, Microgrids and Distributed Energy Systems, moves from grid-wide digital coordination to local energy systems that can combine generation, storage, controllable loads, islanding, and resilience at campuses, communities, remote sites, and critical facilities.
Related Articles
- Grid Reliability and Resilience
- Transmission and Distribution Systems
- Microgrids and Distributed Energy Systems
- Power-System Operations and Dispatch
- Grid Interconnection and Transmission Planning
- Inverter-Based Resources and Grid Stability
Further Reading
- U.S. Department of Energy. Grid modernization, advanced metering, distribution automation, and grid-resilience resources.
- National Renewable Energy Laboratory. Smart-grid, DER integration, distribution-system, and grid-modernization research.
- Lawrence Berkeley National Laboratory. Electricity markets, demand flexibility, distributed resources, and grid modernization research.
- IEEE Power & Energy Society. Smart-grid, communications, interoperability, power-system, and cybersecurity standards and technical literature.
- Electric Power Research Institute. Distribution automation, DER integration, grid analytics, and utility modernization research.
References
- U.S. Department of Energy. Grid modernization and distribution-system resources. Available at: DOE.
- National Renewable Energy Laboratory. Grid modernization and distributed-energy research. Available at: NREL.
- Lawrence Berkeley National Laboratory. Electricity Markets and Policy research. Available at: Berkeley Lab.
- IEEE Power & Energy Society. Smart-grid and power-system technical resources. Available at: IEEE Power & Energy Society.
- National Institute of Standards and Technology. Smart-grid interoperability and cybersecurity resources. Available at: NIST.