
Last Updated June 22, 2026
Geography, Coordinates, and Computational Mapping in the Islamic World examines how geographic knowledge became calculable through coordinates, routes, tables, descriptions, measurements, instruments, astronomical reference points, and mapmaking traditions. In medieval Islamic-world scholarship, geography was not only a descriptive art. It was also a computational practice: locating places, comparing distances, organizing climates, correcting inherited data, plotting regions, estimating routes, coordinating calendars and directions, and making the earth legible through mathematical representation.
This article treats mapping as algorithmic reasoning. A map is not merely a picture of territory. It is a structured representation built from choices about projection, scale, orientation, coordinates, categories, names, routes, coastlines, rivers, cities, climates, and audiences. A coordinate list is not merely a catalogue. It is a data structure for locating places. A route description is not merely travel writing. It can encode sequences, distances, constraints, and decision points.
The importance of Islamic-world computational mapping is that it shows geography as a bridge between mathematics, astronomy, travel, administration, trade, empire, scholarship, and visual reasoning. Geographic calculation drew on inherited Greek materials, Indian and Persian knowledge, merchant and traveler reports, astronomical measurements, administrative needs, and original correction. It transformed location into data and territory into a procedural field of representation.
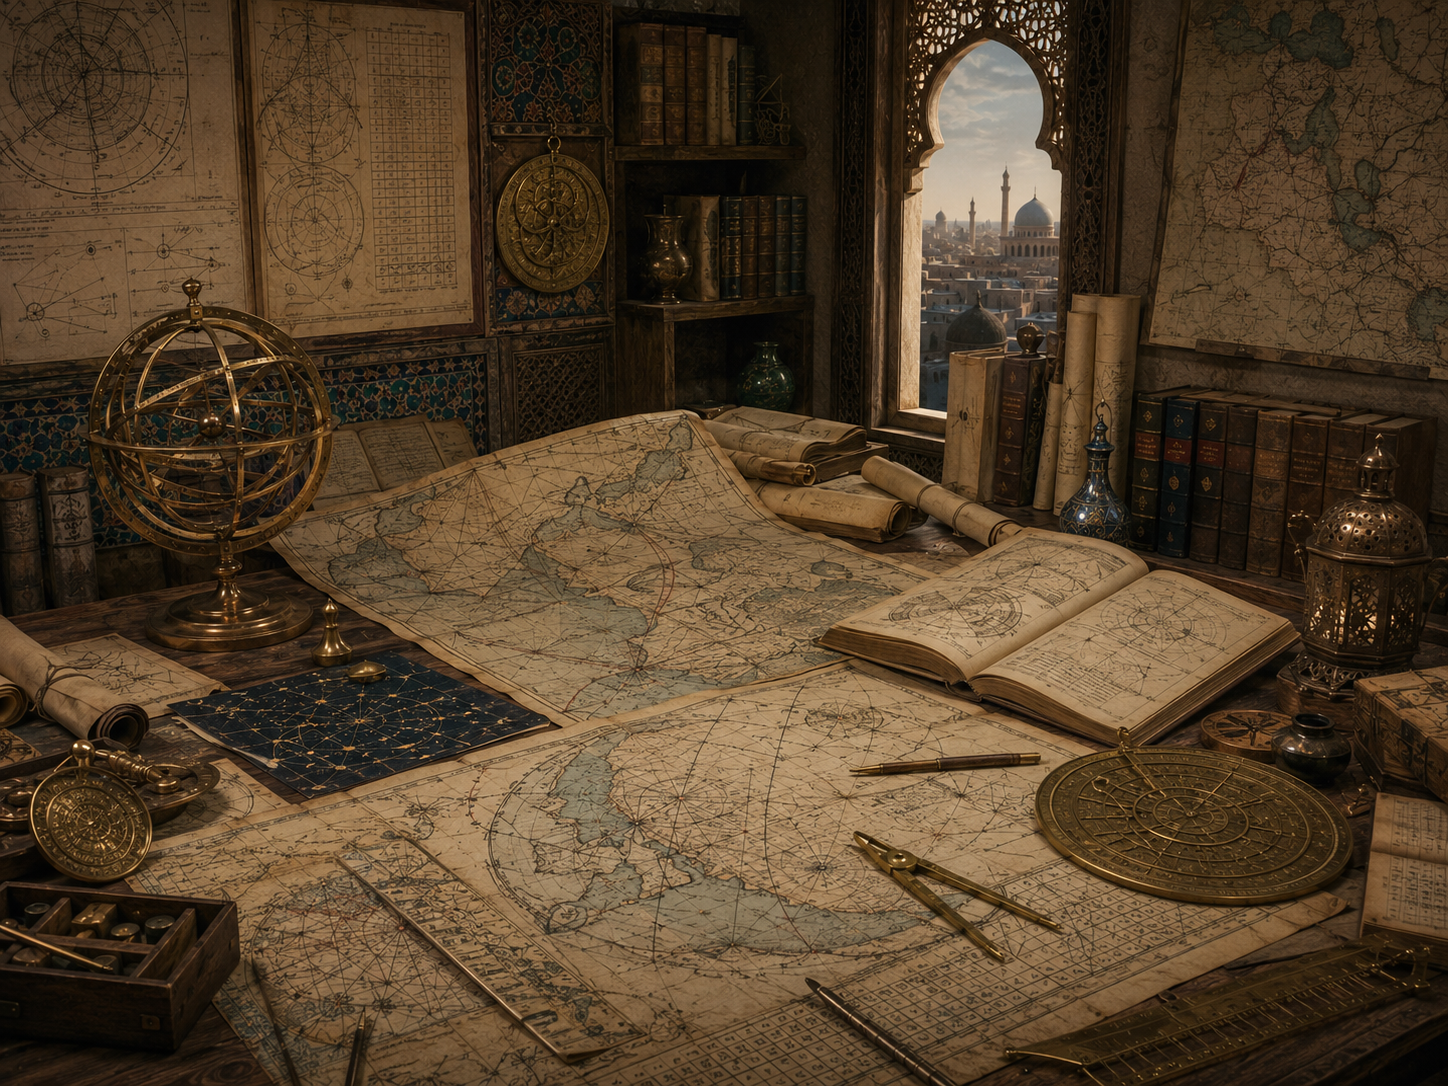
This article introduces mathematical geography, coordinate lists, al-Khwārizmī’s geographical work, Ptolemaic inheritance and correction, latitude and longitude, climates, routes, travel knowledge, cartographic tables, al-Idrīsī, regional mapping, qibla calculation, astronomical reference points, spatial data, projection, scale, direction, administrative geography, commercial networks, manuscript transmission, and the computational logic of maps. It argues that mapping belongs in algorithmic history because it converts the earth into structured data, procedures, and visual reasoning.
Why Computational Mapping Matters
Computational mapping matters because maps are not simple mirrors of the world. They are constructed representations. They decide what counts as a place, how a place is located, how distances are measured, how directions are organized, how regions are classified, and how spatial knowledge is transmitted. Every map contains procedures of selection, transformation, simplification, and interpretation.
In Islamic-world geography, maps and geographic texts often combined mathematics, astronomy, travel reports, administrative needs, trade routes, pilgrimage routes, climatological zones, and inherited coordinate systems. This mixture makes mapping a powerful case study in algorithmic reasoning: it takes complex reality and turns it into structured, usable representation.
| Mapping element | Geographic function | Algorithmic meaning |
|---|---|---|
| Coordinate | Locates a place in a mathematical frame. | Spatial data point. |
| Route | Orders movement between places. | Path or sequence. |
| Climate zone | Classifies regions by latitude or environmental pattern. | Spatial categorization. |
| Map projection | Transforms curved earth to flat surface. | Representation transform. |
| Gazetteer | Lists places with descriptions or coordinates. | Geographic database. |
| Correction | Revises inherited or inconsistent spatial data. | Data cleaning and model maintenance. |
Computational mapping is the art of making location, direction, and territory procedurally knowable.
Geography as Data Structure
A geographic text can function as a data structure. It may list places, coordinates, distances, directions, boundaries, rivers, mountains, seas, cities, routes, and regions. The entries are organized so that a reader can retrieve, compare, and use spatial information.
This is especially important for algorithmic history because a coordinate list resembles a spatial database before digital databases. It stores records. Each record can contain a place name, latitude, longitude, region, feature type, route connection, or descriptive note. The data can be copied, corrected, rearranged, projected, or visualized.
| Geographic record | Possible fields | Computational analogy |
|---|---|---|
| City | Name, latitude, longitude, region, route links. | Point feature. |
| River | Source, course, mouth, regions crossed. | Line feature. |
| Sea | Boundary, coastlines, islands, route access. | Area feature. |
| Mountain | Location, range, regional relation. | Topographic feature. |
| Climate zone | Latitudinal band and regional grouping. | Classification layer. |
| Route | Ordered places, stages, distances, constraints. | Network path. |
When geography is organized into structured records, the map becomes computational before it becomes digital.
Coordinates and the Mathematics of Place
Coordinates turn place into mathematical relation. Instead of describing a city only by story, direction, or political belonging, a coordinate system locates it within a grid. Latitude and longitude create a way to compare places, compute distances approximately, organize maps, and connect geography with astronomy.
Coordinates are algorithmic because they make spatial questions calculable. Which place is farther east? Which lies within a climate band? How might a coastline be drawn from ordered points? How can a table of places be converted into a map? A coordinate system supplies a common frame for these operations.
| Coordinate idea | Geographic use | Algorithmic role |
|---|---|---|
| Latitude | Locates north-south position. | Vertical spatial coordinate. |
| Longitude | Locates east-west position. | Horizontal spatial coordinate. |
| Prime meridian | Defines reference for longitude. | Origin or baseline. |
| Climate band | Groups places by latitudinal zone. | Spatial binning. |
| Coordinate table | Stores place positions. | Structured spatial dataset. |
| Map plotting | Transforms coordinates into visual location. | Rendering procedure. |
Coordinates do not merely describe places; they create a mathematical infrastructure for spatial reasoning.
Al-Khwārizmī and the Description of the Earth
Al-Khwārizmī’s geographical work is important because it shows the same procedural imagination that appears in arithmetic and algebra applied to the earth. His Kitāb Ṣūrat al-Arḍ, often rendered as the Book of the Description/Image of the Earth, organized geographic data in relation to inherited Ptolemaic geography while revising and extending spatial knowledge.
For algorithmic history, the key point is not simply that al-Khwārizmī wrote about geography. It is that geography could be organized as coordinate data, corrected, tabulated, transmitted, and potentially plotted. This is a form of computational representation: places become entries, entries become coordinates, coordinates become a basis for mapping, and mapping becomes a procedure for representing the world.
| Feature of al-Khwārizmī’s geography | Why it matters | Algorithmic meaning |
|---|---|---|
| Coordinate lists | Places are organized with mathematical location. | Spatial records. |
| Ptolemaic inheritance | Earlier data is received and transformed. | Source integration. |
| Correction | Inherited values can be revised. | Data validation. |
| Feature categories | Cities, rivers, seas, mountains, regions, and islands are organized. | Typed spatial data. |
| Mapping basis | Coordinates can support visual reconstruction. | Rendering from data. |
| Transmission | Geographic knowledge moves through manuscripts and later scholarship. | Computational memory. |
Al-Khwārizmī’s geography shows place becoming structured data.
Ptolemy, Correction, and Transmission
Islamic-world geography did not emerge in isolation. It inherited, translated, criticized, corrected, and transformed earlier materials, especially Ptolemaic geography. Ptolemy’s coordinate-based approach provided a powerful framework, but inherited frameworks require evaluation. They may contain distortions, missing information, inaccurate distances, or assumptions that need correction.
Correction is algorithmic work. It compares data against observation, travel knowledge, astronomical measurement, or alternative reports. It identifies error, revises values, reorganizes records, and transmits improved representations. This is close to what modern data work calls cleaning, validation, calibration, and model revision.
| Transmission task | Geographic issue | Computational analogy |
|---|---|---|
| Translate | Move spatial knowledge across language. | Representation conversion. |
| Compare | Set inherited values beside new reports. | Data validation. |
| Correct | Revise inaccurate locations or extents. | Error reduction. |
| Extend | Add places, routes, or regions. | Dataset expansion. |
| Reorganize | Classify by region, climate, route, or coordinate. | Schema redesign. |
| Transmit | Copy, teach, map, and adapt. | Versioned knowledge. |
Transmission is not passive preservation. It is computational maintenance across cultures and media.
Climates, Zones, and Regional Organization
Medieval geography often organized the inhabited world through climates, zones, or regional divisions. These classifications could be connected with latitude, environmental variation, astronomy, political geography, travel knowledge, or textual tradition. A climate system reduces the world’s complexity by grouping places into meaningful bands or regions.
This is algorithmic because classification changes what can be compared. A city can be located not only by coordinate, but by zone. A route can pass through regions. A map can be organized by bands. A table can be sorted by climate and longitude. Regional organization supplies an indexing system for spatial knowledge.
| Spatial classification | Function | Algorithmic role |
|---|---|---|
| Climate band | Groups places by latitudinal relation. | Spatial binning. |
| Region | Groups places by political, cultural, or physical geography. | Category label. |
| Route zone | Organizes travel stages. | Path segmentation. |
| Coastal zone | Groups ports and maritime routes. | Network layer. |
| River basin | Connects places by water system. | Flow structure. |
| Administrative district | Links geography to governance. | Institutional partition. |
Zones and regions turn geography into a searchable, comparable, and administrable structure.
Routes, Distance, and Network Reasoning
Geography is not only about points. It is also about movement between points. Trade, pilgrimage, diplomacy, military planning, postal systems, administration, scholarship, and travel all required knowledge of routes, distances, stages, hazards, ports, roads, and connections.
Routes are algorithmic because they are ordered paths. A route description may say where to begin, which stage follows, how far to travel, what constraint matters, and what destination comes next. A route network turns geography into a graph: places are nodes, roads or sea lanes are edges, and distances or risks are weights.
| Route element | Geographic meaning | Computational analogy |
|---|---|---|
| Place | Stop, city, port, station, or landmark. | Node. |
| Road or sea lane | Connection between places. | Edge. |
| Distance | Cost of travel. | Weight. |
| Stage | Segment of route. | Step in path. |
| Hazard | Constraint or risk. | Penalty or condition. |
| Itinerary | Ordered movement plan. | Path sequence. |
Route knowledge is geographic computation over networks of places.
Al-Idrīsī and Cartographic Synthesis
Al-Idrīsī’s twelfth-century geographical work is one of the most famous examples of medieval cartographic synthesis. Working in the court of Roger II of Sicily, he compiled geographic knowledge from texts, reports, routes, and learned traditions into a major map and descriptive geography. The significance is not only visual. It is computational: information from many sources had to be compared, selected, organized, and represented.
Cartographic synthesis requires procedures. Reports must be reconciled. Regions must be divided. Routes must be compared. Coastlines must be shaped. Descriptions must be linked to places. A map must choose what to include and how to arrange it. This is spatial reasoning at scale.
| Cartographic synthesis task | What it requires | Algorithmic meaning |
|---|---|---|
| Collect reports | Gather geographic evidence from travelers, texts, and local knowledge. | Input aggregation. |
| Compare sources | Identify agreement and conflict. | Data reconciliation. |
| Divide regions | Organize the world into sections. | Spatial partitioning. |
| Draw coastlines | Represent boundaries and forms. | Geometric approximation. |
| Write descriptions | Attach qualitative information to places. | Metadata enrichment. |
| Transmit map | Copy, adapt, and interpret the representation. | Versioned spatial artifact. |
Al-Idrīsī’s work reminds us that mapping is a procedure for synthesizing evidence, not only drawing outlines.
Qibla, Timekeeping, and Directional Calculation
Geography in Islamic contexts was often connected to religious, astronomical, and institutional needs. Qibla calculation required directional reasoning toward Mecca. Prayer-time calculation required local solar relations. Calendrical questions required timekeeping. These practices connected geography with spherical reasoning, astronomy, instruments, tables, and practical methods.
Directional calculation is algorithmic because it asks for a procedure: given a location, determine a direction. The input is a place. The output is an orientation. The method may involve geometry, astronomy, tables, instruments, or approximate rules. The result is applied in practice.
| Directional problem | Input | Output | Algorithmic issue |
|---|---|---|---|
| Qibla | Local position and reference to Mecca. | Direction of orientation. | Spatial transformation. |
| Prayer time | Place, date, sun position, horizon condition. | Time interval. | Local astronomical computation. |
| Route direction | Origin, destination, terrain, sea or road. | Path or bearing. | Path selection. |
| Calendar conversion | Date and calendar system. | Equivalent date or cycle position. | Temporal mapping. |
| Instrument use | Observation and location. | Measured or inferred direction. | Human-tool procedure. |
| Approximate rule | Limited data or practical setting. | Usable estimate. | Approximation under constraint. |
Directional calculation shows geography as applied spatial computation.
Projection, Scale, and Map Choice
Every map transforms the earth. A curved surface must be represented on a flat page, a manuscript folio, a diagram, a sectional map, or a circular image. Projection and scale are not decorative choices. They determine what kind of distortion is tolerated, what purpose the map serves, and what kinds of reasoning the map supports.
Algorithmically, projection is a transformation from one coordinate system to another. Scale is a compression rule. Orientation is a convention. Omission is a filtering decision. Classification is a layer. A map is therefore a bundle of transformations.
| Map choice | What it changes | Computational analogy |
|---|---|---|
| Projection | Transforms globe-like relations onto a flat surface. | Coordinate transformation. |
| Scale | Compresses large territory into small space. | Resolution control. |
| Orientation | Defines what direction appears up or central. | Reference convention. |
| Centering | Prioritizes one region or frame. | Viewpoint selection. |
| Classification | Groups features into kinds. | Layer schema. |
| Omission | Leaves some features out. | Filtering. |
Maps are algorithms of attention: they compute what can be seen, compared, and used.
Administration, Commerce, and Spatial Order
Mapping matters institutionally because territory matters. Trade routes, tax districts, roads, ports, cities, frontiers, pilgrimage routes, water systems, agricultural zones, and administrative regions all require spatial knowledge. Geography can therefore serve commerce, governance, scholarship, travel, and planning.
This does not make geography neutral. Spatial representation can support navigation and learning, but it can also support control, taxation, military movement, extraction, boundary-making, and administrative power. Computational mapping must therefore be studied as both knowledge and institution.
| Institutional use | Spatial calculation | Governance issue |
|---|---|---|
| Trade | Routes, ports, distances, markets. | Movement of goods and value. |
| Administration | Districts, cities, boundaries, taxes. | Territorial management. |
| Pilgrimage | Routes, direction, distance, lodging. | Coordinated movement and ritual geography. |
| Agriculture | Water, land, climate, seasons. | Resource planning. |
| Scholarship | Coordinates, maps, texts, instruments. | Transmission of spatial knowledge. |
| Military and diplomacy | Roads, borders, cities, terrain. | Power and movement. |
Spatial knowledge is never only spatial. It organizes action.
Manuscripts, Copying, and Spatial Transmission
Geographic knowledge traveled through manuscripts, maps, tables, route books, administrative records, travel writing, astronomical handbooks, teaching traditions, and later translations. Copying a map or coordinate list is not simple reproduction. It can introduce errors, corrections, regional adaptations, omissions, and reinterpretations.
Spatial transmission is computational because data must survive movement across media. Names change. Coordinates shift. Routes are updated. Maps are redrawn. New places are added. Older claims are corrected. A geographic manuscript is therefore a versioned spatial artifact.
| Transmission issue | Geographic effect | Computational analogy |
|---|---|---|
| Copying error | Coordinate, name, or feature may be distorted. | Data corruption. |
| Correction | Known error is revised. | Patch or update. |
| Translation | Names and descriptions move across languages. | Encoding conversion. |
| Regional adaptation | Local knowledge modifies the representation. | Localization. |
| Map redrawing | Geometry and emphasis change. | Rendering variation. |
| Commentary | Instructions and meaning are clarified. | Documentation. |
Every copied map is also a computational event: data is preserved, transformed, or lost.
From Medieval Coordinate Lists to Modern GIS
Modern geographic information systems use coordinates, layers, projections, metadata, databases, routes, networks, distance functions, and visualization tools. Medieval Islamic-world geography is not GIS in the modern sense, but it belongs to the deeper history of spatial computation because it organized geographic knowledge into structured, reusable, and transformable forms.
The continuity lies in the computational problem: how do we represent the earth so that people can reason about location, movement, region, and distance? The tools have changed dramatically. The underlying representational challenge remains familiar.
| Medieval spatial practice | Modern counterpart | Continuity |
|---|---|---|
| Coordinate list | Geospatial database. | Places stored as structured data. |
| Map projection | Coordinate reference system. | Transformation from earth to map. |
| Route description | Network routing. | Ordered movement through nodes. |
| Climate zone | Spatial classification layer. | Regions grouped by attribute. |
| Manuscript correction | Data cleaning and version control. | Spatial data maintenance. |
| Map commentary | Metadata and documentation. | Context required for use. |
Computational mapping has always depended on the same core question: how should the world be represented so that action becomes possible?
Origin Stories and Careful Interpretation
Geography, coordinates, and mapping in the Islamic world should not be turned into a single-origin story. Islamic-world geography drew from Greek, Persian, Indian, Arabic, Syriac, local, maritime, administrative, and traveler knowledge. It also produced original corrections, syntheses, maps, route systems, instruments, and textual traditions. The point is not to replace one origin myth with another. The point is to trace how spatial knowledge was translated, tested, reorganized, and used.
Careful interpretation also avoids treating maps as neutral. Maps simplify, center, omit, classify, and persuade. A coordinate list may look objective, but it depends on measurement methods, reference points, transmission, and selection. Computational mapping must always be read as both mathematics and worldview.
| Oversimplification | Problem | Better framing |
|---|---|---|
| Maps simply copy reality. | It ignores projection, selection, and scale. | Study maps as constructed representations. |
| Coordinates are purely objective. | It ignores reference systems and measurement limits. | Study coordinates as structured but situated data. |
| Islamic geography only preserved Ptolemy. | It ignores correction, adaptation, and synthesis. | Study inheritance and transformation together. |
| Travel reports are not computational. | They can encode routes, distances, and constraints. | Study route knowledge as network reasoning. |
| Modern GIS is completely new. | It ignores long histories of spatial data. | Compare continuity and difference carefully. |
| Maps are neutral tools. | They can support power, trade, learning, and control. | Ask who maps, for whom, and for what purpose. |
A careful history treats mapping as mathematical, institutional, cultural, and computational at once.
Examples of Computational Mapping
The examples below show how geography, coordinates, and mapping can be understood as algorithmic reasoning.
Coordinate plotting
A place name and coordinate pair become a point in a mathematical frame.
Route sequencing
A travel path is represented as ordered stages between places.
Climate classification
Regions are grouped by latitude, environment, or inherited geographical scheme.
Coastline reconstruction
Ordered points and descriptions support a visual representation of boundary.
Qibla calculation
A local position is transformed into directional orientation toward a reference place.
Map correction
Inherited coordinates or extents are revised using additional evidence.
Cartographic synthesis
Texts, reports, routes, tables, and maps are reconciled into a larger representation.
Spatial metadata
Descriptions, names, regions, and uses attach meaning to coordinate records.
Across these examples, mapping appears as structured transformation from place to usable spatial knowledge.
Mathematics, Computation, and Modeling
A place record can be modeled as:
Place = (Name, Latitude, Longitude, Region, Feature\ Type)
\]
Interpretation: A geographic entry can be treated as structured spatial data.
A route can be modeled as:
Route = [Place_1, Place_2, \ldots, Place_n]
\]
Interpretation: A route is an ordered sequence through a spatial network.
A distance approximation between nearby coordinate points can be represented as:
d \approx R\sqrt{(\Delta \phi)^2 + (\cos \bar{\phi}\Delta \lambda)^2}
\]
Interpretation: Modern notation helps show how coordinate differences can support approximate spatial calculation.
A mapping pipeline can be written as:
Reports + Coordinates + Categories + Projection + Scale \rightarrow Map
\]
Interpretation: A map is produced by combining evidence, structure, transformation, and design choice.
These formulas use modern notation to make spatial procedure visible. They are interpretive models, not claims that medieval authors used this exact symbolic form.
Python Workflow: Computational Mapping Procedure Map
The Python workflow below creates a dependency-light interpretive map of geography, coordinates, and computational mapping in the Islamic world. It scores themes by spatial representation, coordinate structure, procedural clarity, institutional use, correction awareness, transmission importance, and modern resonance, then writes reproducible CSV and JSON outputs.
# geography_coordinates_computational_mapping_map.py
# Dependency-light workflow for mapping geography and coordinates as computational reasoning.

from __future__ import annotations

from dataclasses import asdict, dataclass
from pathlib import Path
from statistics import mean
import csv
import json
from datetime import datetime, timezone

ARTICLE_ROOT = Path(__file__).resolve().parents[1]
TABLES = ARTICLE_ROOT / "outputs" / "tables"
JSON_DIR = ARTICLE_ROOT / "outputs" / "json"


@dataclass(frozen=True)
class ComputationalMappingConfig:
    article: str = "geography_coordinates_and_computational_mapping_in_the_islamic_world"
    core_threshold: float = 0.80
    high_spatial_threshold: float = 0.86


def timestamp_utc() -> str:
    return datetime.now(timezone.utc).isoformat()


def write_csv(path: Path, rows: list[dict[str, object]]) -> None:
    path.parent.mkdir(parents=True, exist_ok=True)
    if not rows:
        path.write_text("", encoding="utf-8")
        return
    fieldnames = sorted({key for row in rows for key in row.keys()})
    with path.open("w", newline="", encoding="utf-8") as handle:
        writer = csv.DictWriter(handle, fieldnames=fieldnames, extrasaction="ignore")
        writer.writeheader()
        writer.writerows(rows)


def write_json(path: Path, payload: object) -> None:
    path.parent.mkdir(parents=True, exist_ok=True)
    path.write_text(json.dumps(payload, indent=2, sort_keys=True), encoding="utf-8")


def computational_mapping_themes() -> list[dict[str, object]]:
    return [
        {"theme_id": "coordinates_as_spatial_data", "spatial_representation": 0.98, "coordinate_structure": 0.98, "procedural_clarity": 0.88, "institutional_use": 0.86, "correction_awareness": 0.90, "transmission_importance": 0.90, "modern_resonance": 0.96},
        {"theme_id": "al_khwarizmi_geographical_tables", "spatial_representation": 0.94, "coordinate_structure": 0.96, "procedural_clarity": 0.88, "institutional_use": 0.84, "correction_awareness": 0.92, "transmission_importance": 0.94, "modern_resonance": 0.94},
        {"theme_id": "routes_as_network_reasoning", "spatial_representation": 0.90, "coordinate_structure": 0.78, "procedural_clarity": 0.92, "institutional_use": 0.94, "correction_awareness": 0.82, "transmission_importance": 0.88, "modern_resonance": 0.94},
        {"theme_id": "climates_and_regional_classification", "spatial_representation": 0.88, "coordinate_structure": 0.84, "procedural_clarity": 0.86, "institutional_use": 0.88, "correction_awareness": 0.82, "transmission_importance": 0.88, "modern_resonance": 0.90},
        {"theme_id": "al_idrisi_cartographic_synthesis", "spatial_representation": 0.96, "coordinate_structure": 0.84, "procedural_clarity": 0.88, "institutional_use": 0.90, "correction_awareness": 0.88, "transmission_importance": 0.94, "modern_resonance": 0.92},
        {"theme_id": "qibla_and_directional_calculation", "spatial_representation": 0.90, "coordinate_structure": 0.88, "procedural_clarity": 0.94, "institutional_use": 0.96, "correction_awareness": 0.86, "transmission_importance": 0.88, "modern_resonance": 0.94},
        {"theme_id": "projection_scale_and_map_choice", "spatial_representation": 0.94, "coordinate_structure": 0.90, "procedural_clarity": 0.86, "institutional_use": 0.86, "correction_awareness": 0.90, "transmission_importance": 0.84, "modern_resonance": 0.96},
    ]


def score_theme(row: dict[str, object], config: ComputationalMappingConfig) -> dict[str, object]:
    mapping_score = mean([
        float(row["spatial_representation"]),
        float(row["coordinate_structure"]),
        float(row["procedural_clarity"]),
        float(row["institutional_use"]),
        float(row["correction_awareness"]),
        float(row["transmission_importance"]),
        float(row["modern_resonance"]),
    ])

    if mapping_score >= config.core_threshold and float(row["spatial_representation"]) >= config.high_spatial_threshold:
        interpretive_status = "core_computational_mapping_thread"
    elif mapping_score >= config.core_threshold:
        interpretive_status = "major_computational_mapping_thread"
    else:
        interpretive_status = "supporting_computational_mapping_thread"

    return {
        "theme_id": row["theme_id"],
        "spatial_representation": round(float(row["spatial_representation"]), 6),
        "coordinate_structure": round(float(row["coordinate_structure"]), 6),
        "procedural_clarity": round(float(row["procedural_clarity"]), 6),
        "institutional_use": round(float(row["institutional_use"]), 6),
        "correction_awareness": round(float(row["correction_awareness"]), 6),
        "transmission_importance": round(float(row["transmission_importance"]), 6),
        "modern_resonance": round(float(row["modern_resonance"]), 6),
        "mapping_score": round(mapping_score, 6),
        "interpretive_status": interpretive_status,
    }


def interpretation_cautions() -> list[dict[str, str]]:
    return [
        {"caution": "do_not_treat_maps_as_mirrors", "meaning": "Maps are constructed representations shaped by projection, scale, selection, and purpose."},
        {"caution": "do_not_treat_coordinates_as_context_free", "meaning": "Coordinates depend on reference systems, measurement practices, copying, and correction."},
        {"caution": "do_not_reduce_islamic_geography_to_preservation", "meaning": "Islamic-world geography inherited, corrected, extended, and synthesized earlier materials."},
        {"caution": "do_not_ignore_routes_and_networks", "meaning": "Geographic computation includes movement, sequence, distance, and connection."},
        {"caution": "do_not_project_modern_gis_backward", "meaning": "Medieval coordinate lists and maps are spatial-computational artifacts, but not modern GIS."},
    ]


def main() -> None:
    config = ComputationalMappingConfig()
    themes = computational_mapping_themes()
    scored = [score_theme(row, config) for row in themes]
    cautions = interpretation_cautions()

    summary = {
        "article": config.article,
        "timestamp_utc": timestamp_utc(),
        "themes_reviewed": len(scored),
        "core_threads": sum(1 for row in scored if row["interpretive_status"] == "core_computational_mapping_thread"),
        "major_threads": sum(1 for row in scored if row["interpretive_status"] == "major_computational_mapping_thread"),
        "supporting_threads": sum(1 for row in scored if row["interpretive_status"] == "supporting_computational_mapping_thread"),
        "mean_mapping_score": round(mean(float(row["mapping_score"]) for row in scored), 6),
        "cautions": len(cautions),
        "interpretation": "Computational mapping should be studied as spatial algorithmic reasoning: coordinates, routes, regions, projections, correction, transmission, and institutional use.",
    }

    write_csv(TABLES / "computational_mapping_themes.csv", themes)
    write_csv(TABLES / "computational_mapping_map.csv", scored)
    write_csv(TABLES / "interpretation_cautions.csv", cautions)
    write_csv(TABLES / "computational_mapping_summary.csv", [summary])

    write_json(JSON_DIR / "computational_mapping_config.json", asdict(config))
    write_json(JSON_DIR / "computational_mapping_map.json", scored)
    write_json(JSON_DIR / "interpretation_cautions.json", cautions)
    write_json(JSON_DIR / "computational_mapping_summary.json", summary)

    print("Geography, coordinates, and computational mapping map complete.")
    print(TABLES / "computational_mapping_summary.csv")


if __name__ == "__main__":
    main()
This workflow turns geographic mapping into a reproducible interpretive artifact: spatial representation, coordinate structure, procedural clarity, institutional use, correction awareness, transmission importance, modern resonance, mapping score, and historical caution are documented together.
R Workflow: Computational Mapping Diagnostics
The R workflow reads the generated CSV outputs, summarizes computational mapping themes, visualizes theme dimensions, and writes an additional diagnostic table.
# geography_coordinates_computational_mapping_summary.R
args <- commandArgs(trailingOnly = FALSE)
file_arg <- grep("^--file=", args, value = TRUE)

if (length(file_arg) > 0) {
  script_path <- normalizePath(sub("^--file=", "", file_arg[1]), mustWork = TRUE)
  article_root <- normalizePath(file.path(dirname(script_path), ".."), mustWork = TRUE)
} else {
  article_root <- getwd()
}

setwd(article_root)

tables_dir <- file.path(article_root, "outputs", "tables")
figures_dir <- file.path(article_root, "outputs", "figures")
dir.create(tables_dir, recursive = TRUE, showWarnings = FALSE)
dir.create(figures_dir, recursive = TRUE, showWarnings = FALSE)

map_path <- file.path(tables_dir, "computational_mapping_map.csv")
summary_path <- file.path(tables_dir, "computational_mapping_summary.csv")

if (!file.exists(map_path)) {
  stop(paste("Missing", map_path, "Run the Python workflow first."))
}

mapping_map <- read.csv(map_path, stringsAsFactors = FALSE)
summary <- read.csv(summary_path, stringsAsFactors = FALSE)

png(file.path(figures_dir, "computational_mapping_dimensions.png"), width = 1200, height = 850)
score_matrix <- t(as.matrix(mapping_map[, c("spatial_representation", "coordinate_structure", "procedural_clarity", "institutional_use", "correction_awareness", "transmission_importance", "modern_resonance")]))
barplot(score_matrix,
        beside = TRUE,
        names.arg = mapping_map$theme_id,
        las = 2,
        ylim = c(0, 1),
        ylab = "Interpretive Score",
        main = "Geography, Coordinates, and Computational Mapping Dimensions")
legend("bottomright",
       legend = rownames(score_matrix),
       cex = 0.72,
       bty = "n")
grid()
dev.off()

png(file.path(figures_dir, "mapping_score_by_theme.png"), width = 1000, height = 750)
barplot(mapping_map$mapping_score,
        names.arg = mapping_map$theme_id,
        las = 2,
        ylab = "Mapping Score",
        main = "Computational Mapping Score by Theme")
grid()
dev.off()

r_summary <- data.frame(
  themes_reviewed = summary$themes_reviewed[1],
  core_threads = summary$core_threads[1],
  major_threads = summary$major_threads[1],
  supporting_threads = summary$supporting_threads[1],
  mean_mapping_score = summary$mean_mapping_score[1],
  cautions = summary$cautions[1],
  diagnostic_note = "Computational mapping should be studied as spatial algorithmic reasoning: coordinates, routes, regions, projections, correction, transmission, and institutional use."
)

write.csv(r_summary, file.path(tables_dir, "r_computational_mapping_diagnostic_summary.csv"), row.names = FALSE)
print(r_summary)
The R layer makes the interpretive structure visible: coordinates, al-Khwārizmī’s geography, routes, climate zones, al-Idrīsī, qibla, projection, scale, correction, and transmission can be examined as related but distinct dimensions of computational mapping.
GitHub Repository
The companion repository contains reproducible workflows, synthetic interpretive data, outputs, calculators, documentation, and multilingual examples for this article.
Complete Code Repository
Companion article folder with Python, R, Julia, SQL, Haskell, C, C++, Fortran, Rust, Go, Java, TypeScript, Prolog, Racket, notebooks, documentation, synthetic teaching data, generated outputs, schemas, calculators, and Canvas-ready workflow artifacts for geography, coordinates, computational mapping, Islamic-world cartography, al-Khwārizmī’s geographical tables, Ptolemaic correction, al-Idrīsī, routes, climate zones, qibla calculation, projections, scale, route networks, spatial data, map transmission, and spatial algorithmic reasoning.
A Practical Method for Studying Computational Mapping
A careful study of computational mapping should ask how spatial knowledge is represented, transformed, transmitted, and used. The method below treats maps and coordinate lists as structured artifacts.
| Step | Historical action | Output |
|---|---|---|
| 1 | Identify the map, coordinate list, route text, gazetteer, or geographical description. | Spatial artifact record. |
| 2 | Extract place names, feature types, coordinates, routes, regions, or descriptions. | Spatial data table. |
| 3 | Identify the reference frame: latitude, longitude, climate zone, orientation, or route order. | Coordinate or classification model. |
| 4 | Determine the procedure: lookup, plotting, correction, route sequencing, projection, or classification. | Mapping procedure. |
| 5 | Track corrections, inconsistencies, omissions, and possible source conflicts. | Data-quality record. |
| 6 | Ask who uses the representation: scholar, traveler, administrator, merchant, jurist, teacher, or ruler. | Institutional context. |
| 7 | Study copying, translation, redrawing, commentary, and localization. | Transmission map. |
| 8 | Compare with modern geospatial computation only after understanding the historical representation. | Interpretive bridge. |
This method treats geography as data, procedure, image, text, and institution at once.
Common Pitfalls
The first pitfall is treating maps as neutral pictures. The second is treating coordinates as context-free facts. The third is treating Islamic-world geography only as preservation of Ptolemy rather than correction, synthesis, and extension. The fourth is projecting modern GIS backward too directly.
| Pitfall | Why it matters | Better practice |
|---|---|---|
| Maps mirror reality | It hides selection, projection, and scale. | Study maps as constructed representations. |
| Coordinates are context-free | They depend on measurement, reference systems, and copying. | Track reference frame and transmission. |
| Route texts are merely narrative | They may encode sequences, distances, and constraints. | Analyze route structure. |
| Islamic geography only preserves earlier work | It ignores correction, synthesis, and original contribution. | Study inheritance and transformation together. |
| Modern GIS is the obvious comparison | It can distort historical media. | Compare carefully without collapsing difference. |
| Maps are politically neutral | Spatial representation can support administration, trade, learning, and power. | Ask who maps, for whom, and why. |
Computational mapping becomes clearer when maps are read as procedures, not just images.
Why Computational Mapping Belongs in Algorithmic Reasoning
Geography, coordinates, and computational mapping in the Islamic world belong in algorithmic reasoning because they show how place becomes data and how territory becomes representation. Coordinates locate. Routes sequence. Zones classify. Projections transform. Tables store. Corrections revise. Maps synthesize. Institutions use the result.
This history broadens the meaning of computation. Computation is not only arithmetic, algebra, or machine execution. It is also the disciplined organization of spatial knowledge so that people can reason about where things are, how they connect, how far apart they lie, and how they can be represented.
The lesson for modern systems is direct. Every geospatial model depends on reference frames, data quality, projection, scale, classification, documentation, and institutional purpose. Medieval Islamic-world mapping reminds us that spatial computation has always been both mathematical and cultural. AI belongs in the toolkit, not in control.
Related Articles
- Astronomical Tables, Calendars, and Algorithmic Prediction
- Al-Kindī, Cryptanalysis, and Statistical Reasoning
- Al-Khwārizmī, Algorism, and the Procedural Imagination
- Hindu-Arabic Numerals and the Transmission of Positional Calculation
- Algorithms in Climate, Energy, and Infrastructure
Further Reading
- Harley, J.B. and Woodward, D. (eds.) (1992) The History of Cartography, Volume 2, Book 1: Cartography in the Traditional Islamic and South Asian Societies. Chicago: University of Chicago Press.
- King, D.A. (1999) World-Maps for Finding the Direction and Distance to Mecca. Leiden: Brill.
- Kennedy, E.S. (1983) ‘Mathematical geography’, in Rashed, R. (ed.) Encyclopedia of the History of Arabic Science. London: Routledge.
- Edson, E. and Savage-Smith, E. (2004) Medieval Views of the Cosmos. Oxford: Bodleian Library.
- al-Idrīsī (trans. 1970) Opus Geographicum. Naples and Rome: Istituto Universitario Orientale.
- MacTutor History of Mathematics (n.d.) ‘Cartography’. University of St Andrews.
- Library of Congress (2021) ‘The Islamic World Map of 1154’.
References
- Edson, E. and Savage-Smith, E. (2004) Medieval Views of the Cosmos. Oxford: Bodleian Library.
- Harley, J.B. and Woodward, D. (eds.) (1992) The History of Cartography, Volume 2, Book 1: Cartography in the Traditional Islamic and South Asian Societies. Chicago: University of Chicago Press.
- Kennedy, E.S. (1983) ‘Mathematical geography’, in Rashed, R. (ed.) Encyclopedia of the History of Arabic Science. London: Routledge.
- King, D.A. (1999) World-Maps for Finding the Direction and Distance to Mecca. Leiden: Brill.
- Library of Congress (2021) ‘The Islamic World Map of 1154’. Available at: https://blogs.loc.gov/loc/2021/08/the-islamic-world-map-of-1154/.
- Library of Congress (2022) ‘Al-Idrisi’s Masterpiece of Medieval Geography’. Available at: https://blogs.loc.gov/maps/2022/01/al-idrisis-masterpiece-of-medieval-geography/.
- MacTutor History of Mathematics (n.d.) ‘Cartography’. University of St Andrews. Available at: https://mathshistory.st-andrews.ac.uk/HistTopics/Cartography/.
- Rapoport, Y. and Savage-Smith, E. (eds.) (2018) An Eleventh-Century Egyptian Guide to the Universe: The Book of Curiosities. Leiden: Brill.