
Last Updated May 8, 2026
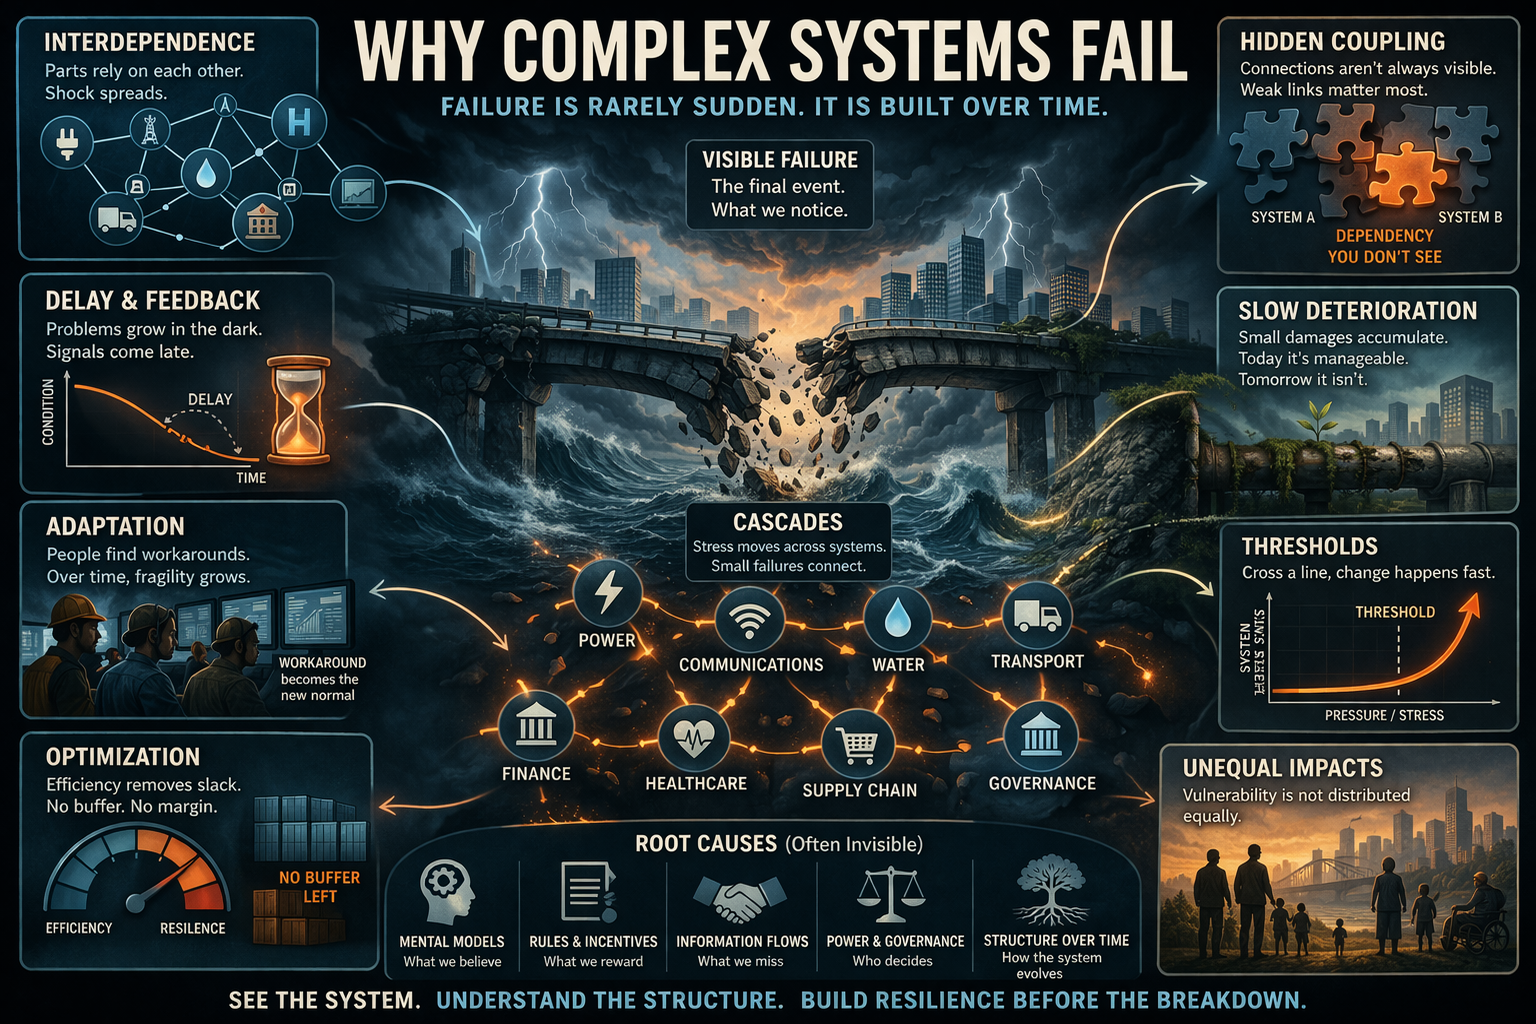
Complex systems fail for reasons that are usually deeper than a single broken part, a single bad decision, or a single external shock. In tightly connected ecological, infrastructural, institutional, technological, and socio-economic systems, failure often emerges through interaction rather than isolation. Small disturbances can propagate across networks. Delays can conceal deteriorating conditions until response becomes difficult. Local adaptations can create system-wide side effects. Protective measures in one domain can shift fragility elsewhere. What appears to be a sudden breakdown is often the visible expression of pressures that have been accumulating for a long time beneath the surface.
This is why complex systems cannot be understood through simple linear models of cause and effect. They are shaped by interdependence, feedback, path dependence, hidden coupling, uneven information, changing behavior, institutional incentives, and slow erosion of capacity. A system may seem stable because routine disturbances are managed successfully, yet that same history of apparent success may conceal the gradual loss of slack, diversity, redundancy, public capacity, maintenance discipline, or ecological buffering. Failure, in such systems, is rarely just the opposite of normal operation. It is often produced by the very arrangements that once made ordinary success possible.
Main Library
Publications
Article Map
Risk & Resilience
Foundation
Risk & Resilience
Previous Article
Response Pathways
Related Topic
Systems Thinking

This article examines why complex systems fail and why that failure is so often misunderstood. It builds on What Are Risk and Resilience in Sustainable Systems?, Risk, Uncertainty, and Complexity, Vulnerability, Exposure, and Sensitivity, Resilience, Robustness, and Antifragility, and Adaptation, Recovery, and Transformation by asking how breakdown emerges from interaction, adaptation, and structure.
The central argument is that complex failure is usually produced before the triggering event occurs. Triggers reveal fragility, but they rarely create it from nothing. Failure emerges when interdependence, hidden coupling, delayed feedback, normalized strain, lost slack, weak monitoring, and governance fragmentation combine with external stress. A serious failure analysis therefore has to look below the visible incident and ask how the system became vulnerable to that incident in the first place.
Failure Is Often Structural
When complex systems fail, analysts often search immediately for a triggering event: the storm, the software error, the equipment breakdown, the market shock, the administrative mistake, the cyberattack, the drought, or the missed warning. Triggers matter, but they rarely explain the whole event. A trigger becomes consequential because it interacts with existing conditions of exposure, vulnerability, weak monitoring, degraded buffers, institutional delay, or tightly coupled dependencies.
In this sense, failure is often structural before it becomes visible. The visible event is the point at which hidden weaknesses are forced into the open. A flood damages a neighborhood not only because water arrives, but because housing, drainage, land use, public finance, maintenance, emergency response, and social protection shaped the consequences in advance. A power outage becomes a public-health emergency because hospitals, water systems, communications, transport, and emergency coordination are interdependent. A supply-chain disruption becomes systemic because inventories, sourcing, logistics, finance, and institutional assumptions have been optimized around uninterrupted flow.
Systems thinking helps clarify this point by shifting attention from isolated events to patterns, structures, rules, feedbacks, and mental models. Donella Meadows emphasized that surface events are produced by deeper system structures: information flows, incentives, delays, feedback loops, purposes, and rules. If analysis remains confined to the event, it will tend to treat failure as an anomaly rather than as a product of the system’s underlying architecture.
This is why a complex failure should never be treated simply as bad luck. The important question is not only what happened, but what structures made the event consequential. What dependencies had accumulated? What buffers had been removed? What signals were ignored? What adaptations had normalized risk? What institutional incentives rewarded short-term efficiency over long-term resilience? What communities bore the consequences first?
Those questions move failure analysis from blame alone toward system diagnosis. Accountability still matters, but complex failure cannot be understood honestly if accountability is reduced to finding one broken part or one mistaken individual. The deeper task is to understand how the system made failure likely, difficult to detect, difficult to contain, and unevenly distributed.
Interdependence and Hidden Coupling
One of the main reasons complex systems fail is that their parts are interdependent in ways that are not always visible until stress arrives. A power network depends on communications, fuel supply, skilled labor, cyber systems, cooling, finance, and transport access. A hospital depends on electricity, water, digital records, staffing, pharmaceuticals, procurement, sanitation, public trust, and emergency communications. A food system depends on climate, logistics, energy, storage, finance, labor, soil, water, seed systems, markets, and governance. When one part is disrupted, the effect can reverberate far beyond its original location.
Interdependence increases performance and coordination under ordinary conditions. It allows systems to specialize, scale, accelerate, and coordinate across distance. But it also widens the pathways through which disruption travels. A local failure can become a regional failure if the network is tightly coupled. A technical disruption can become a social disruption if institutions depend on the same technical system. A climate hazard can become an economic, public-health, political, and ecological crisis if the affected systems are densely connected.
Hidden coupling makes matters worse. Systems may appear separate in administrative charts while remaining deeply connected in operation. An organization may believe it has diversified risk, yet multiple subsystems may still rely on the same upstream service, cloud provider, water source, logistics corridor, software dependency, financing model, maintenance contractor, or institutional procedure. A city may treat power, water, transport, healthcare, and communications as separate sectors, even though emergency functioning depends on all of them at once.
Under ordinary conditions, such coupling may remain invisible. Under stress, it can turn local breakdown into systemic failure. This is one reason post-crisis analysis often discovers dependencies that should have been visible earlier but were not mapped, monitored, or taken seriously. Hidden coupling means that systems are frequently more fragile than their formal diagrams suggest.
A serious resilience strategy therefore has to map not only assets, but dependencies. It has to ask which systems rely on which other systems, where common-mode failures exist, which services lack substitutes, which nodes are critical, and which forms of efficiency have created concentrated vulnerability. Without that dependency mapping, institutions may strengthen individual parts while leaving the network as a whole exposed.
Delay, Feedback, and Invisible Deterioration
Complex systems also fail because deterioration is often delayed, indirect, and difficult to observe. Feedback loops can amplify or dampen change, but their effects may not appear immediately. A system may be slowly losing resilience through deferred maintenance, ecological degradation, institutional erosion, staff burnout, public distrust, debt accumulation, or declining redundancy while still appearing functional in daily operation. By the time visible breakdown appears, the underlying deterioration may already be advanced.
Delay creates a dangerous gap between cause and consequence. The decisions that increase fragility may be made years before failure occurs. Land-use patterns, infrastructure neglect, policy centralization, biodiversity loss, erosion of redundancy, chronic underfunding, weakened enforcement, or loss of institutional memory may all seem manageable until a disturbance arrives that reveals how much resilience has already been lost. Because consequences are delayed, institutions often underestimate the cumulative effects of their own choices.
Feedback loops intensify this problem. A system under pressure may respond by cutting maintenance to preserve short-term budgets. That creates more future failures, which create more emergency costs, which further reduce maintenance capacity. A public institution may respond to overload through informal workarounds, which allow performance to continue, which hides the need for structural reform, which deepens the strain on staff. A watershed may absorb degradation for years until threshold behavior makes collapse appear sudden.
The most dangerous deterioration is often the kind that allows ordinary operation to continue. Systems can keep functioning while losing the capacity to absorb the next shock. This is why resilience analysis must pay attention to slow variables and weak signals. Maintenance backlogs, staff turnover, ecosystem decline, delayed repairs, repeated near misses, rising emergency expenditures, informal workarounds, declining trust, and recurring small failures may all indicate that the system is becoming fragile even when the dashboard still looks acceptable.
Failure analysis should therefore examine what the system was signaling before the incident. What warnings were present but discounted? Which signals were fragmented across agencies? Which metrics gave false reassurance? Which forms of deterioration were too slow, too distributed, or too politically inconvenient to trigger response? These questions are essential because complex systems often fail not from absence of information, but from failure to interpret and act on information in time.
Adaptation Can Create Fragility
Another reason complex systems fail is that actors inside them are constantly adapting, but those adaptations are not always system-improving. People and organizations adjust to constraints, incentives, shortages, and local pressures in ways that make immediate success possible. Over time, however, those same adaptations can create hidden fragility. Workarounds become normal practice. Informal dependence replaces robust design. Slack is removed because teams appear to be coping. Repeated success under strain creates the illusion that the system is safer than it really is.
Resilience engineering is useful here because it argues that both success and failure can emerge from the same adaptive processes. Complex socio-technical systems cannot be fully specified in advance. People succeed by adjusting to variable conditions, making trade-offs, improvising, reprioritizing, and filling gaps between formal procedure and operational reality. This adaptive capacity is valuable. It is often what keeps systems functioning under pressure.
But adaptation can become dangerous when it hides structural weakness. A hospital may cope with staffing shortages through overtime and informal coordination. A city agency may handle repeated infrastructure problems through emergency patches. A supply chain may adjust to shortages through expedited shipping and substitute suppliers. A software team may manage technical debt through workarounds. A public institution may preserve service delivery through exhausted staff. Each local adaptation solves an immediate problem, but repeated adaptation can normalize an unsafe operating condition.
This means failure is not always caused by deviation from normal work. Sometimes it is produced by normal work itself under conditions of strain. A system that depends on constant improvisation may appear flexible, yet that flexibility may be compensating for deeper structural weakness. When stress exceeds the range that people can absorb informally, the accumulated fragility becomes visible all at once.
For sustainable systems, this is especially important because communities, workers, ecosystems, and institutions often absorb risk silently. A system may be described as resilient because it keeps operating, while the cost of that operation is being transferred onto people, ecological buffers, or future maintenance obligations. That is not sustainable resilience. It is adaptation debt.
Optimization and the Loss of Slack
Complex systems also fail because optimization frequently removes the very capacities that would make disturbance manageable. Efficiency gains can be valuable, but when they eliminate redundancy, spare capacity, inventory buffers, maintenance margins, workforce depth, ecological buffers, or institutional memory, they often make systems more brittle. A system optimized for cost, speed, throughput, or short-term output may perform impressively in normal times while losing the ability to absorb unusual events.
This is one of the deepest tensions in sustainable systems. The logic of optimization often rewards concentration, centralization, just-in-time coordination, lean staffing, narrow specialization, and minimized reserve capacity. The logic of resilience often requires diversity, decentralization, redundancy, backup capacity, modularity, maintenance, ecological buffering, and room for adaptation. These priorities do not always align. A system can be highly efficient and still fail badly because it has no safe margin when assumptions break.
Slack is often misunderstood as waste. In resilience terms, slack is the space that allows systems to absorb variation. It includes spare staff, backup power, inventory reserves, alternate routes, redundant communications, healthy ecosystems, fiscal reserves, institutional memory, and enough time for people to respond thoughtfully rather than merely react. Slack may reduce apparent efficiency in normal times, but it can preserve essential function under stress.
The loss of slack is especially dangerous because it often happens gradually and appears rational at each step. A budget cut reduces maintenance. A staffing reduction increases workload. A centralized procurement system lowers costs. A just-in-time inventory system reduces storage. A wetland is converted for development. A backup system is deemed unnecessary because it has not been used recently. Each decision can be justified locally. Together, they remove the system’s shock absorbers.
Sustainable systems therefore need a more sophisticated understanding of efficiency. The question is not whether resources should be wasted. The question is whether the system preserves enough diversity, redundancy, and adaptive capacity to remain viable when conditions deviate from expectation. Efficiency without resilience can become a strategy for producing future failure.
Why Failure Appears Sudden
Complex failures often appear sudden because the underlying system has crossed a threshold after a long period of apparent normality. The visible break may be abrupt, but the conditions enabling it are usually cumulative. Ecological buffers may have been eroded gradually. Infrastructure maintenance may have been deferred for years. Governance capacity may have weakened incrementally. Social trust may have declined slowly. Redundancy may have been removed through repeated optimization. Because the build-up is gradual and dispersed, observers often interpret the final event as a surprise rather than as a delayed consequence.
This dynamic helps explain why post-crisis narratives are so often misleading. They focus on the final trigger because it is dramatic and legible. Yet the more important explanation usually lies in the interaction between that trigger and a system already pushed closer to a critical edge. Once the edge is crossed, feedback loops can accelerate failure rapidly, giving the impression that the event itself caused everything.
A drought may look like the cause of agricultural failure, but the deeper explanation may include groundwater depletion, monoculture dependence, debt exposure, degraded soils, market concentration, and weak public support. A cyberattack may look like the cause of institutional breakdown, but the deeper explanation may include centralization, poor backups, unpatched systems, inadequate staffing, and lack of continuity planning. A flood may look like the cause of urban disaster, but the deeper explanation may include land-use decisions, drainage neglect, wetland destruction, housing inequality, and weak emergency coordination.
Systems thinking warns against event-level bias. The question is not merely why the final disturbance occurred, but why the system had become unable to absorb it. That change in emphasis is essential for serious resilience work because it directs attention to slow variables, coupling structures, institutional choices, and capacity losses that condition sudden collapse.
Failure appears sudden when the monitoring system is poorly designed. A system that tracks only surface performance will miss structural deterioration. A system that tracks only individual assets will miss network effects. A system that tracks only short-term outputs will miss long-term fragility. Better failure analysis requires better attention to what changes slowly before anything breaks quickly.
Cascades Across Infrastructure and Governance
Complex systems fail not only within sectors but across them. In modern societies, infrastructure, institutions, ecosystems, and communities depend on one another continuously. A prolonged power outage can disrupt communications, transportation, wastewater systems, healthcare, finance, fuel distribution, food access, and emergency response. A breakdown in governance can delay information flows, erode trust, reduce compliance, and magnify the human consequences of technical disruption. A drought can become an agricultural shock, a fiscal strain, a migration pressure, a public-health risk, and a political crisis.
This cross-sector character of failure is why resilience has to be planned at the system and community level rather than at the asset level alone. A robust component inside a fragile network may still fail to preserve essential function. A hospital with strong internal procedures may still fail if power, water, roads, staffing, supplies, and public communication fail around it. A flood barrier may protect one district while increasing risk elsewhere. A data platform may be technically robust but socially fragile if people cannot access services when it fails.
Cascading failure also reveals the limits of administrative boundaries. Agencies often govern systems separately because institutions are organized by sector, jurisdiction, or function. But failure does not respect those categories. Power, water, transport, health, housing, ecosystems, and governance interact in real time. This creates a mismatch between how systems are managed and how they fail.
The same is true across scales. Local systems may depend on regional infrastructure, national regulation, global supply chains, climate systems, and financial markets. A local failure may be caused by distant dependencies. A distant shock may become local disaster because local capacity is weak. Complex failure often occurs where scales are misaligned: local responsibility without local control, national policy without local knowledge, or global dependency without resilience planning.
A serious approach must therefore map cascades before they occur. It should identify critical nodes, shared dependencies, common-mode failures, service restoration priorities, vulnerable populations, governance handoffs, and institutional bottlenecks. It should also ask which failures must be contained locally and which require coordinated cross-sector response.
Complex Systems and Intractability
Some complex systems fail because they are, in an important sense, intractable. They cannot be fully described in advance, fully monitored in real time, or fully controlled through fixed procedures. Socio-technical systems are variable, adaptive, and underspecified. People succeed by responding, monitoring, learning, anticipating, and adjusting to conditions that cannot be exhaustively written into procedures. This is why complex systems cannot be governed as if they were static machines with fully predictable behavior.
This has major implications for failure. If the system cannot be exhaustively predicted, then failure analysis cannot rely only on compliance checks or narrow root-cause thinking. It must ask how normal performance is produced, how variability is managed, where signals are missed, how people adapt, and how system conditions shift over time. The point is not to abandon accountability, but to recognize that failure in complex systems is rarely exhausted by a single linear explanation.
In sustainable systems, intractability is intensified by long time horizons, ecological uncertainty, political contestation, technological change, and uneven institutional capacity. Climate-linked disruptions, infrastructure transitions, biodiversity loss, migration pressures, public-health crises, and digital dependency cannot be governed as though the system were closed and stable. Failure becomes more likely when institutions pretend otherwise.
This does not mean governance is impossible. It means governance must be adaptive, transparent, and learning-oriented. Monitoring must track not only compliance, but system state. Planning must include uncertainty and scenarios. Institutions must preserve capacity to revise strategy. Communities must have voice because local knowledge often detects deterioration before formal metrics do. Resilience must be built through feedback, not assumed through plans.
Complex systems cannot be made perfectly failure-proof. But they can be made more observable, modular, redundant, equitable, adaptive, and capable of learning before failure becomes catastrophic.
What Failure Analysis Should Look For
A serious analysis of complex failure should look beyond the final incident and examine the structure that made the incident consequential. It should map dependencies, identify hidden coupling, trace feedback loops, study delays, and investigate how local adaptation may have masked deeper fragility. It should ask where information failed to move, where redundancy had been lost, where institutions normalized strain, and where incentives favored short-term output over long-term viability.
It should also examine what the system had been succeeding at before it failed. This is one of the key insights of resilience engineering: success and failure are often generated by the same underlying performance adjustments. Studying only breakdown misses how the system normally copes and where those coping strategies may be nearing their limit. Near misses, workarounds, informal coordination, repeated emergency patches, and quiet overextension are not marginal details. They are evidence about how the system actually functions.
Failure analysis should also examine slow variables. Maintenance backlogs, ecosystem degradation, staff exhaustion, trust erosion, soil decline, technical debt, aging infrastructure, housing insecurity, and concentrated dependencies are often better indicators of future failure than short-term performance metrics. A system can meet today’s targets while losing tomorrow’s resilience.
Finally, failure analysis must remain attentive to scale and justice. Complex systems do not fail equally for everyone. Hidden fragility is often borne first by those with the least protection, weakest infrastructure, and least institutional voice. A technically functioning system can still be failing socially if its ability to cope depends on transferring risk downward or outward. Sustainable systems analysis has to include that distributive dimension if it is to understand failure honestly.
A useful diagnostic question is this: who or what is absorbing the system’s stress before formal failure is recognized? If the answer is low-income communities, exhausted workers, degraded ecosystems, informal settlements, unpaid caregivers, or deferred maintenance, then the system may already be failing beneath the surface.
Mathematical Lens: Coupling, Delay, Slack Loss, and Failure Risk
Complex failure can be represented as an interaction among coupling, hidden deterioration, slack loss, external stress, and resilience capacity. Let \(D_r\) represent dependency density, \(H_r\) represent hidden coupling, \(K_r\) represent system criticality, and \(C_r\) represent coupling pressure for system \(r\):
C_r = \alpha D_r + \beta H_r + \gamma K_r
\]
Interpretation: Coupling pressure rises when system components are densely dependent, hidden connections are strong, and the system is critical to wider service continuity.
Deterioration pressure can be represented as a function of feedback delay, weak signal visibility, maintenance deficits, and adaptation debt:
P_r = \delta L_r + \epsilon(1 – S_r) + \zeta M_r + \eta A_r
\]
Interpretation: Deterioration becomes more dangerous when feedback is delayed, signals are hard to see, maintenance is deferred, and workarounds accumulate into hidden fragility.
Slack deficit can be represented through loss of buffers, redundancy, modularity, and excessive optimization pressure:
Q_r = q_1(1 – B_r) + q_2(1 – R_r) + q_3(1 – N_r) + q_4O_r
\]
Interpretation: Slack deficit rises when buffers, redundancy, and modularity are low, and when systems are optimized so tightly that disturbance has little room to be absorbed.
Resilience capacity can be represented as a combination of buffers, redundancy, modularity, monitoring, governance coordination, and signal visibility:
Z_r = z_1B_r + z_2R_r + z_3N_r + z_4W_r + z_5G_r + z_6S_r
\]
Interpretation: Resilience capacity increases when systems preserve buffers, backup pathways, modular containment, monitoring, coordination, and visibility into weak signals.
Failure risk can then be represented as structural fragility amplified by external stress and criticality, moderated by resilience capacity:
F_r = \left(w_1C_r + w_2P_r + w_3Q_r + w_4V_r\right)(1 + E_r)(1 + \lambda K_r)(1 – \rho Z_r)
\]
Interpretation: Failure risk rises when coupling, deterioration, slack loss, vulnerability, external stress, and criticality combine faster than resilience capacity can absorb them.
A failure gap can be written as:
\Delta_r = \max(0, F_r – Z_r)
\]
Interpretation: A failure gap appears when modeled failure pressure exceeds resilience capacity.
| Term | Meaning | Interpretive role |
|---|---|---|
| \(C_r\) | Coupling pressure | Represents interdependence, hidden coupling, and critical-service dependence. |
| \(P_r\) | Deterioration pressure | Represents delay, invisible deterioration, maintenance deficits, and adaptation debt. |
| \(Q_r\) | Slack deficit | Represents loss of buffers, redundancy, modularity, and safe margins. |
| \(Z_r\) | Resilience capacity | Represents buffering, redundancy, modularity, monitoring, governance, and signal visibility. |
| \(F_r\) | Failure risk | Represents the interaction of structural fragility, external stress, criticality, and resilience capacity. |
| \(\Delta_r\) | Failure gap | Identifies where failure pressure exceeds response and containment capacity. |
This mathematical lens is not meant to imply that complex failure can be predicted perfectly. It clarifies the relationships that a good failure analysis should examine: coupling, delay, slack loss, invisible deterioration, vulnerability, criticality, and resilience capacity.
Advanced Python Workflow: Complex System Failure Diagnostics
The following Python workflow models complex system failure as an emergent result of interdependence, hidden coupling, delayed feedback, lost slack, adaptation debt, optimization pressure, maintenance deficits, monitoring gaps, governance coordination limits, vulnerability, criticality, and external stress.
"""
Advanced complex system failure diagnostics.

This workflow models:
- coupling pressure
- deterioration pressure
- slack deficit
- resilience capacity
- cascade potential
- structural fragility
- failure risk
- failure gaps
- scenario-based resilience improvements
- Monte Carlo uncertainty around failure classification
"""

from __future__ import annotations

from dataclasses import dataclass
from pathlib import Path
from typing import Dict

import numpy as np
import pandas as pd


BASE_DIR = Path("articles/why-complex-systems-fail")
DATA_FILE = BASE_DIR / "data" / "complex_system_failure_panel.csv"
OUTPUT_DIR = BASE_DIR / "outputs"


@dataclass(frozen=True)
class Scenario:
    name: str
    dependency_reduction: float
    coupling_reduction: float
    delay_reduction: float
    signal_visibility_gain: float
    buffer_gain: float
    redundancy_gain: float
    modularity_gain: float
    adaptation_debt_reduction: float
    optimization_pressure_reduction: float
    maintenance_gain: float
    monitoring_gain: float
    governance_gain: float


SCENARIOS: Dict[str, Scenario] = {
    "baseline": Scenario("baseline", 0, 0, 0, 0, 0, 0, 0, 0, 0, 0, 0, 0),
    "monitoring_and_signal_upgrade": Scenario("monitoring_and_signal_upgrade", 0.02, 0.02, 0.10, 0.24, 0.06, 0.04, 0.04, 0.08, 0.04, 0.08, 0.24, 0.10),
    "redundancy_and_modularity": Scenario("redundancy_and_modularity", 0.10, 0.12, 0.04, 0.08, 0.18, 0.24, 0.24, 0.06, 0.08, 0.10, 0.08, 0.12),
    "deoptimization_for_resilience": Scenario("deoptimization_for_resilience", 0.08, 0.08, 0.04, 0.08, 0.20, 0.18, 0.16, 0.12, 0.24, 0.16, 0.10, 0.10),
    "adaptive_governance": Scenario("adaptive_governance", 0.06, 0.08, 0.12, 0.16, 0.12, 0.12, 0.14, 0.18, 0.12, 0.16, 0.18, 0.24),
    "system_resilience_portfolio": Scenario("system_resilience_portfolio", 0.14, 0.16, 0.16, 0.22, 0.24, 0.24, 0.24, 0.20, 0.22, 0.22, 0.24, 0.24),
}


def load_data(path: Path) -> pd.DataFrame:
    df = pd.read_csv(path)

    required = {
        "system_id",
        "system_name",
        "domain",
        "region",
        "stress_type",
        "dependency_density",
        "hidden_coupling",
        "feedback_delay",
        "signal_visibility",
        "buffer_capacity",
        "redundancy_capacity",
        "modularity_capacity",
        "adaptation_debt",
        "optimization_pressure",
        "maintenance_deficit",
        "monitoring_capacity",
        "governance_coordination",
        "social_vulnerability",
        "system_criticality",
        "external_stress",
    }

    missing = required.difference(df.columns)
    if missing:
        raise ValueError(f"Missing required columns: {sorted(missing)}")

    numeric_cols = [
        col for col in df.columns
        if col not in {"system_id", "system_name", "domain", "region", "stress_type"}
    ]

    for col in numeric_cols:
        if ((df[col] < 0) | (df[col] > 1)).any():
            raise ValueError(f"{col} must be scaled between 0 and 1.")

    return df


def classify_band(value: float, low: float, high: float) -> str:
    if value < low:
        return "lower"
    if value < high:
        return "moderate"
    return "elevated"


def score_systems(df: pd.DataFrame) -> pd.DataFrame:
    scored = df.copy()

    scored["coupling_pressure"] = (
        0.48 * scored["dependency_density"]
        + 0.36 * scored["hidden_coupling"]
        + 0.16 * scored["system_criticality"]
    )

    scored["deterioration_pressure"] = (
        0.30 * scored["feedback_delay"]
        + 0.28 * (1 - scored["signal_visibility"])
        + 0.22 * scored["maintenance_deficit"]
        + 0.20 * scored["adaptation_debt"]
    )

    scored["slack_deficit"] = (
        0.34 * (1 - scored["buffer_capacity"])
        + 0.30 * (1 - scored["redundancy_capacity"])
        + 0.20 * (1 - scored["modularity_capacity"])
        + 0.16 * scored["optimization_pressure"]
    )

    scored["resilience_capacity"] = (
        0.20 * scored["buffer_capacity"]
        + 0.20 * scored["redundancy_capacity"]
        + 0.18 * scored["modularity_capacity"]
        + 0.18 * scored["monitoring_capacity"]
        + 0.14 * scored["governance_coordination"]
        + 0.10 * scored["signal_visibility"]
    )

    scored["cascade_potential"] = (
        scored["coupling_pressure"]
        * (1 + scored["external_stress"])
        * (1 + 0.5 * scored["system_criticality"])
        * (1 - 0.35 * scored["modularity_capacity"])
    )

    scored["structural_fragility"] = (
        0.30 * scored["coupling_pressure"]
        + 0.28 * scored["deterioration_pressure"]
        + 0.24 * scored["slack_deficit"]
        + 0.18 * scored["social_vulnerability"]
    )

    scored["failure_risk"] = (
        scored["structural_fragility"]
        * (1 + scored["external_stress"])
        * (1 + 0.35 * scored["system_criticality"])
        * (1 - 0.45 * scored["resilience_capacity"])
    )

    scored["failure_gap"] = np.maximum(
        0,
        scored["failure_risk"] - scored["resilience_capacity"],
    )

    scored["signal_gap"] = np.maximum(
        0,
        scored["deterioration_pressure"] - scored["monitoring_capacity"],
    )

    scored["resilience_priority_score"] = (
        0.35 * scored["failure_gap"]
        + 0.25 * scored["cascade_potential"].clip(0, 1)
        + 0.20 * scored["signal_gap"]
        + 0.20 * scored["social_vulnerability"]
    ).clip(0, 1)

    scored["diagnostic_priority"] = np.select(
        [
            scored["cascade_potential"] > 1.20,
            scored["signal_gap"] > 0.25,
            scored["slack_deficit"] > 0.60,
            scored["adaptation_debt"] > 0.65,
        ],
        [
            "cascade_containment_priority",
            "monitoring_and_feedback_priority",
            "restore_slack_and_redundancy",
            "adaptation_debt_reduction",
        ],
        default="monitor_and_strengthen_resilience",
    )

    return scored.sort_values(
        ["resilience_priority_score", "failure_gap", "cascade_potential"],
        ascending=False,
    ).reset_index(drop=True)


def apply_scenario(df: pd.DataFrame, scenario: Scenario) -> pd.DataFrame:
    scenario_df = df.copy()

    scenario_df["dependency_density"] = (
        scenario_df["dependency_density"] * (1 - scenario.dependency_reduction)
    ).clip(0, 1)

    scenario_df["hidden_coupling"] = (
        scenario_df["hidden_coupling"] * (1 - scenario.coupling_reduction)
    ).clip(0, 1)

    scenario_df["feedback_delay"] = (
        scenario_df["feedback_delay"] * (1 - scenario.delay_reduction)
    ).clip(0, 1)

    scenario_df["signal_visibility"] = (
        scenario_df["signal_visibility"] + scenario.signal_visibility_gain
    ).clip(0, 1)

    scenario_df["buffer_capacity"] = (
        scenario_df["buffer_capacity"] + scenario.buffer_gain
    ).clip(0, 1)

    scenario_df["redundancy_capacity"] = (
        scenario_df["redundancy_capacity"] + scenario.redundancy_gain
    ).clip(0, 1)

    scenario_df["modularity_capacity"] = (
        scenario_df["modularity_capacity"] + scenario.modularity_gain
    ).clip(0, 1)

    scenario_df["adaptation_debt"] = (
        scenario_df["adaptation_debt"] * (1 - scenario.adaptation_debt_reduction)
    ).clip(0, 1)

    scenario_df["optimization_pressure"] = (
        scenario_df["optimization_pressure"] * (1 - scenario.optimization_pressure_reduction)
    ).clip(0, 1)

    scenario_df["maintenance_deficit"] = (
        scenario_df["maintenance_deficit"] * (1 - scenario.maintenance_gain)
    ).clip(0, 1)

    scenario_df["monitoring_capacity"] = (
        scenario_df["monitoring_capacity"] + scenario.monitoring_gain
    ).clip(0, 1)

    scenario_df["governance_coordination"] = (
        scenario_df["governance_coordination"] + scenario.governance_gain
    ).clip(0, 1)

    rescored = score_systems(scenario_df)
    rescored["scenario"] = scenario.name

    return rescored


def run_scenarios(df: pd.DataFrame) -> pd.DataFrame:
    return pd.concat(
        [apply_scenario(df, scenario) for scenario in SCENARIOS.values()],
        ignore_index=True,
    )


def monte_carlo_uncertainty(
    df: pd.DataFrame,
    draws: int = 2000,
    seed: int = 42,
) -> pd.DataFrame:
    rng = np.random.default_rng(seed)
    records = []

    numeric_cols = [
        "dependency_density",
        "hidden_coupling",
        "feedback_delay",
        "signal_visibility",
        "buffer_capacity",
        "redundancy_capacity",
        "modularity_capacity",
        "adaptation_debt",
        "optimization_pressure",
        "maintenance_deficit",
        "monitoring_capacity",
        "governance_coordination",
        "social_vulnerability",
        "system_criticality",
        "external_stress",
    ]

    for draw in range(draws):
        sampled = df.copy()
        noise = rng.normal(loc=0.0, scale=0.04, size=(len(df), len(numeric_cols)))
        sampled[numeric_cols] = np.clip(sampled[numeric_cols].to_numpy() + noise, 0, 1)
        scored = score_systems(sampled)
        scored["draw"] = draw
        records.append(
            scored[
                [
                    "system_id",
                    "system_name",
                    "draw",
                    "coupling_pressure",
                    "deterioration_pressure",
                    "slack_deficit",
                    "resilience_capacity",
                    "cascade_potential",
                    "failure_risk",
                    "failure_gap",
                    "resilience_priority_score",
                ]
            ]
        )

    mc = pd.concat(records, ignore_index=True)

    return (
        mc.groupby(["system_id", "system_name"])
        .agg(
            coupling_p50=("coupling_pressure", "median"),
            deterioration_p50=("deterioration_pressure", "median"),
            slack_deficit_p50=("slack_deficit", "median"),
            resilience_capacity_p50=("resilience_capacity", "median"),
            cascade_p50=("cascade_potential", "median"),
            cascade_p95=("cascade_potential", lambda x: np.quantile(x, 0.95)),
            failure_risk_p50=("failure_risk", "median"),
            failure_gap_p50=("failure_gap", "median"),
            priority_p50=("resilience_priority_score", "median"),
        )
        .reset_index()
        .sort_values("priority_p50", ascending=False)
    )


def build_domain_summary(scored: pd.DataFrame) -> pd.DataFrame:
    return (
        scored.groupby("domain")
        .agg(
            systems=("system_id", "count"),
            mean_coupling_pressure=("coupling_pressure", "mean"),
            mean_deterioration_pressure=("deterioration_pressure", "mean"),
            mean_slack_deficit=("slack_deficit", "mean"),
            mean_resilience_capacity=("resilience_capacity", "mean"),
            mean_cascade_potential=("cascade_potential", "mean"),
            mean_failure_risk=("failure_risk", "mean"),
            mean_failure_gap=("failure_gap", "mean"),
            mean_priority_score=("resilience_priority_score", "mean"),
        )
        .reset_index()
        .sort_values("mean_priority_score", ascending=False)
    )


def main() -> None:
    OUTPUT_DIR.mkdir(parents=True, exist_ok=True)

    raw = load_data(DATA_FILE)
    scored = score_systems(raw)
    scenarios = run_scenarios(raw)
    uncertainty = monte_carlo_uncertainty(raw)
    domain_summary = build_domain_summary(scored)

    scored.to_csv(OUTPUT_DIR / "complex_system_failure_scores.csv", index=False)
    scenarios.to_csv(OUTPUT_DIR / "complex_system_failure_scenarios.csv", index=False)
    uncertainty.to_csv(OUTPUT_DIR / "complex_system_failure_uncertainty.csv", index=False)
    domain_summary.to_csv(OUTPUT_DIR / "complex_system_failure_domain_summary.csv", index=False)

    print(scored.round(3).to_string(index=False))
    print(domain_summary.round(3).to_string(index=False))


if __name__ == "__main__":
    main()
This workflow operationalizes the article’s core claim: complex failures are usually not isolated events. They emerge from coupling pressure, hidden deterioration, slack loss, adaptation debt, optimization pressure, weak monitoring, and inadequate resilience capacity. The scenario structure allows users to test different response strategies: monitoring upgrades, redundancy and modularity, deoptimization for resilience, adaptive governance, and integrated system resilience portfolios.
Advanced R Workflow: Failure-Risk Dashboarding
The following R workflow creates dashboard-ready outputs for comparing coupling pressure, deterioration pressure, slack deficit, resilience capacity, cascade potential, failure risk, failure gaps, scenario summaries, domain summaries, and long-format dashboard data.
library(readr)
library(dplyr)
library(tidyr)

base_dir <- "articles/why-complex-systems-fail"
data_file <- file.path(base_dir, "data", "complex_system_failure_panel.csv")
output_dir <- file.path(base_dir, "outputs")

dir.create(output_dir, recursive = TRUE, showWarnings = FALSE)

systems <- read_csv(data_file, show_col_types = FALSE)

score_systems <- function(df) {
  df %>%
    mutate(
      coupling_pressure =
        0.48 * dependency_density +
        0.36 * hidden_coupling +
        0.16 * system_criticality,

      deterioration_pressure =
        0.30 * feedback_delay +
        0.28 * (1 - signal_visibility) +
        0.22 * maintenance_deficit +
        0.20 * adaptation_debt,

      slack_deficit =
        0.34 * (1 - buffer_capacity) +
        0.30 * (1 - redundancy_capacity) +
        0.20 * (1 - modularity_capacity) +
        0.16 * optimization_pressure,

      resilience_capacity =
        0.20 * buffer_capacity +
        0.20 * redundancy_capacity +
        0.18 * modularity_capacity +
        0.18 * monitoring_capacity +
        0.14 * governance_coordination +
        0.10 * signal_visibility,

      cascade_potential =
        coupling_pressure *
        (1 + external_stress) *
        (1 + 0.5 * system_criticality) *
        (1 - 0.35 * modularity_capacity),

      structural_fragility =
        0.30 * coupling_pressure +
        0.28 * deterioration_pressure +
        0.24 * slack_deficit +
        0.18 * social_vulnerability,

      failure_risk =
        structural_fragility *
        (1 + external_stress) *
        (1 + 0.35 * system_criticality) *
        (1 - 0.45 * resilience_capacity),

      failure_gap =
        pmax(0, failure_risk - resilience_capacity),

      signal_gap =
        pmax(0, deterioration_pressure - monitoring_capacity),

      resilience_priority_score =
        pmin(
          1,
          0.35 * failure_gap +
            0.25 * pmin(1, cascade_potential) +
            0.20 * signal_gap +
            0.20 * social_vulnerability
        ),

      diagnostic_priority = case_when(
        cascade_potential > 1.20 ~
          "cascade_containment_priority",
        signal_gap > 0.25 ~
          "monitoring_and_feedback_priority",
        slack_deficit > 0.60 ~
          "restore_slack_and_redundancy",
        adaptation_debt > 0.65 ~
          "adaptation_debt_reduction",
        TRUE ~
          "monitor_and_strengthen_resilience"
      )
    ) %>%
    arrange(desc(resilience_priority_score), desc(failure_gap), desc(cascade_potential))
}

scored <- score_systems(systems)

scenario_parameters <- tibble::tibble(
  scenario = c(
    "baseline",
    "monitoring_and_signal_upgrade",
    "redundancy_and_modularity",
    "deoptimization_for_resilience",
    "adaptive_governance",
    "system_resilience_portfolio"
  ),
  dependency_reduction = c(0.00, 0.02, 0.10, 0.08, 0.06, 0.14),
  coupling_reduction = c(0.00, 0.02, 0.12, 0.08, 0.08, 0.16),
  delay_reduction = c(0.00, 0.10, 0.04, 0.04, 0.12, 0.16),
  signal_visibility_gain = c(0.00, 0.24, 0.08, 0.08, 0.16, 0.22),
  buffer_gain = c(0.00, 0.06, 0.18, 0.20, 0.12, 0.24),
  redundancy_gain = c(0.00, 0.04, 0.24, 0.18, 0.12, 0.24),
  modularity_gain = c(0.00, 0.04, 0.24, 0.16, 0.14, 0.24),
  adaptation_debt_reduction = c(0.00, 0.08, 0.06, 0.12, 0.18, 0.20),
  optimization_pressure_reduction = c(0.00, 0.04, 0.08, 0.24, 0.12, 0.22),
  maintenance_gain = c(0.00, 0.08, 0.10, 0.16, 0.16, 0.22),
  monitoring_gain = c(0.00, 0.24, 0.08, 0.10, 0.18, 0.24),
  governance_gain = c(0.00, 0.10, 0.12, 0.10, 0.24, 0.24)
)

scenario_scores <- systems %>%
  tidyr::crossing(scenario_parameters) %>%
  mutate(
    dependency_density = pmax(0, dependency_density * (1 - dependency_reduction)),
    hidden_coupling = pmax(0, hidden_coupling * (1 - coupling_reduction)),
    feedback_delay = pmax(0, feedback_delay * (1 - delay_reduction)),
    signal_visibility = pmin(1, signal_visibility + signal_visibility_gain),
    buffer_capacity = pmin(1, buffer_capacity + buffer_gain),
    redundancy_capacity = pmin(1, redundancy_capacity + redundancy_gain),
    modularity_capacity = pmin(1, modularity_capacity + modularity_gain),
    adaptation_debt = pmax(0, adaptation_debt * (1 - adaptation_debt_reduction)),
    optimization_pressure = pmax(0, optimization_pressure * (1 - optimization_pressure_reduction)),
    maintenance_deficit = pmax(0, maintenance_deficit * (1 - maintenance_gain)),
    monitoring_capacity = pmin(1, monitoring_capacity + monitoring_gain),
    governance_coordination = pmin(1, governance_coordination + governance_gain)
  ) %>%
  group_by(scenario) %>%
  group_modify(~ score_systems(.x)) %>%
  ungroup()

scenario_summary <- scenario_scores %>%
  group_by(scenario) %>%
  summarise(
    mean_coupling_pressure = mean(coupling_pressure),
    mean_deterioration_pressure = mean(deterioration_pressure),
    mean_slack_deficit = mean(slack_deficit),
    mean_resilience_capacity = mean(resilience_capacity),
    mean_cascade_potential = mean(cascade_potential),
    mean_failure_risk = mean(failure_risk),
    mean_failure_gap = mean(failure_gap),
    mean_priority_score = mean(resilience_priority_score),
    .groups = "drop"
  ) %>%
  arrange(mean_priority_score)

domain_summary <- scored %>%
  group_by(domain) %>%
  summarise(
    systems = n(),
    mean_coupling_pressure = mean(coupling_pressure),
    mean_deterioration_pressure = mean(deterioration_pressure),
    mean_slack_deficit = mean(slack_deficit),
    mean_resilience_capacity = mean(resilience_capacity),
    mean_cascade_potential = mean(cascade_potential),
    mean_failure_risk = mean(failure_risk),
    mean_failure_gap = mean(failure_gap),
    mean_priority_score = mean(resilience_priority_score),
    .groups = "drop"
  ) %>%
  arrange(desc(mean_priority_score))

dashboard_long <- scored %>%
  select(
    system_id,
    system_name,
    domain,
    region,
    stress_type,
    coupling_pressure,
    deterioration_pressure,
    slack_deficit,
    resilience_capacity,
    cascade_potential,
    failure_risk,
    failure_gap,
    resilience_priority_score
  ) %>%
  pivot_longer(
    cols = c(
      coupling_pressure,
      deterioration_pressure,
      slack_deficit,
      resilience_capacity,
      cascade_potential,
      failure_risk,
      failure_gap,
      resilience_priority_score
    ),
    names_to = "metric",
    values_to = "value"
  )

write_csv(scored, file.path(output_dir, "r_complex_system_failure_scores.csv"))
write_csv(scenario_scores, file.path(output_dir, "r_complex_system_failure_scenarios.csv"))
write_csv(scenario_summary, file.path(output_dir, "r_scenario_summary.csv"))
write_csv(domain_summary, file.path(output_dir, "r_domain_summary.csv"))
write_csv(dashboard_long, file.path(output_dir, "r_dashboard_long.csv"))

print(scored)
print(scenario_summary)
print(domain_summary)
The R workflow complements the Python workflow by producing dashboard-oriented outputs. It is especially useful for comparing domains, scenarios, failure-risk metrics, and resilience upgrades across infrastructure, public-health, ecological, digital, supply-chain, and regional systems. A production version could connect to infrastructure dependency maps, maintenance records, outage histories, staffing data, public-health indicators, environmental monitoring systems, critical-service registers, and emergency-management datasets.
Engineering Extensions in the GitHub Repository
The accompanying repository extends the article beyond conceptual explanation into reproducible systems analysis. The article folder is designed around a synthetic system panel, advanced Python diagnostics, advanced R dashboarding, scenario outputs, uncertainty analysis, documentation, and extensible scoring logic.
The article body foregrounds Python and R because they are the most accessible languages for data analysis, scenario modeling, uncertainty analysis, and dashboard preparation. Additional languages can strengthen the repository where they serve a real analytical purpose. Go can support lightweight scoring services and APIs. Rust can support reliable command-line scoring tools. SQL can support structured indicator records, scenario matrices, source provenance, and auditability. C and C++ can support compact numerical kernels and high-performance cascade calculations. Fortran can support numerical failure-gap calculations and legacy scientific-computing workflows.
The deeper purpose of the repository is not to turn complex failure into false precision. It is to make assumptions visible. By separating coupling pressure, deterioration pressure, slack deficit, resilience capacity, cascade potential, failure risk, and failure gaps, the workflow allows users to see how the final interpretation was produced. That transparency is essential in systems where breakdown is often misread as sudden, isolated, or purely technical.
GitHub Repository
Complete Code Repository
The full code directory for this article, including advanced Python diagnostics, advanced R dashboard workflow, synthetic complex-system-failure data, scenario outputs, uncertainty analysis, documentation, and systems-level extensions, is available on GitHub.
Common Misunderstandings
A common misunderstanding is that complex systems fail because one part breaks. A broken part may trigger visible failure, but complex failure usually depends on deeper structures: coupling, delay, lost slack, hidden dependencies, and weak response capacity.
Another misunderstanding is that failure is the opposite of normal operation. In many complex systems, failure emerges from the same adaptations that make normal operation possible. Workarounds, improvisation, and local optimization can sustain performance while quietly increasing fragility.
A third misunderstanding is that efficiency always improves system performance. Efficiency can improve performance under expected conditions, but excessive optimization can remove redundancy, slack, diversity, and maintenance capacity. This can make systems brittle under unexpected stress.
A fourth misunderstanding is that failures are sudden. The final breakdown may be abrupt, but the underlying conditions usually accumulate slowly. Maintenance deficits, ecological degradation, staff burnout, trust erosion, and technical debt can build for years before a trigger exposes them.
A fifth misunderstanding is that better prediction can eliminate failure. Prediction helps, but complex systems cannot be made fully knowable or controllable. They require monitoring, learning, modularity, redundancy, adaptive governance, and the ability to respond under uncertainty.
A final misunderstanding is that technical resilience is enough. Complex systems fail socially as well as technically. A system that preserves aggregate function by shifting harm onto vulnerable people, exhausted workers, or degraded ecosystems is already failing in a deeper sense.
Conclusion
Complex systems fail because their behavior is shaped by interdependence, hidden coupling, delayed feedback, adaptation, optimization, and structural trade-offs that are often invisible in ordinary operation. Breakdown is rarely the simple result of one bad event. It is more often the outcome of cumulative pressures moving through a network whose apparent stability concealed deeper fragility. What looks sudden is often long in the making.
To understand this is to move beyond superficial explanations of failure as isolated error. It is to see that systems fail when dependencies are underestimated, buffers are removed, signals are ignored, improvisation substitutes for design too long, and efficiency crowds out resilience. It is also to recognize that complex systems cannot be made failure-proof. They can only be made more capable of monitoring, responding, learning, adapting, and containing disruption under changing conditions.
The computational workflows attached to this article extend that argument into practice. They separate coupling pressure, deterioration pressure, slack deficit, resilience capacity, cascade potential, failure risk, and failure gaps. They show why some systems require better monitoring, some require restored redundancy, some require modularity, some require deoptimization, and some require deeper adaptive governance.
Serious resilience work begins not with the fantasy of total control, but with a clearer understanding of how complex failure actually emerges. It asks what is connected, what is hidden, what is delayed, what has been optimized away, who is absorbing strain, and what capacities must be restored before the next disturbance arrives.
Return to the Risk & Resilience knowledge series.
Related Reading
- Risk & Resilience
- What Are Risk and Resilience in Sustainable Systems?
- Risk, Uncertainty, and Complexity
- Vulnerability, Exposure, and Sensitivity
- Resilience, Robustness, and Antifragility
- Adaptation, Recovery, and Transformation
- Systems Thinking
Further Reading
- Hollnagel, E., Woods, D.D. and Leveson, N. (eds.) (2006) Resilience Engineering: Concepts and Precepts. Aldershot: Ashgate. Available at: https://erikhollnagel.com/books/resilience-engineering-2006.
- Hollnagel, E. (n.d.) Resilience Engineering. Available at: https://erikhollnagel.com/ideas/resilience-engineering.html.
- Meadows, D.H. (1999) Leverage Points: Places to Intervene in a System. Available at: https://donellameadows.org/wp-content/userfiles/Leverage_Points.pdf.
- Meadows, D.H. (2008) Thinking in Systems: A Primer. White River Junction, VT: Chelsea Green. Available at: https://www.chelseagreen.com/product/thinking-in-systems/.
- National Institute of Standards and Technology (2015) Community Resilience Planning Guide for Buildings and Infrastructure Systems, Volume I. Available at: https://nvlpubs.nist.gov/nistpubs/specialpublications/NIST.SP.1190v1.pdf.
- National Institute of Standards and Technology (2018) State of the Research in Community Resilience. Available at: https://tsapps.nist.gov/publication/get_pdf.cfm?pub_id=923194.
- National Institute of Standards and Technology (n.d.) Community Resilience Program. Available at: https://www.nist.gov/programs-projects/community-resilience-program.
- Perrow, C. (1999) Normal Accidents: Living with High-Risk Technologies. Princeton, NJ: Princeton University Press. Available at: https://press.princeton.edu/books/paperback/9780691004129/normal-accidents.
- Resilience Engineering Association (2019) What Is Resilience Engineering? Available at: https://www.resilience-engineering-association.org/blog/2019/11/09/what-is-resilience-engineering/.
- Woods, D.D. (2018) ‘The theory of graceful extensibility: basic rules that govern adaptive systems’, Environment Systems and Decisions, 38, pp. 433–457. Available at: https://doi.org/10.1007/s10669-018-9708-3.
References
- Hollnagel, E., Woods, D.D. and Leveson, N. (eds.) (2006) Resilience Engineering: Concepts and Precepts. Aldershot: Ashgate. Available at: https://erikhollnagel.com/books/resilience-engineering-2006.
- Hollnagel, E. (n.d.) Resilience Engineering. Available at: https://erikhollnagel.com/ideas/resilience-engineering.html.
- Meadows, D.H. (1999) Leverage Points: Places to Intervene in a System. Available at: https://donellameadows.org/wp-content/userfiles/Leverage_Points.pdf.
- Meadows, D.H. (2008) Thinking in Systems: A Primer. White River Junction, VT: Chelsea Green. Available at: https://www.chelseagreen.com/product/thinking-in-systems/.
- National Institute of Standards and Technology (2015) Community Resilience Planning Guide for Buildings and Infrastructure Systems, Volume I. Available at: https://nvlpubs.nist.gov/nistpubs/specialpublications/NIST.SP.1190v1.pdf.
- National Institute of Standards and Technology (2018) State of the Research in Community Resilience. Available at: https://tsapps.nist.gov/publication/get_pdf.cfm?pub_id=923194.
- National Institute of Standards and Technology (n.d.) Community Resilience Program. Available at: https://www.nist.gov/programs-projects/community-resilience-program.
- Perrow, C. (1999) Normal Accidents: Living with High-Risk Technologies. Princeton, NJ: Princeton University Press. Available at: https://press.princeton.edu/books/paperback/9780691004129/normal-accidents.
- Resilience Engineering Association (2019) What Is Resilience Engineering? Available at: https://www.resilience-engineering-association.org/blog/2019/11/09/what-is-resilience-engineering/.
- Woods, D.D. (2018) ‘The theory of graceful extensibility: basic rules that govern adaptive systems’, Environment Systems and Decisions, 38, pp. 433–457. Available at: https://doi.org/10.1007/s10669-018-9708-3.