
This project demonstrates how to build a Raspberry Pi urban monitoring station that measures environmental conditions relevant to both air quality and urban heat island analysis. While simple, the design reflects a broader principle of sustainable infrastructure: distributed observation improves environmental intelligence. When urban conditions become visible through data, policy and planning can become more precise.
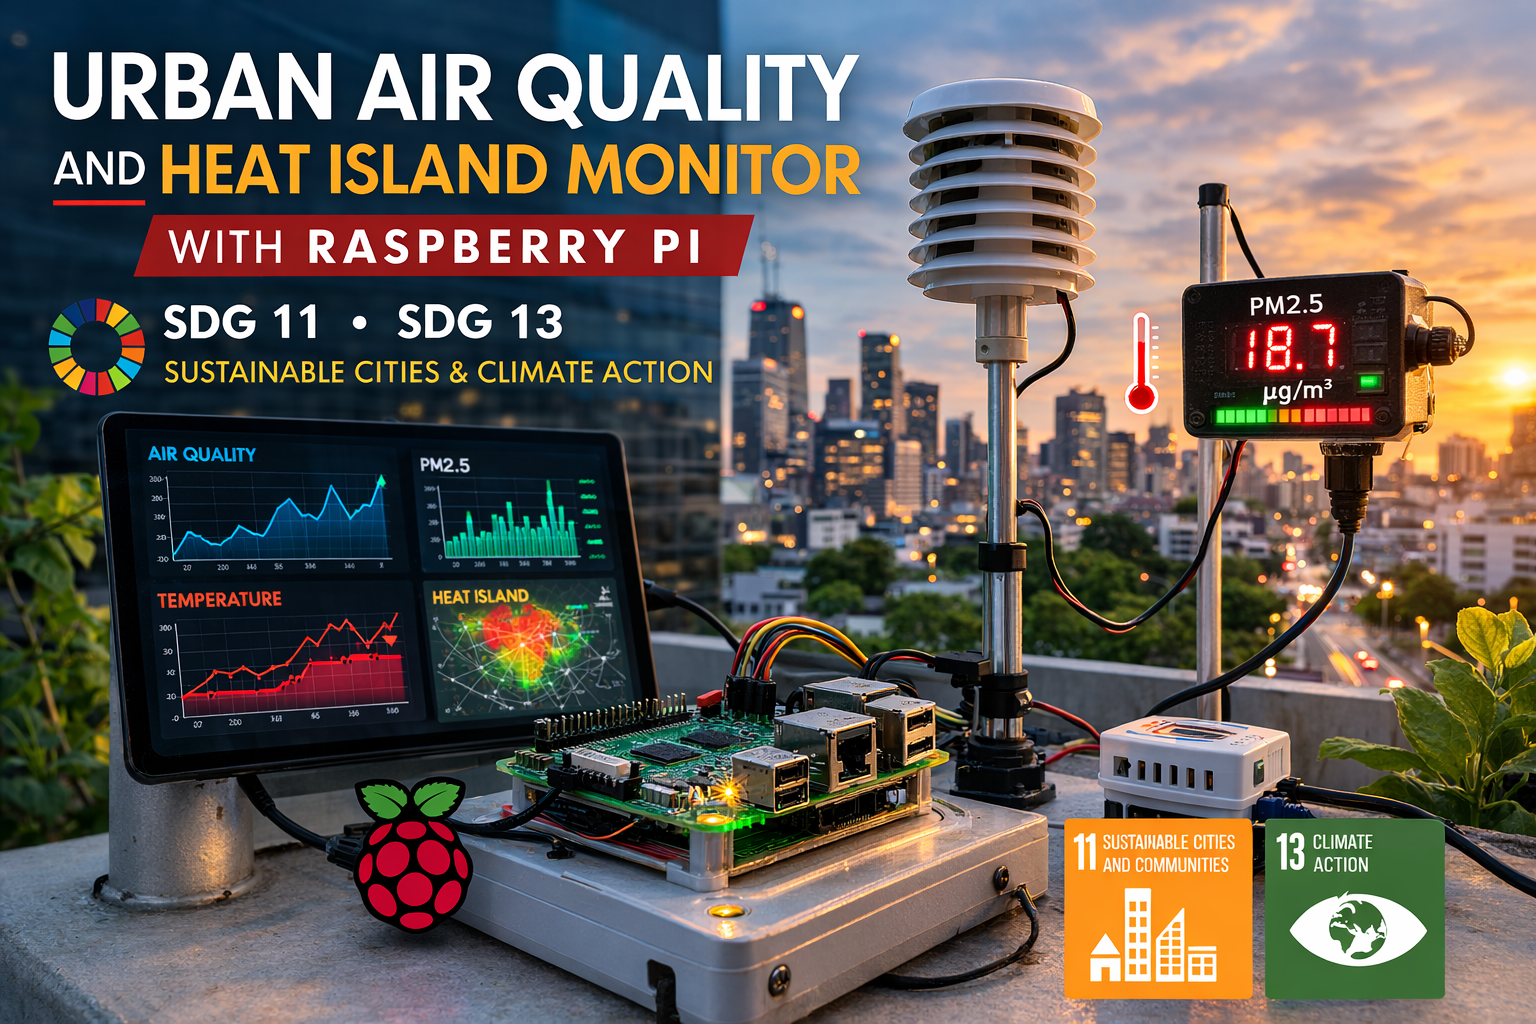
Table of Contents
- Abstract
- Prototype Repository
- SDG Alignment
- Why a Raspberry Pi Urban Air Quality Monitor Matters
- Urban Climate and the Heat Island Effect
- Air Pollution and Urban Environmental Health
- Distributed Urban Monitoring Systems
- Bill of Materials
- Engineering Specifications
- System Architecture
- Connecting the Environmental Sensors
- Python Code for Reading Environmental Data
- Reading PM2.5 Air Quality Data
- Storing Environmental Observations
- Detecting Urban Heat Islands
- Integrating Global Climate Data
- AI and Environmental Analytics
- Edge Computing and Distributed Urban Intelligence
- Engineering Notes
- Validation and Testing
- Suggested Performance Metrics
- Urban Environmental Monitoring and Sustainable Cities
- Reproducibility
- Conclusion
Abstract
This project presents a prototype Raspberry Pi urban air quality monitor built around edge computing, environmental sensing, local time-series storage, and optional cloud integration. The system combines atmospheric sensing from a BME280 sensor with particulate monitoring from a PMS5003 in order to capture local environmental conditions relevant to air quality and urban heat island analysis.
From an engineering perspective, the build demonstrates a compact urban observation node capable of sensing, logging, and analyzing environmental change. From a sustainability perspective, it shows how distributed low-cost monitoring can support more resilient cities by making urban heat and pollution patterns visible at neighborhood scale.
Prototype Repository
This project is published as an open prototype so that engineers, researchers, students, and advanced makers can reproduce and extend the design. All code, documentation, setup notes, and example environmental datasets are available in the project repository.
GitHub Repository:
Raspberry Pi Urban Air Quality Monitor – Source Files and Documentation
The repository contains the complete prototype build materials:
- Python monitoring scripts
- sensor setup documentation
- SQLite logging examples
- deployment notes
- example environmental datasets
- climate API integration examples
Engineers can clone the repository, fork the design, or download the complete project using GitHub’s Download ZIP feature.
All materials are released under the MIT License to support reuse in research, education, and prototype engineering work.
Repository Structure
raspberry-pi-urban-air-quality-monitor/

README.md
LICENSE
requirements.txt

src/
  read_environment.py
  read_pm_data.py
  log_environment.py
  heat_island_check.py
  climate_api_example.py

docs/
  setup_guide.md
  deployment_notes.md
  sensor_notes.md

data/
  example_urban_environment_data.csv

hardware/
SDG Alignment
This project aligns most directly with SDG 11: Sustainable Cities and Communities and SDG 13: Climate Action.
It supports sustainable cities by improving local environmental visibility around heat, air pollution, and neighborhood-scale risk. It supports climate action by enabling low-cost observation systems that help identify heat anomalies, pollution spikes, and changing urban environmental conditions.
More broadly, the project reflects the principle that resilient urban policy depends on observation systems that operate at the scales where people actually live.
Why a Raspberry Pi Urban Air Quality Monitor Matters
Urban environmental conditions vary dramatically across short distances. A single city can contain cooler and hotter neighborhoods, cleaner and more polluted corridors, and highly uneven exposure to climate stress.
Large monitoring stations remain essential, but they are often too sparse to capture local variation at high spatial resolution. A Raspberry Pi-based monitoring node matters because it provides an affordable way to expand environmental visibility into neighborhoods, schools, streetscapes, and experimental urban research zones.
This kind of system helps translate abstract environmental concern into measurable local evidence.
Urban Climate and the Heat Island Effect
One of the most widely studied urban environmental phenomena is the urban heat island effect. Cities often experience higher temperatures than nearby rural areas because built infrastructure absorbs and retains heat.
Several factors contribute to urban heat islands:
- dark surfaces such as asphalt absorbing solar radiation
- reduced vegetation and evaporative cooling
- dense building structures that trap heat
- waste heat from vehicles and buildings
During extreme heat events, urban heat islands can increase health risks and place additional stress on energy systems. Monitoring temperature differences across neighborhoods can help identify areas where mitigation strategies such as tree planting or reflective roofing may be most effective.
Air Pollution and Urban Environmental Health
Urban air quality is another major environmental concern. Particulate pollution — especially fine particles known as PM2.5 — has been linked to respiratory illness, cardiovascular disease, and other health impacts.
Sources of urban particulate pollution include:
- vehicle emissions
- industrial activity
- construction dust
- secondary atmospheric reactions
Monitoring PM2.5 concentrations allows environmental researchers and city planners to identify pollution hotspots and evaluate the effectiveness of air quality interventions.
Distributed Urban Monitoring Systems
Traditional air-quality stations operated by governments provide highly accurate data but are often limited in number because of cost and maintenance requirements.
Distributed sensing systems using embedded computing platforms can complement these networks by expanding spatial coverage. Low-cost monitoring stations deployed across neighborhoods can provide:
- higher spatial resolution environmental data
- community-level climate observations
- experimental platforms for urban climate research
- more localized evidence for planning and adaptation
Bill of Materials
- Raspberry Pi 4 or Raspberry Pi Zero 2 W
- BME280 environmental sensor (temperature, humidity, pressure)
- PMS5003 particulate matter sensor (PM1.0 / PM2.5 / PM10)
- MicroSD storage
- Wi-Fi or LoRa communication module
- Weather-resistant enclosure
These components allow the system to capture both atmospheric conditions and particulate pollution levels using a single edge node.
Engineering Specifications
| Parameter | Specification |
|---|---|
| Compute platform | Raspberry Pi 4 or Raspberry Pi Zero 2 W |
| Primary atmospheric sensor | BME280 (temperature, humidity, pressure) |
| Air quality sensor | PMS5003 (PM1.0 / PM2.5 / PM10) |
| Interfaces | I2C for BME280, UART for PMS5003 |
| Storage options | CSV, SQLite |
| Output options | Console, dashboard, optional cloud export |
| Deployment mode | Urban edge monitoring node |
| Target scope | Educational, prototype, and experimental urban observation |
System Architecture
The Raspberry Pi functions as the central processing node of the monitoring station.
Typical architecture:
Environmental Sensors → I2C / UART Interface → Raspberry Pi → Local Database → Visualization Dashboard → Optional Cloud Integration
This architecture allows the monitoring system to operate independently while still supporting integration with external data platforms. It also makes the system useful for edge analytics, anomaly detection, and local resilience experiments.
Connecting the Environmental Sensors
BME280 Sensor (I2C)
- VCC → 3.3V
- GND → Ground
- SDA → GPIO 2
- SCL → GPIO 3
PMS5003 Air Quality Sensor (UART)
- VCC → 5V
- GND → Ground
- TX → Raspberry Pi RX (GPIO15)
- RX → Raspberry Pi TX (GPIO14)
Use stable power and confirm sensor voltage requirements before deployment, especially when combining multiple sensors inside a compact enclosure.
Python Code for Reading Environmental Data
The following Python example reads temperature, humidity, and pressure from a BME280 sensor.
import time
import board
import busio
import adafruit_bme280

i2c = busio.I2C(board.SCL, board.SDA)
bme280 = adafruit_bme280.Adafruit_BME280_I2C(i2c)

while True:
    temperature = bme280.temperature
    humidity = bme280.humidity
    pressure = bme280.pressure

    print("Temperature:", temperature)
    print("Humidity:", humidity)
    print("Pressure:", pressure)

    time.sleep(10)
This script reads temperature, humidity, and pressure every ten seconds and prints the results to the console.
Reading PM2.5 Air Quality Data
The following example parses particulate-matter values from the PMS5003 serial data stream.
import serial

ser = serial.Serial("/dev/serial0", baudrate=9600, timeout=2)

def read_pm_data():
    data = ser.read(32)

    if len(data) >= 32 and data[0] == 0x42 and data[1] == 0x4d:
        pm1 = data[10] * 256 + data[11]
        pm25 = data[12] * 256 + data[13]
        pm10 = data[14] * 256 + data[15]

        return pm1, pm25, pm10
This function extracts particulate matter concentrations from the sensor’s serial data stream.
Storing Environmental Observations
Urban monitoring systems generate large time-series datasets. A lightweight database such as SQLite allows sensor observations to be stored and queried efficiently.
import sqlite3
import datetime

conn = sqlite3.connect("urban_environment.db")
cursor = conn.cursor()

cursor.execute("""
CREATE TABLE IF NOT EXISTS air_quality (
    timestamp TEXT,
    temperature REAL,
    humidity REAL,
    pressure REAL,
    pm25 REAL
)
""")

def log_data(temp, humidity, pressure, pm25):
    cursor.execute("""
    INSERT INTO air_quality VALUES (?, ?, ?, ?, ?)
    """, (
        datetime.datetime.now(),
        temp,
        humidity,
        pressure,
        pm25
    ))
    conn.commit()
Over time this dataset becomes a structured environmental record that can be analyzed using Python, R, or visualization tools.
Detecting Urban Heat Islands
One way to identify urban heat islands is by comparing local sensor readings with regional temperature observations.
import requests

def get_regional_temperature():
    url = "https://api.open-meteo.com/v1/forecast"

    params = {
        "latitude": 38.6,
        "longitude": -90.2,
        "current_weather": True
    }

    response = requests.get(url, params=params)
    data = response.json()
    return data["current_weather"]["temperature"]
If local temperatures are consistently several degrees higher than nearby regional observations, the monitoring station may be detecting an urban heat island signal.
Integrating Global Climate Data
Local monitoring stations become more valuable when their observations can be compared with broader climate datasets.
Examples of widely used climate data sources include:
- NASA Earth Observing System Data and Information System (EOSDIS)
- NOAA Global Climate Data Online (GCDO)
- Copernicus Climate Data Store
Combining local sensor observations with these datasets allows the monitoring system to place neighborhood-scale conditions within a broader climate context.
AI and Environmental Analytics
Environmental monitoring systems can incorporate lightweight anomaly-detection models capable of identifying unusual pollution events or thermal spikes.
import numpy as np
from sklearn.ensemble import IsolationForest

data = np.array(pm25_history).reshape(-1,1)

model = IsolationForest(contamination=0.01)
model.fit(data)

prediction = model.predict([[current_pm25]])

if prediction == -1:
    print("Air quality anomaly detected")
Running light-weight anomaly detection at the edge allows monitoring nodes to flag pollution spikes or unusual urban stress conditions without requiring constant cloud analysis.
Edge Computing and Distributed Urban Intelligence
Sending all sensor data to centralized cloud servers can become inefficient as monitoring networks grow.
Edge computing allows environmental monitoring devices to perform preliminary analysis locally. A Raspberry Pi monitoring node can process sensor data, detect anomalies, and transmit only relevant information to remote systems. This architecture supports distributed environmental intelligence across multiple monitoring stations deployed throughout a city.
Engineering Notes
A few technical considerations are especially important in this build:
- sensor enclosure design: protection must not compromise airflow or thermal realism.
- interface stability: mixed I2C and UART systems require careful wiring and power discipline.
- local persistence: robust local logging matters when network connectivity is intermittent.
- data comparability: neighborhood-scale observations are most useful when time stamps and formats are consistent.
- urban deployment reality: power, vandalism, weather, and siting all affect system usefulness.
These factors make the project more than a sensor demonstration. It becomes a prototype urban environmental data infrastructure node.
Validation and Testing
To bring this project closer to engineering-grade documentation, validation should include:
- verify I2C communication with the BME280
- confirm UART parsing from the PMS5003
- check that temperature, humidity, pressure, and PM values remain plausible under known conditions
- test local logging over repeated intervals
- verify external API connectivity where regional comparisons are used
- run extended trials to assess uptime and storage integrity
If the system behaves inconsistently, the issue may come from wiring, enclosure design, power instability, serial parsing, or library configuration rather than from the environmental monitoring concept itself.
Suggested Performance Metrics
For a more rigorous evaluation, the hub can be assessed using several simple metrics:
- sensor stability: consistency of repeated readings under unchanged conditions
- logging reliability: whether observations are stored without loss over long runs
- uptime: how consistently the station continues operating without intervention
- data completeness: whether the expected number of observations is captured over time
- anomaly usefulness: whether flagged events correspond to real environmental changes
Even simple tracking of these metrics improves the project’s value as an experimental urban monitoring platform.
Urban Environmental Monitoring and Sustainable Cities
Projects like this illustrate how accessible computing platforms can support environmental observation systems that contribute to sustainable urban development.
While small monitoring stations cannot replace professional air-quality networks, they can complement them by expanding observation into new locations. In the context of SDG 11 and SDG 13, distributed monitoring systems help communities better understand environmental conditions and respond to emerging climate risks.
Ultimately, sustainable cities depend not only on policy and infrastructure but also on the systems used to observe, measure, and interpret environmental change.
Reproducibility
All code, documentation, and supporting build materials necessary to reproduce the prototype are included in the project repository. The design intentionally relies on widely available Raspberry Pi hardware, open-source Python libraries, and commonly available sensors so that it can be rebuilt in classrooms, labs, and independent monitoring projects.
The system is intended as a reference implementation rather than a certified regulatory station. Engineers adapting it for longer-term deployment should validate power stability, enclosure durability, data retention, sensor maintenance, and siting conditions under real urban operating conditions.
Conclusion
Building a Raspberry Pi urban air quality monitor demonstrates how edge computing and embedded sensing can support climate and pollution monitoring at local scales. By combining atmospheric sensors, particulate monitoring, local storage, and optional climate-data integration, the system creates a flexible platform for urban environmental observation.
Although compact, the design illustrates a broader sustainability principle: urban resilience depends on environmental visibility. When local conditions can be measured clearly and compared across neighborhoods, communities are better positioned to respond to both pollution and heat-related risk.